

Introduction
Chickens are one of the most common agricultural birds and are an excellent model organism for studying the development of vertebrate animals. Therefore, studies on the chicken genome have been of great value to both agriculture and medicine (Wang et al., Reference WANG, HU, WANG, LI, WANG, WANG, TANG and LI2012a).
Economic traits are the most important issues in livestock production as they directly affect market prices. Most economic traits in livestock are multigenic, which are controlled by many genes throughout the genome and by environmental factors, and therefore, they are known as quantitative traits (Gao et al., Reference GAO, ZHANG, HU and LI2007; Zhu and Zhao, Reference ZHU and ZHAO2007). Of these, body weight is a popular economic trait, which is one of indicators related to the growth of the chicken. Many reports relating to the QTLs and candidate genes in relation to body weight and growth in chicken have been published. One experiment compared the growth and feed efficiency between the Ross 308 strain of commercial broiler and the Athens-Canadian Random bred control (ACRBC) strain, which has not been selectively bred since 1957, using similar diets to those fed in both 1957 and in 2001. They reported that there had been a three-fold decrease in the age at which a market weight of 1.8 kg was attained, and a three-fold improvement in feed efficiency between 1957 and 2001. It was estimated that 85-90% of the improvement in growth rate and feed efficiency was due to genetic selection (Havenstein et al., Reference HAVENSTEIN, FERKET and QURESHI2003).
Carcass characteristics are important traits in broiler meat production. It goes without saying that chickens with higher growth rates and better carcass traits are the more desired chickens for the production of meat. Intensive selection efforts have reduced the age at which the market weight (1 - 2 kg live body weight) is achieved (Nadaf et al., Reference NADAF, GILBERT, PITEL, BERRI, FEVE, BEAUMONT, DUCLOS, VIGNAL, PORTER, SIMON, AGGREY, COGBURN and LE BIHAN-DUVAL2007). Among carcass composition traits, breast yield has increased whereas abdominal fat has reduced, creating healthier meat products for consumers and increasing profits for poultry companies (Berri et al., Reference BERRI, WACRENIER, MILLET and LE BIHAN-DUVAL2001).
The QTL approach and identification of functional candidate genes have become the main molecular tools to achieve desired traits in all livestock, including chicken. Along with QTLs, identification of single nucleotide polymorphisms (SNPs) in functional candidate genes has become an effective tool for rapidly determining the association of a specific genetic variant with phenotypic traits. This review provides an overview of QTLs and candidate genes which are associated with economic traits in meat-type chicken.
QTLs for economic traits in chicken
Quantitative trait loci (QTLs) have been mapped for selection response of animal breeding programmes (Sewalem et al., Reference SEWALEM, MORRICE, LAW, WINDSOR, HALEY, IKEOBI, BURT and HOCKING2002). Whole-genome linkage in equilibrium scanning using reference populations is one of the basic methods for QTL identification (Ikeobi et al., Reference IKEOBI, WOOLLIAMS, MORRICE, LAW, WINDSOR, BURT and HOCKING2002). The causative genes and/or mutations for affecting economic traits can be found by tracing significant QTL regions on the chromosomes. Therefore, the causative mutations can be used as markers for the selection of economic traits if there are significant associations between QTL regions and phenotypic traits.
Previous studies reported that many QTLs were found to be associated with economic traits in chicken, such as growth and body composition, egg production, antibody response, disease resistance, and behaviour (Sasaki et al., Reference SASAKI, ODAWARA, TAKAHASHI, NIRASAWA, OYAMADA, YAMAMOTO, ISHII, NAGAMINE, TAKEDA, KOBAYASHI and FURUKAWA2004; Tsudzuki et al., Reference TSUDZUKI, ONITSUKA, AKIYAMA, IWAMIZU, GOTO, NISHIBORI, TAKAHASHI and ISHIKAWA2007; Pinard-van der Laan et al., Reference PINARD-VAN DER LAAN, BED'HOM, COVILLE, PITEL, FEVE, LEROUX, LEGROS, THOMAS, GOURICHON, REPERANT and RAULT2009; Siwek et al., Reference SIWEK, SZYDA, SŁAWIŃSKA and BEDNARCZYK2012; Wiren and Jensen, Reference WIREN and JENSEN2011). These QTL regions provided valuable information for applying marker assisted selection (MAS) for desirable traits at an early stage.
QTL affecting body weight and carcass traits in chicken
The chicken QTL database has been summarised on the National Animal Genome Research Programme (NAGRP) website (http://www.animalgenome.org/cgi-bin/QTLdb). This organisation has been gathering chicken QTL data published during the past 10+ years. Currently, this website contains 3,442 QTLs from 172 publications over the world. Those QTLs represent 286 different traits in all types of chicken. This makes it possible for researchers to compare, confirm and locate the position of both QTLs and those genes responsible for important traits in chicken production. Body weight, which is directly associated with growth rate in broiler, is a major economic trait, and evidently more than 60% of discovered QTLs are related to growth, including body weight, carcass traits etc.
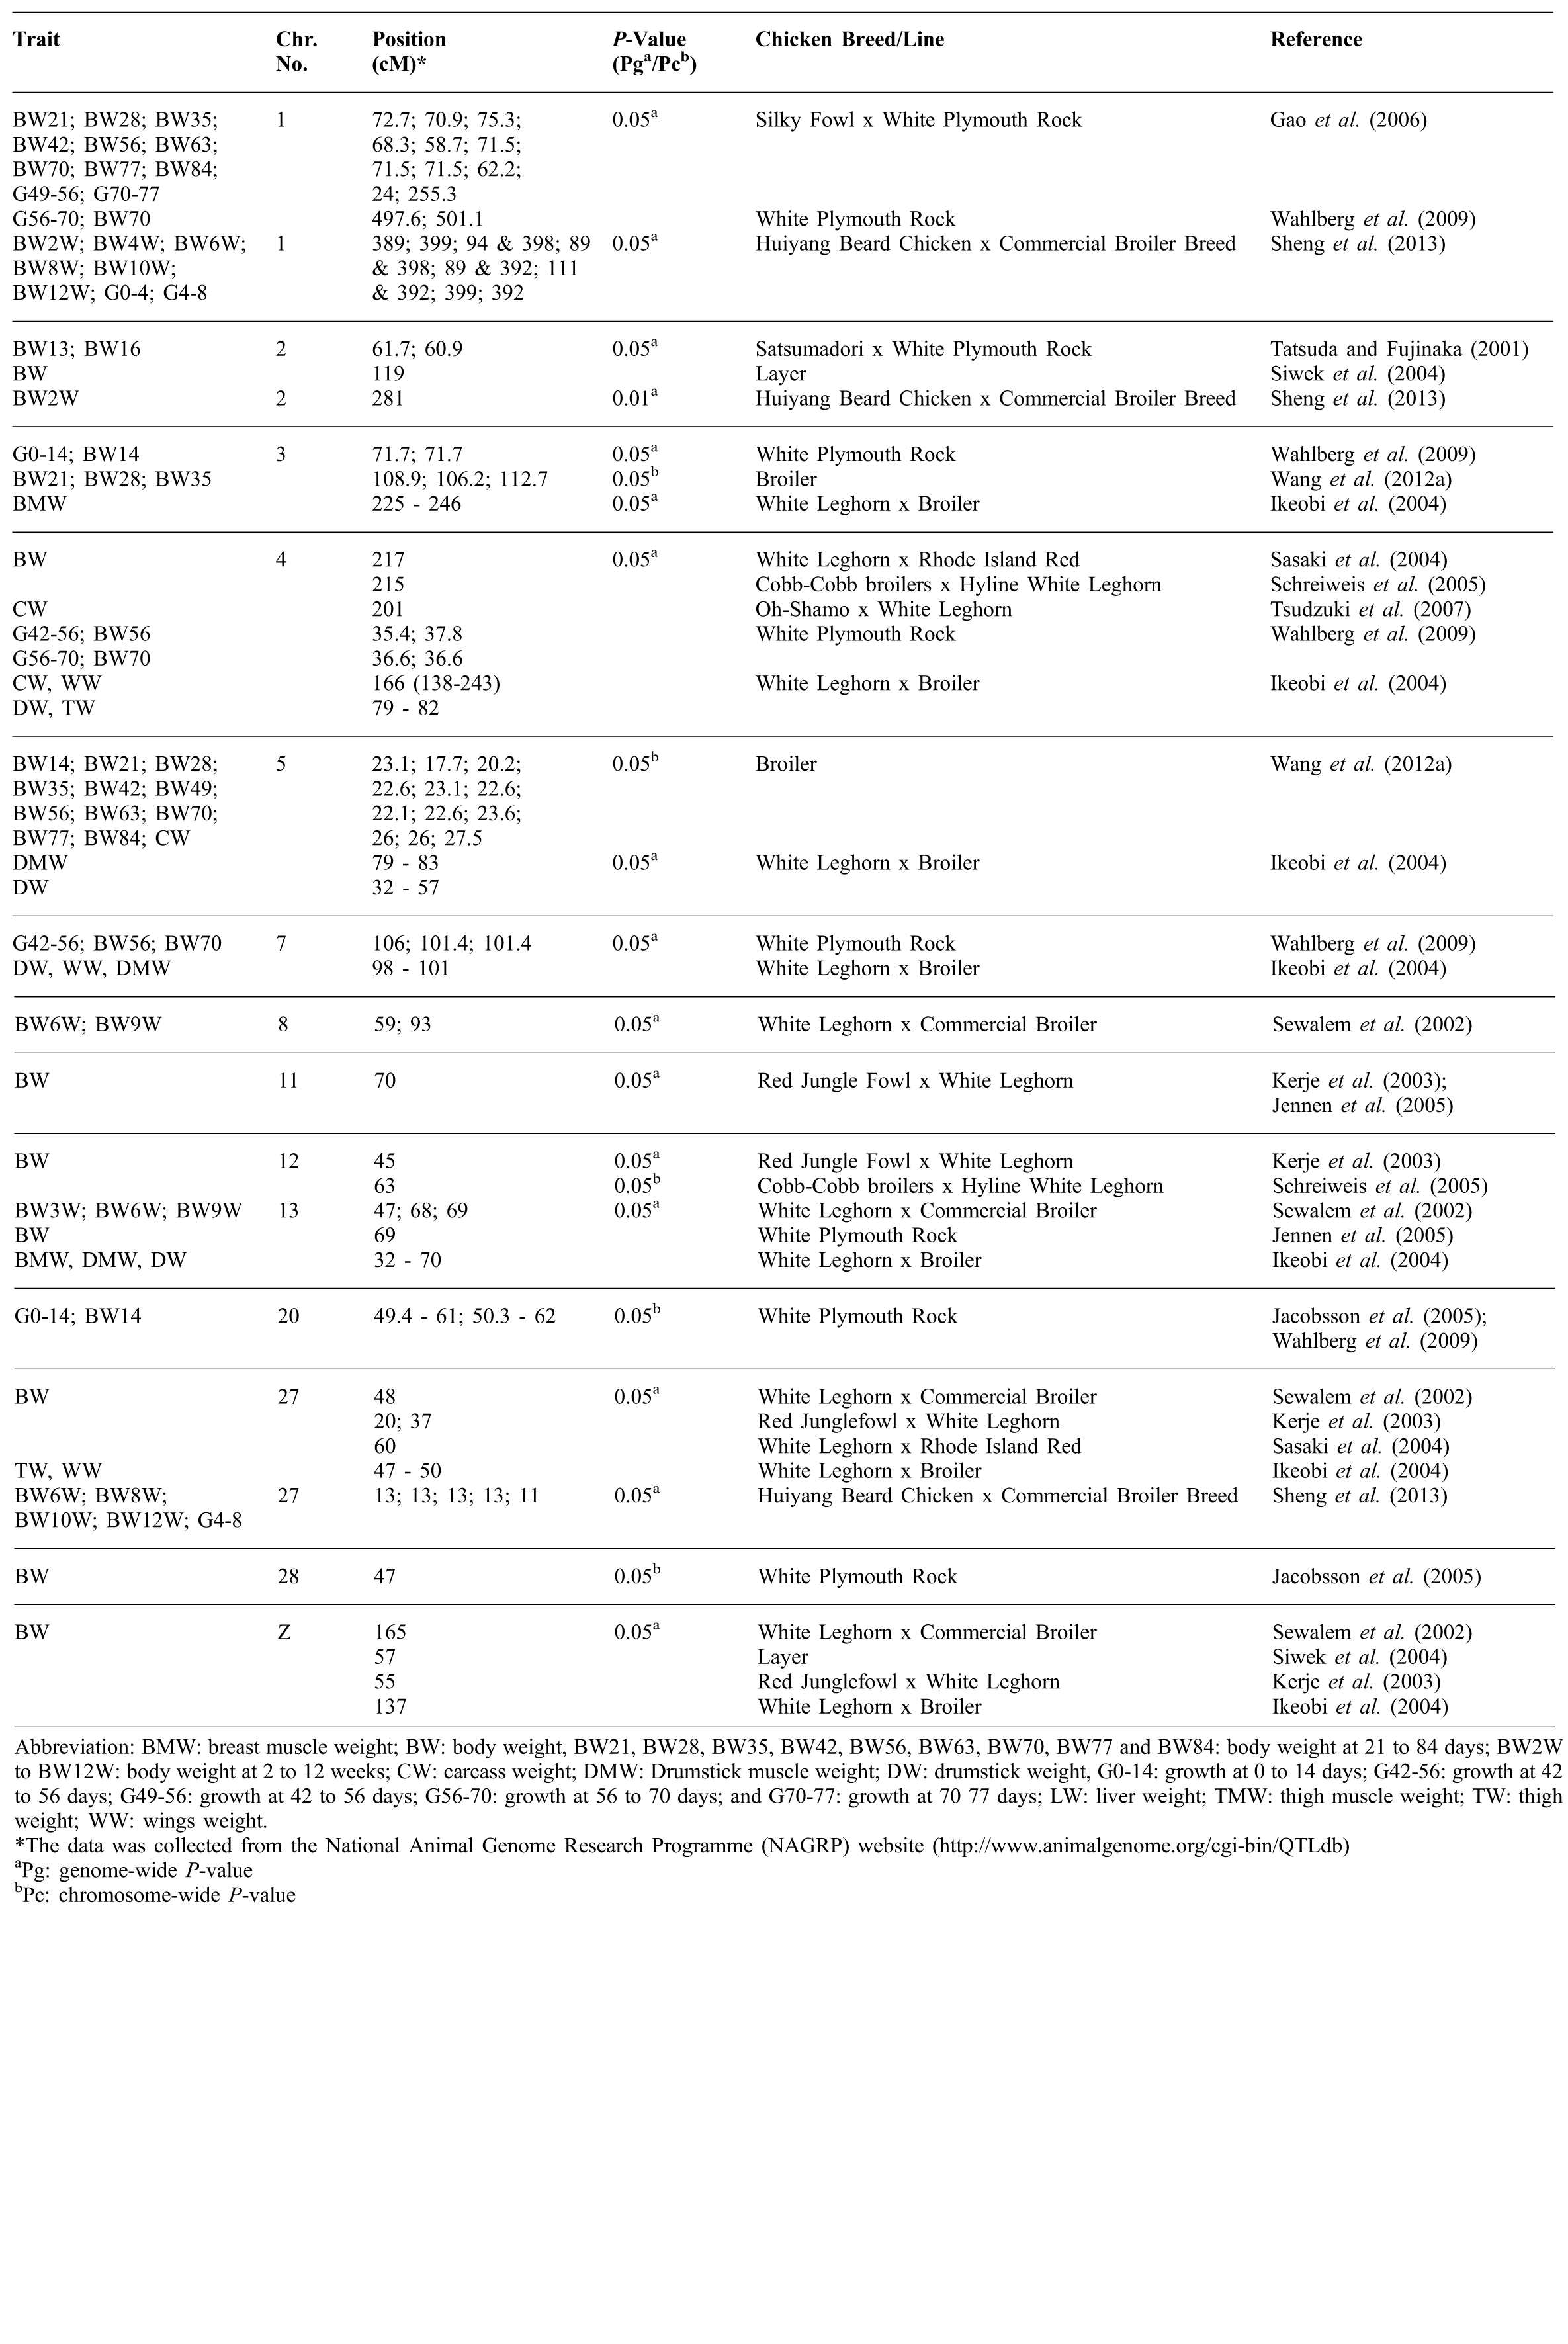
A total of 29 chromosomes, from GGA1 (Gallus gallus chromosome 1) to GGA28 and chromosome Z, have been successfully mapped in various breeds of chicken (Kerje et al., Reference KERJE, CARLBORG, JACOBSSON, SCHUTZ, HARTMANN, JENSEN and ANDERSSON2003; Siwek et al., Reference SIWEK, CORNELISSEN, BUITENHUIS, NIEUWLAND, BOVENHUIS, CROOIJMANS, GROENEN, PARMENTIER and VAN DER POEL2004; Jacobsson et al., Reference JACOBSSON, PARK, WAHLBERG, FREDRIKSSON, PEREZ-ENCISO, SIEGEL and ANDERSSON2005; Jennen et al., Reference JENNEN, VEREIJKEN, BOVENHUIS, CROOIJMANS, POEL and GROENEN2005). Of these, major QTLs for growth-related traits have been commonly identified on GGA1 and/or GGA4. Gao et al. (Reference GAO, HU, DU, DENG, HUANG, FEI, FENG, LIU, DA and LI2006) reported that two QTL regions were strongly linked to body weight and body development of a reciprocal cross of Silky Fowl and White Plymouth Rock on GGA1. The strongest evidence for QTL regions affecting body weights were located at 58.7 to 75.3 cM between GCT0006 and MCW0106 markers. This location was responsible for body weight at 3 to 12 weeks. Also, on the GGA1, the QTLs affecting chicken body development at 7 to 8 weeks and 10 to 11 weeks were investigated between MCW0168 and GCT0006 markers at 24 cM and 255 cM, respectively (Table 1).
In addition, QTL regions located at 497.6 cM and 501.1 cM on GGA1 significantly corresponded with growth at 56 to 70 days and body weight at 70 days were in low-weight selected (LWS) lines and high-weight selected (HWS) lines of the White Plymouth Rock chicken breed (Wahlberg et al., Reference WAHLBERG, FOGLIO, TORDOIR, SYVÄNEN, LATHROP, GUT, SIEGEL and ANDERSSON2009). Sheng et al. (Reference SHENG, PETTERSSON, HU, LUO, QU, SHU, SHEN, CARLBORG and LI2013) claimed that a QTL region located at distal end (389 - 398 cM) and midline one gene (MID1), which is involved in ubiquitin mediated proteolysis (UMP) pathway located at 296.9 cM of GGA1, were associated with growth traits in intercross populations between Chinese indigenous chickens with commercial broilers. This QTL region overlaps with previous results from a genome-wide association study (GWAS) which was conducted using another Chinese indigenous chicken breed (Xie et al., Reference XIE, LUO, ZHANG, ZHANG, TANG, NIE, MA, HU, LI, DA and ZHANG2012).
On GGA4, located at 217 cM between MCW0122 and LEI0062 markers, a QTL for body weight was found after cross-breeding White Leghorn and Rhode Island Red (Sasaki et al., Reference SASAKI, ODAWARA, TAKAHASHI, NIRASAWA, OYAMADA, YAMAMOTO, ISHII, NAGAMINE, TAKEDA, KOBAYASHI and FURUKAWA2004). The QTLs for body weight at six and nine weeks that have a 5% genome-wide significance level were revealed at the same position of this region in different breeds of chicken (Sewalem et al., Reference SEWALEM, MORRICE, LAW, WINDSOR, HALEY, IKEOBI, BURT and HOCKING2002; Tuiskula-Haavisto et al., Reference TUISKULA-HAAVISTO, HONKATUKIA, VILKKI, DE KONING, SCHULMAN and MAKI-TANILA2002). In addition, a QTL associated with growth-related traits was verified on GGA4, located at 215 cM (Schreiweis et al., Reference SCHREIWEIS, HESTER and MOODY2005). Moreover, a QTL residing at 201 cM on chicken chromosome four has been associated with body weight in a crossbreed of Oh-Shamo and White Leghorn (Tsudzuki et al., Reference TSUDZUKI, ONITSUKA, AKIYAMA, IWAMIZU, GOTO, NISHIBORI, TAKAHASHI and ISHIKAWA2007). Wahlberg et al. (Reference WAHLBERG, FOGLIO, TORDOIR, SYVÄNEN, LATHROP, GUT, SIEGEL and ANDERSSON2009) described that QTL regions responsible for chicken average daily gain (ADG) at 42 to 56 days, body weight at 56 days, ADG at 56 to 70 days and body weight at 70 days were located on this chromosome, at 36.6 cM, 36.6 cM, 35.4 cM, and 37.8 cM, respectively (Table 1).
QTLs for body weight and growth were observed in differing regions from previous reports. This may be due to differences between the breeds used in the studies, which could be the main reason for the lack of confirmation of these QTLs (Gu et al., Reference GU, FENG, MA, SONG, WANG, DA, LI, CHEN, YE, GE, HU and LI2011; Xie et al., Reference XIE, LUO, ZHANG, ZHANG, TANG, NIE, MA, HU, LI, DA and ZHANG2012). Therefore, this article aims to provide some clarity in terms of QTLs for chicken body weight. All of this QTL data will be very valuable to those who are interested in the further advancement of poultry breeding programmes.
Carcass weight is related to body weight and body size which is an economically important trait for livestock raised for meat production (Nishimura et al., Reference NISHIMURA, WATANABE, MIZOSHITA, TATSUDA, FUJITA, WATANABE, SUGIMOTO and TAKASUGA2012). The intensive selection of economic traits in broilers has generated an excellent quality of carcass. A previous study crossing White Leghorn and commercial broiler chickens reported that QTL was associated with carcass traits which were found on GGA4 located at 138 - 243 cM (Table 1). Carcass weight (CW), wing weight (WW), and drumstick weight (DW) have 5% genome-wide significance in this location (Ikeobi et al., Reference IKEOBI, WOOLLIAMS, MORRICE, LAW, WINDSOR, BURT and HOCKING2004). The QTL in the same region, at 201 cM of GGA4, was revealed to have association with carcass weight in crossing between Oh-Shamo and White Leghorn chicken (Tsudzuki et al., Reference TSUDZUKI, ONITSUKA, AKIYAMA, IWAMIZU, GOTO, NISHIBORI, TAKAHASHI and ISHIKAWA2007). Thus, this can be used as a strong candidate region for carcass quality, even though further verification within other breeds is necessary for the identification of causative mutations.
Functional candidate genes for economic traits in chicken
Exploration of functional candidate genes is another popular approach for QTL identification. It is an effective and useful tool for quickly determining the association of a specific genetic variants with phenotypic traits (Zhu and Zhao, Reference ZHU and ZHAO2007). The candidate gene approach has been widely applied in medicine, agriculture, and other fields of life sciences, and has achieved useful results in the study of genes responsible for human health and disease, quantitative traits in animals and plants, and also evolutionary genetics. In the livestock species, especially in chickens, this method was used for decades to identify genes associated with economic traits. Below is a summary of a few candidate genes affecting economic traits in meat-type chicken.
thyroid hormone responsive spot 14
Thyroid Hormone Responsive Spot 14 (THRSP), referred to as the ‘spot14’ gene, encodes a small acidic protein that is rapidly induced by thyroid hormone (T3) and dietary carbohydrate in liver. This protein, which acts in hepatocytes, was discovered in earlier studies on the activity of thyroid hormone (TH) (Seelig et al., Reference SEELIG, LIAW, TOWLE and OPPENHEIMER1981; Jump et al., Reference JUMP, NARAYAN, TOWLE and OPPENHEIMER1984; Kinlaw et al., Reference KINLAW, CHURCH, HARMON and MARIASH1995), and the THRSP gene has been used as a model for the regulation of de novo lipogenesis for many years. A discrepancy of THRSP mRNA content in tissue affects its ability to synthesise lipids. The expression of THRSP correlates with a sensitivity of both lipogenesis and insulin. Specifically, the level of THRSP mRNA in white, brown adipose tissues, and in the liver is elevated when de novo fatty acid synthesis is induced by dietary and hormonal stimulations (Breuker et al., Reference BREUKER, MOREAU, LAKHAL, TAMASI, PARMENTIER, MEYER, MAUREL, LUMBROSO, VILAREM and PASCUSSI2010).
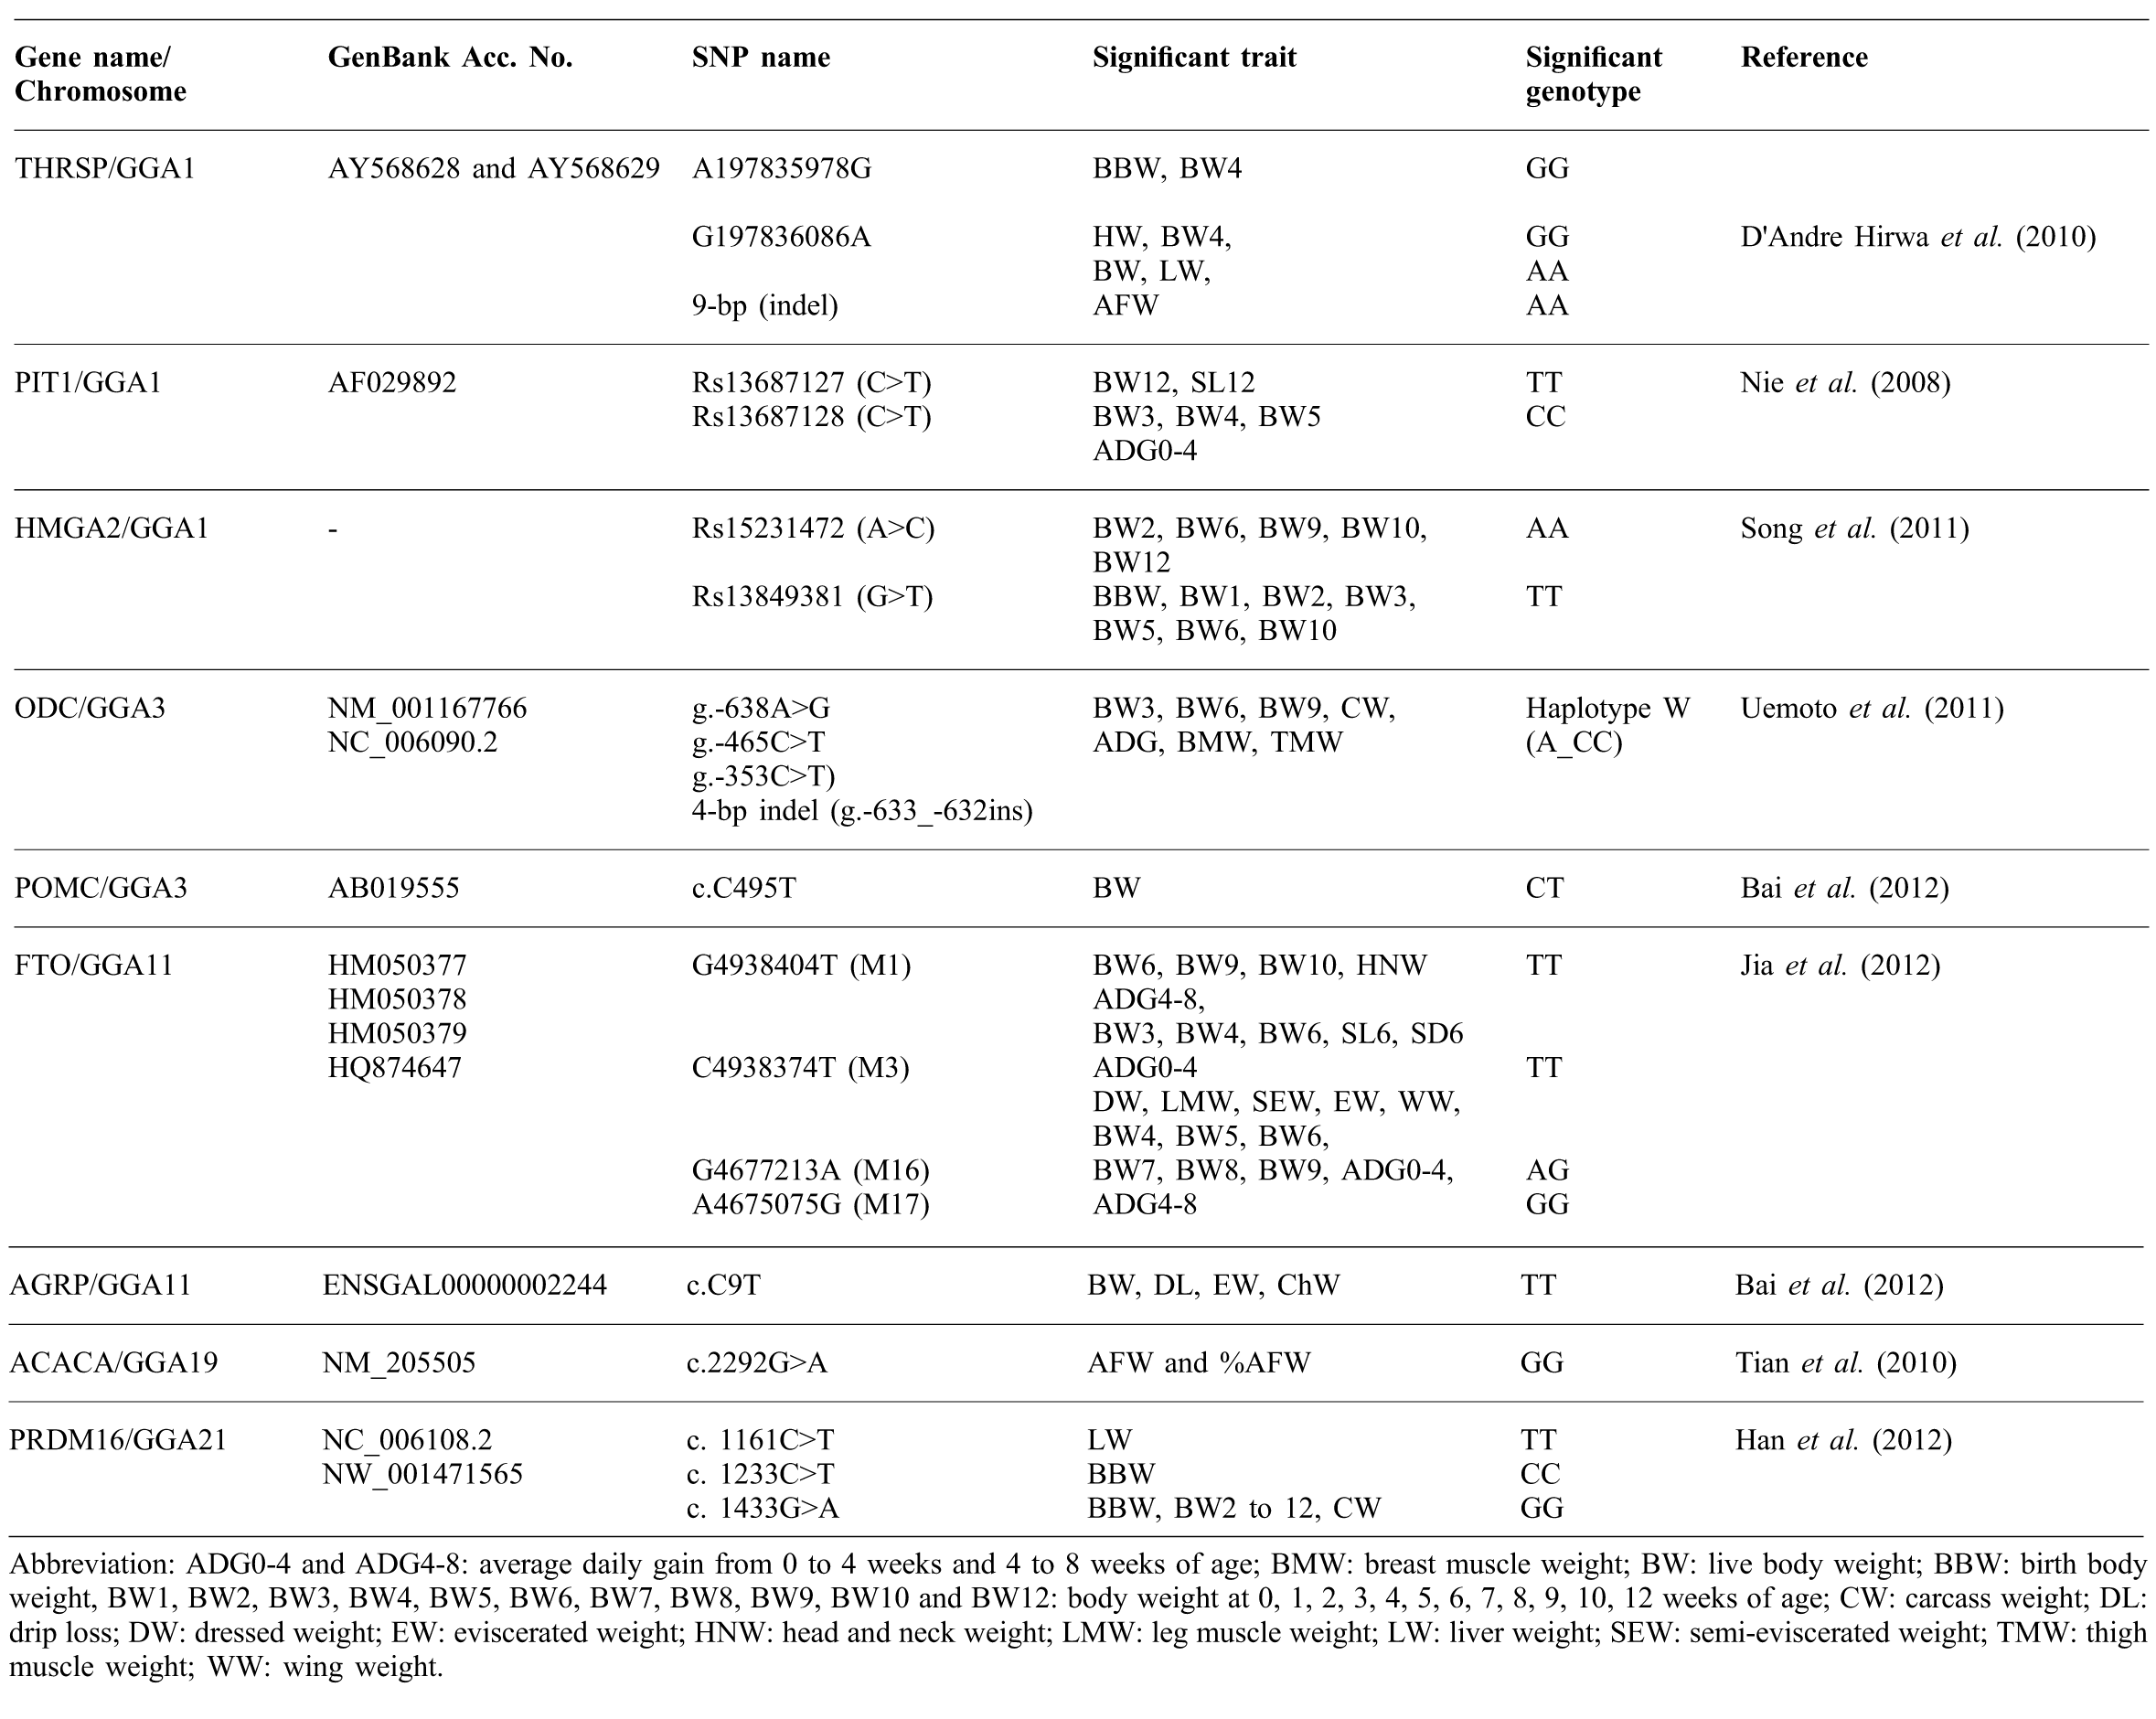
The polymorphism of THRSP gene was discovered in the putative protein coding region of the duplicated chicken THRSPα (9 bp) and THRSPβ (6 or 12 bp) genes. Polymorphism in the THRSP locus has been associated with abdominal fat traits in crossing broiler and Leghorn chicken populations (Wang et al., Reference WANG, CARRE, ZHOU, LAMONT and COGBURN2004). In addition, the A213C SNP and 9 bp insertion-deletion (indel) of the thyroid hormone responsive spot 14α (THRSPα) gene was found to be tightly linked with body weight (BW), which implied that THRSPα gene has an important effect on the growth of chickens (Cao et al., Reference CAO, WANG, WANG, WANG and LI2007). Moreover, d'Andre Hirwa et al. (Reference D'ANDRE HIRWA, YAN, WALLACE, NIE, LUO, LI, SHEN, SUN, TANG, LI, ZHU, YANG and ZHANG2010) reported that the A197835978G and G197836086A SNPs, and 9 bp indel of THRSPα gene were associated with body weight and carcass traits in crossbred chicken between White Recessive Rock and Xinghua (Table 2). Hence, this gene should be related to important economic traits in meat-type chickens.
ornithine decarboxylase
Ornithine decarboxylase (ODC) is a pyridoxal-5’-phosphate dependent enzyme that presents a critical step in the synthesis of polyamines, particularly putrescine, spermidine and spermine (Kern et al., Reference KERN, OLIVEIRA, COFFINO and HACKERT1999). Polyamines, small organic polycations, are essential for stabilising DNA structure, the DNA double strand-break repair pathway and as antioxidants. Therefore, ODC is an essential enzyme for cell growth. This gene also plays a key role in diverse biological processes, such as differentiation, transformation, and apoptosis in mammals (Pendeville et al., Reference PENDEVILLE, CARPINO, MARINE, TAKAHASHI, MULLER, MARTIAL and CLEVELAND2001).
In chicken muscle, the higher mRNA expression of the ODC gene was followed by higher enzyme activity in chicken lines genetically selected for both rapid growth rate and egg production. The ODC mRNA levels and enzyme activity in broiler lines were significantly higher than those of White Leghorn line. These results suggest that the ODC gene may play an important role in cell growth (Johnson et al., Reference JOHNSON, BULFIELD, TAIT and GODDARD1995). The QTL study in Shamo and White Plymouth Rock cross chicken, the QTLs on chromosome 3 (GGA3) located at 263 - 456 cM were strongly correlated with growth and carcass traits (Uemoto et al., Reference UEMOTO, SATO, ODAWARA, NOKATA, OYAMADA, TAGUCHI, YANAI, SASAKI, TAKAHASHI, NIRASAWA and KOBAYASHI2009). This region is adjacent to where the ODC gene resides, at 267.4 cM on chromosome three. Two haplotypes, haplotype W (A_CC) derived from White Plymouth Rock, and haplotype S (GCCCGTT) derived from Shamo, were distinguished as being constructed by four different SNPs, including g.-638A>G SNP, g.-465C>T SNP, g.-353C>T) SNP, and a 4-bp indel mutation (g.-633_-632ins) (Table 2). The significance relationship between haplotypes and growth and carcass traits was measured in body weight at 3 weeks (BW3), BW6, BW9, carcass weight (CW), average daily gain (ADG), breast muscle weight (BMW), and tight muscle weight (TMW), where haplotype W (A_CC) have positive effects on all traits (Uemoto et al., Reference UEMOTO, SATO, OHTAKE, OKUMURA and KOBAYASHI2011).
prd1-bf1-riz1 homologous containing 16
The PRD1-BF1-RIZ1 homologous domain containing 16 gene (abbreviated as PRDM16) acts as a transcription co-regulator, which controls the development of brown adipocytes in brown adipose tissue (BAT) and manages a bidirectional cell fate switch between skeletal myoblasts and brown fat cells. It should bind to peroxisome-proliferator-activated receptor-c (PPAR-c) and is thought to activate its transcriptional function to encourage brown adipogenesis (Seale et al., Reference SEALE, BJORK, YANG, KAJIMURA, CHIN, KUANG, SCIME, DEVARAKONDA, CONROE, ERDJUMENT-BROMAGE, TEMPST, RUDNICKI, BEIER and SPIEGELMAN2008).
In animals, enhancement of BAT is correlated with lean and healthy phenotypes in rat (Ghorbani et al., Reference GHORBANI, CLAUS and HIMMS-HAGEN1997). On the other hand, the lack of BAT function in mice is associated with obesity and metabolic disease (Lowell et al., Reference LOWELL, S-SUSULIC, HAMANN, LAWITTS, HIMMS-HAGEN, BOYER, KOZAK and FLIER1993). Based on these functions, an association study between PRDM16 gene with growth and fat-related traits in livestock would be very interesting, especially for investigations in broilers. An association study using Chinese native chicken crossing Gushi (representing slow-growing Chinese native chickens) and Anka (representing fast-growing broilers) has been linked with growth, fatness and meat quality. In detail, the c. 1433 G>A SNP had positive effects on body weight and body size, whereas GG genotype was favourable for growth and fatness (Han et al., Reference HAN, WEI, KANG, CHEN, SUN, LI, BAI, TIAN and HUANG2012). This gene has been located at 12 cM on chromosome 21 (GGA21), the upstream of QTL position (17.84 cM), which is significantly associated with growth in the White Leghorn chicken line (Dorshorst et al., Reference DORSHORST, SIEGEL and ASHWELL2011).
fat mass and obesity associated gene
The fat mass and obesity associated gene (FTO) encodes fat mass and obesity-associated proteins with a novel C-terminal alpha-helical domain and an N-terminal double-strand beta-helix domain, which is conserved in Fe (II) and alpha-ketoglutarate-dependent dioxygenase family (Gao et al., Reference GAO, SHIN, LI, WANG, TONG and ZHANG2010). In humans, FTO is the first gene found to have a role in human obesity, and exhibits energy balance functions (Do et al., Reference DO, BAILEY, DESBIENS, BELISLE, MONTPETIT, BOUCHARD, PERUSSE, VOHL and ENGERT2008). The identified SNP in intron 1 of FTO gene in human is closely linked to obesity related traits, while the deletion of FTO allele in mice has generated immediate postnatal retardation, resulting in shorter body length, lower body weight, and lower bone mineral density than control mice, where body composition (fat mass, total tissue mass, and fat content) was relatively normal (Gao et al., Reference GAO, SHIN, LI, WANG, TONG and ZHANG2010). In chicken, FTO gene expression has been examined in both broilers and layers. This gene is highly expressed in chicken hypothalamus, liver, visceral fat and cerebellum, which are known to be involved in energy balance (Wang et al., Reference WANG, RAO, YUAN, EVERAERT, BUYSE, GROSSMANN and ZHAO2012b). Significant correlations were determined between this gene and growth, body composition, and fatness traits, in F2 populations crossing between Xinghua and Recessive White Rock chicken lines in China (Jia et al., Reference JIA, NIE, LAMONT and ZHANG2012).
other candidate genes
Identified functional candidate genes related to economic traits in chicken include pituitary-specific positive transcription factor 1 (PIT1), high mobility group AT-hook 2 (HMGA2), pro-opiomelanocortin (POMC) and agouti-relatedprotein (AGRP), acetyl-COA carboxylase α (ACACA) and others (Table 2).
PIT1, a pituitary-specific transcription factor, plays an important role in pituitary development and hormone expression. Protein expressed by this gene is responsible for high affinity DNA binding with genes encoding for growth hormone (Mukherjee and Porter, Reference MUKHERJEE and PORTER2012). A previous study revealed that variations in this gene were correlated with body weight, growth and body composition in different stages (Nie et al., Reference NIE, FANG, XIE, ZHOU, LIANG, LUO, WANG, BI, LIANG, ZHANG and ZHANG2008). This gene is located on chicken chromosome one, where the QTL location was detected for body weight (Sewalem et al., Reference SEWALEM, MORRICE, LAW, WINDSOR, HALEY, IKEOBI, BURT and HOCKING2002). Another functional candidate gene for body weight in the QTL region is HMGA2. This gene is involved in diet-induced obesity, acts as a transcriptional regulating factor, and appears to have a function in proliferation and differentiation during the development of cells (Cattaruzzi et al., Reference CATTARUZZI, ALTAMURA, TESSARI, RUSTIGHI, GIANCOTTI, PUCILLO and MANFIOLETTI2007). Three SNPs, namely rs13849341, rs15231472 and rs13849381, were strongly associated with body weight, as determined in a reciprocal crossing between White Plymouth Rock and Silky Fowl chickens (Song et al., Reference SONG, GU, FENG, WANG, GAO, HU and LI2011). In addition, the POMC gene encodes a polypeptide hormone precursor, which is known as prohormone convertase, was identified on chromosome three at 303.3 cM. A recent study of chickens, synonymous mutations (C495T) in the coding region of the gene, was significantly correlated with body weight. Furthermore, AGRP and ACACA genes were strongly associated with body weight (Tian et al., Reference TIAN, WANG, WANG, LENG, HU and LI2010; Bai et al., Reference BAI, SUN, KANG, HAN, TIAN, LI, WEI and ZHU2012).
Conclusions
This review discusses the QTL regions and candidate genes which have been correlated with economic traits of interest in meat-type chicken. The QTL regions in GGA1 and GGA4 were reported to be strongly associated with body weight and carcass-related traits in various breeds of chicken. In addition, candidate genes were determined to have positive associations with economic traits in meat-type chicken. This article represents the current status of QTLs and candidate genes for meat-type chicken, which will provide the guidelines for poultry breeders attempting to create chicken breeds with improved performance.
Acknowledgment
This work was supported by a grant from the Next-Generation BioGreen21 Programme (No. PJ008133012012), Rural Development Administration, Republic of Korea.
QTL locations affecting growth and carcass traits in chicken.

Abbreviation: BMW: breast muscle weight; BW: body weight, BW21, BW28, BW35, BW42, BW56, BW63, BW70, BW77 and BW84: body weight at 21 to 84 days; BW2W to BW12W: body weight at 2 to 12 weeks; CW: carcass weight; DMW: Drumstick muscle weight; DW: drumstick weight, G0-14: growth at 0 to 14 days; G42-56: growth at 42 to 56 days; G49-56: growth at 42 to 56 days; G56-70: growth at 56 to 70 days; and G70-77: growth at 70 77 days; LW: liver weight; TMW: thigh muscle weight; TW: thigh weight; WW: wings weight.
*The data was collected from the National Animal Genome Research Programme (NAGRP) website (http://www.animalgenome.org/cgi-bin/QTLdb)
aPg: genome-wide P-value
bPc: chromosome-wide P-value
Candidate genes affecting body weight, carcass and meat quality traits in chicken.
Abbreviation: ADG0-4 and ADG4-8: average daily gain from 0 to 4 weeks and 4 to 8 weeks of age; BMW: breast muscle weight; BW: live body weight; BBW: birth body weight, BW1, BW2, BW3, BW4, BW5, BW6, BW7, BW8, BW9, BW10 and BW12: body weight at 0, 1, 2, 3, 4, 5, 6, 7, 8, 9, 10, 12 weeks of age; CW: carcass weight; DL: drip loss; DW: dressed weight; EW: eviscerated weight; HNW: head and neck weight; LMW: leg muscle weight; LW: liver weight; SEW: semi-eviscerated weight; TMW: thigh muscle weight; WW: wing weight.