I. INTRODUCTION
β-Zn4Sb3 has for long been investigated as a suitable thermogenerator material with thermoelectric figure of merit (ZT) values close to 1.3 at elevated temperatures (673 K).Reference Caillat, Fleurial and Borshchevsky1 The high ZT in this system arises due to the extremely low thermal conductivity with κ L values around 0.3 W/mK above 500 K. Detailed structural investigations indicate a disordered structure with the presence of interstitial Zn positions to be the likely cause of the low κ L.Reference Snyder, Christensen, Nishibori, Caillat and Iversen2 The interstitial Zn is reported to cause local structural distortions into many nearly isoenergetic geometrically metastable phases resulting in a liquid-like diffusivity of the interstitial Zn.Reference Toberer, Sasaki, Chisholm, Haile, Goddard and Snyder3 Also, theoretical calculations indicate an entropy-assisted stabilization of the β-Zn4Sb3 phase at the cost of the ZnSb phase above room temperatures.Reference Toberer, Sasaki, Chisholm, Haile, Goddard and Snyder3 Thus, the presence of Zn disorder and phase stability in this material is interrelated and the β phase has been reported to have poor thermal stability. The effect of different preparation parameters has been studied, and it is reported that phase purity of the starting powder (zone melted versus quenched), grain size, density of the compacted specimens, ambient atmosphere (inert, air, or vacuum), and chemical substitutions (effect of Cd) can have a significant influence on the degradation rate depending on the extent of Zn loss during the process and following thermal cycles.Reference Pedersen and Iversen4–Reference Pedersen, Birkedal, Nygren, Frederiksen and Iversen9 In a previous report, we have studied the influence of grain size and synthesis method on the variation of the thermoelectric properties.Reference Stiewe, Dasgupta, Boettcher, Pedersen, Mueller and Iversen10 Our results indicated a wide distribution of the values of the thermoelectric properties (S, σ, and κ) in the starting materials and the possibility of the simultaneous presence of multiple phases of Zn4Sb3 in the different samples.
Thus, the aim of this study is to identify different phases of Zn4Sb3 that might arise depending on the synthesis conditions and relate them to the specific values of the lattice thermal conductivity. For this purpose, Zn4Sb3 powders synthesized by the quench and zone-melting (ZM) techniques have been taken as the starting powders and compacted under different conditions by a direct current (DC)-assisted uniaxially pressured sintering (STS) and spark plasma sintering (SPS) techniques. The resulting compacts were then probed using surface potential Seebeck microprobe (PSM) scans, and electron backscatter diffraction (EBSD) to identify the different phases. Lattice thermal conductivity was further calculated for the different specimens and its dependence on the different observed phases has been discussed.
II. EXPERIMENTAL
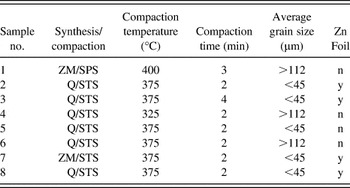
Ingots of Zn4Sb3 have been prepared via a ZM techniqueReference Iversen, Lundtoft, Christensen and Platzek11 and quenching of the material from the melt, respectively. Stoichiometric ratios of 99.99% purity Zn shots and 99.5% purity antimony powder were sealed in a quartz glass ampoule and heated to 700 °C in a horizontal furnace under continuous rotation for 2 h before quenching in ice water. Part of this polycrystalline material was used as a feeding rod in the ZM process, where it is placed on top of a nonstoichiometric rod (Zn52Sb48) in a quartz glass ampoule. The interface between the feeding and the nonstoichiometric rods was melted in an induction furnace, and the ampoule was moved slowly through the heating zone under continuous rotation. The resulting ingots from the quenched and the ZM processes have been ground and sieved through 112-μm and 45-μm sieves. Particle size fractions >112 μm and <45 μm have been used for this study. The different starting powders were compacted in a graphite die under dynamic vacuum using a commercial STS (Dr. Fritsch DSP 510 SA; SPS SYNTEX INC, Japan) and SPS (Dr. Sinter 1500 SPS-525S, SPS SYNTEX INC) under different process conditions as listed in Table I (It is to be noted that the indicated temperature is a control temperature, which is not necessarily identical to the sample temperature. As the SPS and STS compactions have been carried out in different apparatus with somewhat different geometry, the sample temperatures for the two processes cannot be directly compared). The pellet dimensions were 15/12.6 mm diameter and 2–3 mm thickness for the STS/SPS. The current through the graphite assembly in the STS process (continuous DC) was ∼200 A, whereas that in the SPS process (pulsed DC) was ∼250–300 A (at the maximum temperature). For some of the specimens, zinc foils were placed on both sides of the starting powders during compaction. The STS compactions were carried out under a uniaxial pressure of 60 MPa, whereas the pressing for SPS was carried out at 100 MPa.
List of the different parameters used for compaction.

ZM, zone melted; SPS, spark plasma sintering; Q, quenched; STS, direct current-assisted uniaxially pressured sintering.
PSM measurements were carried out along the cross section (in the direction of pressing) using an in-house built apparatus.Reference Ziolkowski, Karpinski, Platzek, Stiewe and Mueller12 Using this technique, it is possible to obtain information regarding the local distribution of the Seebeck coefficient values with a spatial resolution of ∼10 μm. EBSD measurements (HKL Oxford Instruments, Oxfordshire, UK) were carried out on select samples, which were initially embedded at room temperature and fine polished using standard metallography technique to obtain scratch-free surfaces. EBSD images were then obtained from these specimens at an electron excitation voltage of 20 kV and a spot size of 0.5 × 0.5 μm2. The generated patterns were analyzed for phase identification carried out from a list of reported structural database.
To obtain volumetric phase information, the compacted specimens were recrushed and powder x-ray diffraction (XRD) was carried out in a Siemens D5000 diffractometer (Siemens, Germany) using Cu Kα radiation.
The temperature dependence of the thermal conductivity between room temperature and 350 °C was calculated on select specimens from the product of the measured diffusivity, specific heat, and mass density values. The thermal diffusivity measurements were carried out in a Netzsch LFA 427 apparatus (Netzsch, Germany) and the specific heat in a Netzsch DSC 404 differential scanning calorimeter. The specimen density was measured using the Archimedes technique in an aqueous medium (distilled water) and ranged within 95–97% of the theoretical density. The electronic thermal conductivity for the different specimens was calculated from the Wiedemann–Franz law using the measured electrical conductivity. The electrical conductivity measurements were carried out using the four-point probe method in an in-house built apparatus. The lattice contribution to the thermal conductivity (κ L) was further calculated from the difference between the overall and electronic components.
III. RESULTS AND DISCUSSION
A. PSM analysis
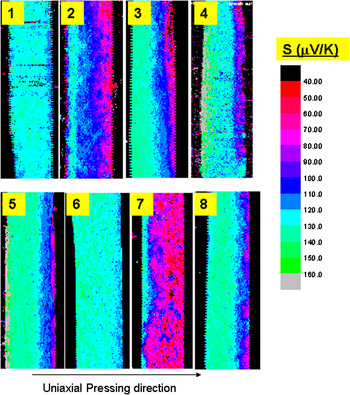
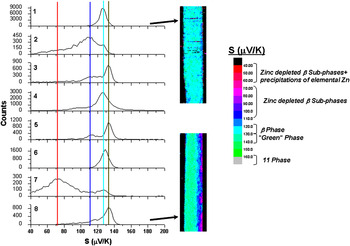
In Fig. 1, the PSM data along the cross section of the different specimens are shown. A wide variation in the Seebeck (S) coefficient values is observed depending on the synthesis conditions. In all the STS samples, a gradation in the S values is also observed due to the electromigration of Zn in the DC field. To quantify the mean S values, the frequency distribution plots for the different specimens are shown in Fig. 2. Peaks in the frequency distribution plots provide valuable information regarding phases present, microstructure, and homogeneity depending on the peak position and profile (broadening and asymmetry). The peak profiles and position vary among different specimens as observed from Fig. 2. Sample 1 has a narrow distribution with a maximum at an S value of 126 μV/K. Because this sample has shown no changes in the transport properties after thermal cycling and the XRD of the synthesized powder was indexed to the β-Zn4Sb3 phase, the S value of 126 μV/K might correspond to the reported three interstitial β-Zn4Sb3 phase.Reference Snyder, Christensen, Nishibori, Caillat and Iversen2 Thus, S values close to 126 μV/K (light blue color in Fig. 2) are indicative of the β-Zn4Sb3 phase. In some of the other specimens (2, 4, 6, 7), the β phase is present in various amounts as observed from the position of the histogram peaks in Fig. 2 and also from the color map of the S scans in Fig. 1. Another sharp peak in the distribution occurs at 133 μV/K (green color in Fig. 2) and recurs in different specimens. This “green” phase is the majority phase in specimens 3, 5, and 8 as seen in Figs. 1 and 2. Though the β phase and the “green” phase have small difference in S values, the narrow width of their individual frequency distribution and the recurrence in different samples would indicate them to be different phases. Further proof of this is provided later in the EBSD imaging.
Potential Seebeck microprobe (PSM) scans along the cross section of the different specimens. The specimen numbers are same as that given in Table I.

Frequency distribution of the S values for the different specimens. The PSM scans for specimens 1 and 8 are included to show the difference in the absolute S values.

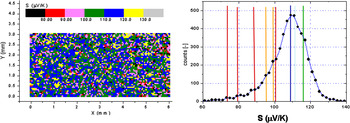
In some of the specimens, a broad distribution of the S values ranging from 40 to 120 μV/K is observed in Fig. 2. Such broad distributions are indicative of phase mixtures or compositional inhomogeneity.Reference Ziolkowski, Karpinski, Platzek, Stiewe and Mueller12 In our previous work,Reference Stiewe, Dasgupta, Boettcher, Pedersen, Mueller and Iversen10 different specimens were seen to have S values ranging between 70 and 120 μV/K. The surface S scan and the frequency distribution of one of these samples are reproduced in Fig. 3. The frequency distribution shows a characteristic undulation with multiple shallow maxima each indicative of distinct S values. Recurrence of same S values was observed in the different specimens, which indicated the presence of distinct phases rather than a phase mixture. As these specimens had undergone different amounts of degradation (Zn loss), it was inferred that these distinct S values correspond to different subphases of β-Zn4Sb3 with varying amounts of interstitial zinc. The quantized nature of these S values would also indicate the presence of different subphases rather than an effect of gradual but continuous Zn loss from the β-Zn4Sb3 phase. From the S map in Fig. 3, the subphases can be observed to form an interpenetrating microstructure. Thus, the regions corresponding to S values between 70 and 120 μV/K in Figs. 1 and 2 would indicate the presence of Zn-poor β-Zn4Sb3 subphases.
PSM scan and frequency distribution plot in a compacted Zn4Sb3 specimen.Reference Stiewe, Dasgupta, Boettcher, Pedersen, Mueller and Iversen10 An interpenetrating Seebeck microstructure is observed from the PSM scan. The resultant frequency distribution shows multiple close by features (maxima and smeared side-maxima forming shoulders) indicative of the different β-Zn4Sb3 subphases.

Regions with S values <70 μV/K in the distribution plot in Fig. 2 are indicative of phase mixtures with a metallic phase. XRD results given in the next section indicate the presence of metallic Zn to be the likely cause. In some of the specimens (4 and 5), regions with S values >160 μV/K are observed (gray regions in Fig. 1). Because of the minor area fraction of these regions, these appear as a broad tail in the frequency distribution plots toward higher S values (see Fig. 2; specimens 4 and 5). These regions correspond to the ZnSb phase, which is reported to have high S values.
Thus, the PSM data indicate the presence of multiple phases in the different specimens with distinct S values ranging from 40 to 160 μV/K. The majority phases in the different specimens being the β-Zn4Sb3 phase with S ∼126 μV/K, the “green” phase with S ∼133 μV/K, and the Zn-depleted β-Zn4Sb3 subphases with S ∼70–160 μV/K. Minor amounts of phase mixtures with metallic Zn with S < 70 μV/K and the ZnSb phase with S > 160 μV/K are also observed in some of the specimens.
B. XRD and EBSD analyses
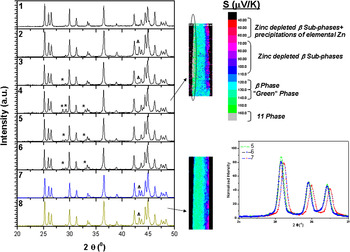
Results of XRD analysis carried out on different specimens are shown in Fig. 4. Minority peaks corresponding to the ZnSb phase and elemental Zn were observed in some of the specimens. Because Zn peaks were observed only in samples 2, 3, 7, and 8 where zinc foils were used, diffusion of elemental Zn near the surfaces from the foils is likely to be the cause. The PSM micrographs for samples 4 and 8 are also shown in the figure. XRD peaks of sample 4 corresponding to the ZnSb phase also show the gray regions with high S values. It also contains the “green” phase adjacent to the gray regions. Similarly, the PSM micrograph for sample 8 indicates the “green” phase to be in majority. The XRD image of this sample, however, does not show any ZnSb peaks, indicating the “green” phase to be different from the ZnSb phase.
X-ray diffraction (XRD) of the different specimens. *, ZnSb phase; Δ, zinc. PSM scans of specimens 4 and 8 are included. In specimen 4, the region corresponding to the ZnSb phase is encircled. A comparison of the XRD peak position in samples 5, 6, and 7 is also given to highlight the minor differences in 2θ positions, relative peak intensities, and the peak broadening.

The majority peaks in all the specimens could be indexed (2θ positions) to the reported β-Zn4Sb3 phase with the three interstitial modelReference Snyder, Christensen, Nishibori, Caillat and Iversen2; however, minor differences in the 2θ positions, peak broadening, and relative peak intensities could be observed between the different samples. A comparison between samples 5, 6, and 7 is shown in Fig. 4, which consisted of the “green” phase, β-Zn4Sb3 phase, and Zn-poor β-Zn4Sb3 subphases, respectively, as the majority phases as interpreted from our PSM results.
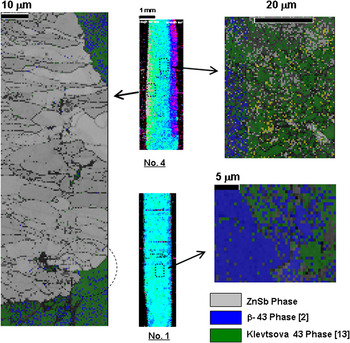
To acquire further information regarding the “green” phase, EBSD measurements were carried out on selected specimens. Specimen 4 was chosen for this study because it contained both the ZnSb and the “green” phase as observed from the PSM data. The measurements were carried out at different regions, both near the surface and in the interior of the pellet. The EBSD phase map data for this specimen is shown in Fig. 5. For phase identification, different reported phases of Zn–Sb compounds were taken from the structural database. As observed from Fig. 5, for the region close to the surface, both the ZnSb phase and a phase best matched to the Zn4Sb3 phase reported by Klevtsova and BokiiReference Bokii and Klevtsova13 were observed. Thus, the “green” phase identified from PSM measurements is likely the Klevtsova phase (It is to be noted that EBSD information is not a structure determination tool and can only indicate the best matched phase from a given database. This result suggests the “green” phase to be the closest matched to the Klevtsova phase among all reported structures for Zn4Sb3). Further, the ZnSb phase is seen to share boundaries with the “green” Klevtsova phase, which is similar to the PSM results. Small regions of the β-Zn4Sb3 phase were also seen to be intermixed with the “green” Klevtsova phase. Thus, the EBSD results supplement our PSM observation of the “green” phase being a distinct Zn4Sb3 phase.
Electron backscatter diffraction (EBSD) phase maps for specimens 1 and 4. The PSM scans along with the regions where the EBSD imaging were performed are indicated.

EBSD phase maps from the interior of specimens 1 and 4 are also shown in Fig. 5. It is seen that specimen 4 is composed of mainly the “green” Klevtsova phase mixed with smaller regions of the β-Zn4Sb3 phase and regions of unindexed phases. In specimen 1, the situation is reversed with the majority phase being β-Zn4Sb3. This is also in accordance with our PSM observation as shown in Fig. 5.
Thus, based on the PSM, XRD, and EBSD results, different phases close to stoichiometric Zn4Sb3 have been identified, which have distinct S values ranging from 70 to 140 μV/K. These phases are: β-Zn4Sb3 phase, “green” Klevtsova phase, and Zn-depleted β-Zn4Sb3 subphases. In the next section, the influence of these different phases on the lattice thermal conductivity is discussed.
C. Lattice thermal conductivity
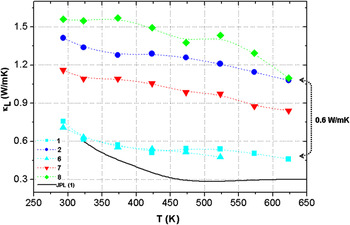
The lattice thermal conductivity (κ L) values were calculated from the measurements of selected specimens as shown in Fig. 6. The samples were chosen in such a manner that each contain significant amount of only one of the previously discussed phases. Thus, specimens 1 and 6 have the β-Zn4Sb3 phase in majority; specimens 2 and 7 contain the Zn-depleted β-Zn4Sb3 subphases; and specimen 8 mainly consist of the “green” Klevtsova phase. For comparison, the κ L value reported in literatureReference Caillat, Fleurial and Borshchevsky1 is also plotted. A wide variation in the κ L values is observed between the different samples with specimens containing majority of β-Zn4Sb3 phase having the lowest κ L values followed by specimens with Zn-depleted β-Zn4Sb3 subphases and finally the “green” Klevtsova phase. Near the maximum studied temperature of 625 K, the difference in κ L values between specimens 1, 6 and specimens 2, 8 is ∼0.6 W/mK, which is ∼130% greater than the absolute value of specimen 1. Thus, the results indicate a strong dependence of κ L values on different Zn4Sb3 phases.
κ L values as a function of temperature in different specimens. Majority phases in samples are as follows: sample 1, β-Zn4Sb3; sample 2, Zn-depleted β-Zn4Sb3 subphases; sample 6, β-Zn4Sb3; sample 7, Zn-depleted β-Zn4Sb3 subphases; and sample 8, Klevtsova phase.

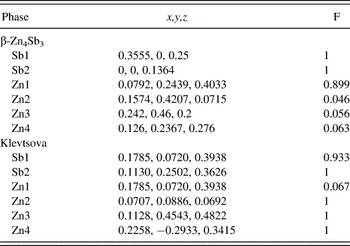
The possible reasons for the low κ L values in Zn4Sb3 have been attributed to structural disorderReference Snyder, Christensen, Nishibori, Caillat and Iversen2 or soft phonon modes associated with Sb dimmers.Reference Schweika, Hermann, Prager, Persson and Keppens14 In Table II, the atomic positional parameters and the atomic site occupancy for the β-Zn4Sb3 and the Klevtsova phase are tabulated from reported literature data.Reference Snyder, Christensen, Nishibori, Caillat and Iversen2, Reference Bokii and Klevtsova13 The β-Zn4Sb3 phase has partly occupied interstitial Zn positions, whereas the Klevtsova phase has dual occupancy of Zn and Sb in one of its sites. Thus, the β-Zn4Sb3 phase is more structurally disordered, leading to possible enhancement of phonon scattering. Similarly, the Zn-depleted β-Zn4Sb3 subphases is expected to be structurally similar to the β-phase but with lesser interstitial Zn atoms. This again decreases the structural disorder of the system, leading to an enhancement of the κ L values. Thus, it seems that the disordered β-Zn4Sb3 phase is essential in achieving the low κ L values and high ZT reported in literature. However, the occurrence of many close-by phases with similar stoichiometries makes it crucial to optimize both the synthesis and the compaction parameters to obtain the desired phase. The other possibilityReference Schweika, Hermann, Prager, Persson and Keppens14 for the variation in κ L values maybe the differences in the phonon dispersion among these different Zn4Sb3 phases and would be studied in future.
List of the atomic positional parameters (x,y,z) and the site occupancies (F) for (a) β-Zn4Sb3 phaseReference Snyder, Christensen, Nishibori, Caillat and Iversen2 and (b) Klevtsova phase.Reference Bokii and Klevtsova13

IV. CONCLUSIONS
Specimens of Zn4Sb3 were prepared by different synthesis and compaction methods. The resulting compacts were then analyzed by PSM, XRD, and EBSD. From the PSM surface scans, regions with S value varying between 40 and 160 μV/K could be observed. Specific ranges of the S values were then identified with different Zn4Sb3 phases and their influence on the κ L values studied. The results indicate a strong variation of the observed κ L values with the specific Zn4Sb3 phases. An increase of ∼130% at 625 K is observed in specimens containing the Klevtsova and Zn-depleted β-Zn4Sb3 subphases compared to the specimens containing predominantly the β-Zn4Sb3 phase. The results, therefore, emphasize the influence of structural disorder in lowering κ L values in this system. Also, the synthesis and compaction parameters result in different possible mixtures of Zn4Sb3 phases and the optimization of these parameters is, therefore, necessary to achieve low κ L and high ZT in this system.
ACKNOWLEDGMENTS
The authors thank Mr. W. Schoenau (DLR) for the measurements of thermal diffusivity and specific heat and Mr. Ph. Watermeyer for the EBSD measurements. This work was supported by the Danish Strategic Research Council (Center for Energy Materials).