I. INTRODUCTION
The synthesis of BaTiO3 nanocrystals has been of increasing interest since the beginning of this century. This stems from their scientific importance and widespread applications in multilayered capacitors, random access memories, thermistors, pressure transducers, etc.Reference O’Brien, Brus and Murray1–Reference Varghese, Whatmore and Holmes14 It is well known that BaTiO3 is a perovskite material and its nanocrystals possess structural and physical properties that strongly depend on their size, shape, crystallinity, and surface chemistry. In contrast to the bulk material, individual BaTiO3 nanocrystals are recognized to be nonferroelectric and possess a stable cubic structure at room temperature, resulting in stable dielectric properties. There is still no clear consensus on the origin of this so-called size effect, although several explanations have been proposed.Reference Akdogan and Safari15,Reference Hoshina, Furuta, Kigoshi, Hata, Horiuchi, Takeda and Tsurumi16 The precise dependence of ferroelectricity on particle size will be clarified by further investigations using size- and shape-controlled nanocrystals. Recently, the displacement of Ti ions in oxygen octahedra of individual BaTiO3 nanocubes down to sub-10 nm dimensions was clarified using aberration-corrected transmission electron microscopy (TEM).Reference Polking, Han, Yourdkhani, Petkov, Kisielowski, Volkov, Zhu, Caruntu, Alivisatos and Ramesh17 Another important aspect is the current trend toward miniaturization in the fabrication of nanoscale devices with improved properties and high reliability.Reference Nakasone, Kobayashi, Suzuki, Mizuno, Chazono and Imai12 It is a key requirement that the BaTiO3 powders be processed into defect-free thin films with appropriate crystal orientation. Small crystallite sizes, high purity, and compositional homogeneity are important prerequisites. In addition, good sinterability, allowing uniform fine particle size, should be realized for advanced devices.
A thin-film fabrication process based on spin coating using BaTiO3 nanocrystals has been reportedReference Huang, Chen, Wilson, Banerjee, Robinson, Herman, Laibowitz and O’Brien8,Reference Nakasone, Kobayashi, Suzuki, Mizuno, Chazono and Imai12 as a target boundary technology between conventional powder-based tape casting and advanced thin-film processes such as chemical solution deposition (CSD), physical vapor deposition, and chemical vapor deposition, which have been extensively investigated for producing capacitors such as dynamic random access memory storage capacitors and integrated decoupling capacitors.Reference Suzuki, Morito and Iwazaki18–Reference Guo, Suzuki, Nishizawa, Miki and Kato20 The high-free surface energy resulting from the extremely fine particle size of BaTiO3 nanocrystals enhances the driving force for sintering, resulting in a marked reduction in the process temperature for densification of the BaTiO3 thin films. Furthermore, the high crystallinity of the BaTiO3 particles, along with small amounts of residual hydroxyl groups and organic compounds, effectively suppressed the formation of pores and intermediate phases of carbonate and oxycarbonate with high-temperature decomposition (700–800 °C), promoting low temperature densification and subsequent grain growth. The solid-phase epitaxy films exhibited extremely reduced dielectric loss.
To realize nanotechnology applications, assembly of nanocrystals to form ordered nanostructures should be attained.Reference Akdogan and Safari15,Reference Talapin21–Reference Colfen and Antonietti23 Nanocrystals with nonspherical and anisotropic shapes, such as cubic, have attracted attention for close-packing to directly form ordered architectures. The development of simple and effective methods to create ordered architectures is of great interest. Free-standing monodisperse BaTiO3 nanocrystals with a well-defined shape, controllable size, and a high degree of compositional homogeneity are essential for opening up new possibilities for assembling individual nanocrystals into functional nanostructures, such as three-dimensional (3D) ferroelectric supracrystals. In this paper, we demonstrate the high potential of BaTiO3 nanocubes and assemblies with ordered structures using a series of our previous resultsReference Dang, Mimura, Kato, Imai, Wada, Haneda and Kuwabara24–Reference Mimura and Kato30 and thereby address the current status of development of advanced future devices.
II. EXPERIMENTAL PROCEDURE
A. Synthesis of BaTiO3 nanocubes
Bis(ammonium lactate) titanium dihydroxide (TALH) (0.05 M, Ba:Ti = 1:1) was added to a 24 mL of Ba(OH)2 aqueous solution, and a 5 M NaOH aqueous solution was then added under mechanical stirring. The initial concentration of NaOH was 1 M. The aqueous solution was transferred into a 50 mL autoclave, and t-butylamine and oleic acid (OLA) (Ba:OLA:butylamine = 1:8:8 in molar ratio) were added. The sealed autoclave was heated at 200 °C for 72 h and then cooled to room temperature. After the synthesis, the precipitate was centrifugally separated and washed twice using ethanol and then dispersed into toluene.Reference Dang, Mimura, Kato, Imai, Wada, Haneda and Kuwabara24
B. Synthesis of SrTiO3 nanocube
Sr(OH)2 and TALH (0.05 M, Sr:Ti = 1:1) were added into 30 mL of distilled water, and then a 5 M NaOH aqueous solution was added under mechanical stirring. The initial concentration of NaOH was 1 M. The aqueous solution was transferred into a 50 mL autoclave, and oleic acid and hydrazine (Sr:OLA:hydrazine = 1:2:4) were added. The sealed autoclave was heated at 200 °C for 48 h and then cooled to room temperature. After the synthesis, the precipitate was centrifugally separated and washed twice using ethanol and then dispersed into toluene.Reference Dang, Mimura, Kato, Imai, Wada, Haneda and Kuwabara25
C. Evaporation-induced self-assembly using capillary force
The as-synthesized BaTiO3 and SrTiO3 nanocubes were washed several times with ethanol and were then ultrasonically dispersed in toluene and centrifuged at 5800 rpm for 5 min. The supernatant solution was mixed with the same volume of n-hexane. This colloidal solution of 0.25 mL was transferred into a cylindrical open glass vial (16 mm inner diameter and 40 mm height). Pt-coated Si substrates were cut into samples with a size of about 10 × 15 mm2 and cleaned using ultraviolet (UV) irradiation for 1 h before use. The substrate was placed in the glass vial at an angle of about 45° and the solution was dried completely for about 6 h at 25 °C. In the case of the BaTiO3–SrTiO3 nanocube mixture assembly, BaTiO3 and SrTiO3 nanocube-dispersed solutions were mixed in the same volume. The as-made orderly assemblies were irradiated by UV light for 2 h, dried at 200 °C for 1.5 h to remove residual organics, and then heated at 400 °C for 1 h and 850 °C for 1 h in continuity under an O2 atmosphere.Reference Mimura, Dang, Kato, Imai, Wada, Haneda and Kuwabara26–Reference Mimura, Kato, Imai, Wada, Haneda and Kuwabara28
D. Evaporation-induced self-assembly using shear and capillary forces
The as-synthesized BaTiO3 nanocubes were washed with several times ethanol and were then ultrasonically dispersed in mesitylene (1,3,5-trimetylbenzene, boiling point: 165 °C) and centrifuged at 5800 rpm for 5 min. The density of the BaTiO3 nanocube-dispersed mesitylene solution was about 6.0 × 10⁻³ g/cm3. Six milliliters of the colloidal solution was transferred into a cylindrical open glass vial (16 mm inner diameter and 40-mm height). Pt-coated Si (Pt/Si), Pt-coated MgO (Pt/MgO), and Pt-coated SiO2 glass (Pt/SiO2) substrates were chosen. These substrates were cleaned by UV irradiation for 1 h before use. The withdrawal rate was set at 0.01 μm/s and the operational temperature was about 25 °C. The as-assembled structures were irradiated by UV light for 2 h and dried at 200 °C for 1.5 h to remove residual organics. The BaTiO3 nanocube assemblies were calcined at 400 °C for 1 h and heated at 850 °C for 1 h in an O2 atmosphere.Reference Mimura and Kato29,Reference Mimura and Kato30
E. Characterization of nanocube and its assemblies
The BaTiO3 and SrTiO3 nanocubes were characterized by x-ray diffractometry (Rigaku RINT 2100V, Japan), scanning electron microscopy (SEM; JEOL JSM-6335FM, Japan), (TEM; JEOL JEM-2010, Japan), dynamic light scattering (DLS; Otsukadenshi FPAR-1000i, Japan), and Fourier transform infrared spectrometry (FTIR; JASCO FT/IR-610, Japan).Reference Dang, Mimura, Kato, Imai, Wada, Haneda and Kuwabara24–Reference Mimura and Kato30
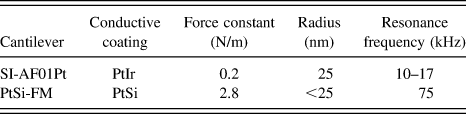
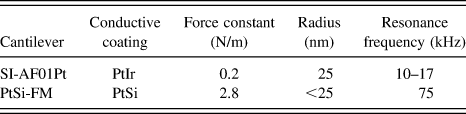
The microstructures of the assemblies were observed by field emission scanning electron microscopy (FE-SEM; JEOL JSM-6335FM, Japan) and high-resolution transmission electron microscopy (HR-TEM; Hitachi H-9000UHR III, Japan). The piezoelectric properties of the BT nanocube assemblies heat treated at 850 °C were characterized using the piezoresponse force microscopy (PFM) mode of a scanning probe microscopy (SII Nanotechnology SPI 3800N and SPA400) system. A conductive cantilever coated with Pt (SII Nanotechnology SI-AF01-Pt and PtSi-FM) was used as the top electrode. The constituent materials and physical properties of the cantilever are summarized in Table I. The piezoelectric properties were measured while applying poling DC biases. The poling DC step voltage was 1.0 V, the maximum poling voltages were 15 and 20 V, the poling and measurement times were 500 ms, and the measurement AC voltage and frequency were 4.0 V and 500 Hz, respectively. The measurement scheme used is shown in Fig. 1. For calibration of the d 33 measurements, a LiTaO3 single crystal and a quartz substrate were utilized as standard materials.
Properties of conductive cantilevers for PFM measurements. (Reproduced from Reference Mimura and KatoRef. 29. Copyright (2013) The Japan Society of Applied Physics).
Measurement scheme of d 33-E curves by PFM. [Reproduced from Reference Mimura and KatoRef. 29. Copyright (2013) The Japan Society of Applied Physics].

III. RESULTS AND DISCUSSION
A. Shape, size, and crystallinity of BaTiO3 and SrTiO3 nanocubes
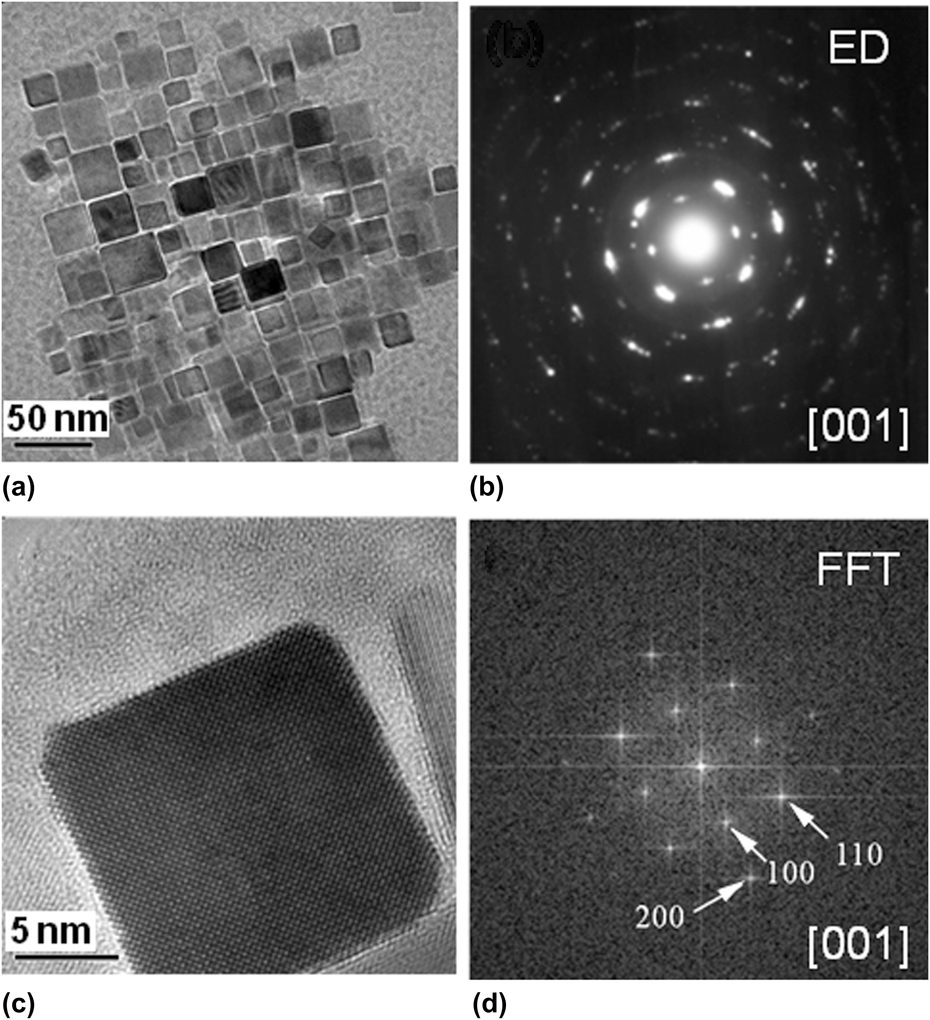
Figure 2 shows TEM, electron diffraction (ED), and fast Fourier transform (FFT) images of the particles synthesized under the fundamental reaction conditions (200 °C, Ba:OLA:butylamine = 1:8:8, NaOH 1 M, 72 h). BaTiO3 nanocubes with a well-defined cubic morphology ranging from 20 to 50 nm in edge length formed an ordered arrangement [Fig. 2(a)]. A spot-like selected area electron diffraction (SAED) pattern (d = 150 nm) along the [001] zone axis was obtained for the ordered aggregates of nanocubes [Fig. 2(b)], which indicated oriented aggregation of nanocubes along the [001] direction. The particle size was in the range from 18 to 50 nm. The DLS method results suggested that the BaTiO3 nanocubes were well dispersed in toluene. The HR-TEM image of a nanocube shown in Fig. 2(c) indicates a high degree of crystallinity. Four (100), (110), and (200) planes as well as two sets of (100), (110), and (200) planes were identified from the FFT profile [Fig. 2(d)] of the HR-TEM image. This means that a perfect cubic shape was projected from the [001] direction. In addition to the nanocubes, nanocrystals ranging in size from 3 to 5 nm were also observed; these were highly crystalline with irregular morphologies. In the FTIR spectrum of the BaTiO3 nanocubes deposited on the Si substrate, bands in the range of 2500–3300 cm−1 associated with the C–H stretching mode of methyl and methylene groups in oleic acid appeared. The bands at 1557 and 1418 cm−1 are attributed to the stretching of the carboxylate group, which indicated that the carboxylate group in oleic acid was chemically bonded to the metal ions on the surface of the BaTiO3 nanocubes.Reference Lu and Miller31,Reference Aronoff, Chen, Lu, Seto, Schwartz and Bernasek32 It was found that only oleic acid was absorbed on the surface of the nanocubes.Reference Dang, Mimura, Kato, Imai, Wada, Haneda and Kuwabara24,Reference Dang, Mimura, Kato, Imai, Wada, Haneda and Kuwabara25
(a) TEM, (b) SAED, (c) HR-TEM, and (d) FFT images of BaTiO3 nanocubes synthesized at 200 °C in 1 M NaOH with a molar ratio of Ba:OLA:butylamine = 1:8:8 for 72 h. (Reproduced from Reference Dang, Mimura, Kato, Imai, Wada, Haneda and KuwabaraRef. 24).
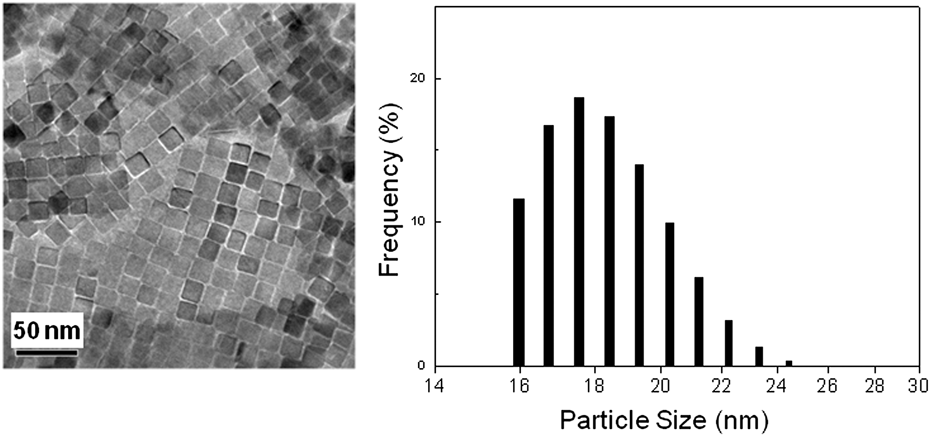
BaTiO3 nanocubes with uniform size and morphology were successfully synthesized by changing the molar ratio of oleic acid to t-butylamine. As shown in Fig. 3, no nanocrystals were identified when the particles were synthesized at 200 °C in 1 M NaOH with the molar ratio of Ba:OLA:butylamine = 1:8:12 for 72 h. The ordered aggregates were composed of perfect nanocubes of approximately 20-nm size with a narrow size distribution. Particle sizes ranging from 16 to 25 nm were confirmed from the DLS results. It is worth noting that the ordered aggregates of nanocubes disappeared with an increase in concentration of t-butylamine. The ordered aggregates of nanocubes were only formed under a high concentration of oleic acid. In our method, the ordered arrangement of BaTiO3 nanocubes was synthesized by using TALH as the Ti precursor with the addition of oleic acid and t-butylamine.
TEM image and DLS results of BaTiO3 nanocubes synthesized at 200 °C in 1 M NaOH with a molar ratio of Ba:OLA:butylamine = 1:8:12 for 72 h. (Reproduced from Reference Dang, Mimura, Kato, Imai, Wada, Haneda and KuwabaraRef. 24).
The formation and morphology of the synthesized BaTiO3 nanoparticles and aggregates can be influenced by the structure of the Ti precursor developed in the synthesis process. It is well understood that the BaTiO3 nanoparticles were formed through a dissolution–precipitation process under hydrothermal conditions in aqueous solution.Reference Testino, Buscaglia, Buscaglia, Viviani, Bottino and Nanni33 The Ti monomer dissolves from the hydrous gel to form a Ti–O–Ti cross-linked network via dehydration, and nucleation of BaTiO3 occurs in solution at a high concentration of NaOH. Because Ti(OH)4 tetrahedra are the dominant Ti species in the aqueous solution, the Ba species must break the Ti–O bond to be incorporated into the Ti–O cluster and then rearrange to form the BaTiO3 structure. So far, to the best of our knowledge, there have been no studies reporting precise control of the morphology and size distribution of BaTiO3 particles in aqueous solution under hydrothermal conditions. Based on observations of the kinetics of formation of nanocubes, the BaTiO3 nanocubes were formed through an in situ growth mechanism from the Ti-based hydrous gel and the ordered aggregates of nanocubes were formed in the growth process of the BaTiO3. The in situ growth mechanism of nanocubes can be attributed to the hydrolysis of TALH and the derived structure.
In the BaTiO3 crystal structure, Ti octahedra are connected via vertex linking and Ba ions occupy the middle position between layers of the Ti octahedra. Tomita et al.Reference Tomita, Petrykin, Kobayashi, Shiro, Yoshimura and Kakihana34 demonstrated that the structure of the Ti precursor could influence the crystal phase of TiO2. The six-coordinated Ti precursor was thought to form a dimer-like structure through vertex linking of Ti octahedra in the hydrolysis. TALH is a simple six-coordinated Ti precursor, and the molecule can be thought of as a Ti octahedron monomer. Mockel et al.Reference Mockel, Giersig and Willig35 demonstrated that the initial hydrolysis process of TALH is slow and incomplete. After the first step of hydrolysis, which involves reduction of the chelating ligand, the partially hydrolyzed species can connect to each other by condensation. Furthermore, the TALH molecules can connect to each other through condensation to release lactic acid and become large-sized species. In the hydrolysis process, the Ti octahedra can easily condense by vertex linking of octahedra, which is similar to that in the BaTiO3 crystal structure. Ba species such as Ba2+ and BaOH+ can easily incorporate into this Ti–O structure to form the BaTiO3 structure directly. The hydrolysis of TALH makes it possible for in situ growth of the BaTiO3 phase.
It is worth noting that the BaTiO3 phase could not be obtained without the addition of t-butylamine. It is suggested that t-butylamine stabilizes the hydroxyl group of the Ti octahedra to suppress the formation of [TiO6] building blocks by edge sharing. Only the addition of t-butylamine allowed for the synthesis of BaTiO3 nanocubes. This is attributed to the strong polarity of t-butylamine. Oleic acid has long hydrophobic C–C chains and hydrophilic –COOH which adsorbs on the interface of the Ti-based hydrous gel in aqueous solution. The adsorption of oleic acid limited the dissolution of the Ti monomer from the hydrous gel. The addition of oleic acid suppressed the growth of BaTiO3 through the dissolution–precipitation process. For morphology control of BaTiO3 nanocubes, stabilization of the (100) face needs to be achieved. In our method, oleic acid was mainly adsorbed on the crystal face with a high density of Ba ions because all six coordinate positions of the Ti ion are always occupied by hydroxyl groups. Since the density of Ba ions on the (100) face is higher than on other crystal faces, the (100) face is stabilized by the adsorption of oleic acid and consequently {100} dominant nanocubes are formed.
The crystal structure of SrTiO3 is similar to that of BaTiO3, and hence the aforementioned mechanism of nanocube formation using TLAH is considered to be reasonable and acceptable for SrTiO3. As shown in Fig. 4, regular SrTiO3 nanocubes with a narrow size distribution were obtained. The particle size, as determined from the TEM images, is about 20 nm. The HR-TEM images of the nanocubes showed good crystallinity and a sharp edge. It is worth noting that the SrTiO3 particles prepared with Sr:OLA:hydrazine = 1:2:4 for 48 h could be well dispersed into a nonpolar solvent and self-assembled into an ordered structure on the silicon substrate. DLS of the dispersion of the nanocubes showed a narrow size distribution, and the sizes of the nanocubes were concentrated in the range from 21 to 25 nm.
HR-TEM image and DLS results of SrTiO3 nanocubes synthesized at 200 °C in 1 M NaOH with a molar ratio of Sr:OLA:hydrazine = 1:2:4 for 48 h. (Reproduced from Reference Dang, Mimura, Kato, Imai, Wada, Haneda and KuwabaraRef. 25).
B. Structure, scale, and symmetry of self-assembled BaTiO3 nanocubes
1. Evaporation-induced self-assemblies using capillary force
Figures 5(a) and 5(b) show SEM images of self-assembled structures of BaTiO3 nanocube single crystals on a Pt-coated Si substrate before heat treatment. The orderly multilayered structures of nanocubes were fabricated on the substrate and the ordered domain area was very large at several tens of square micrometers. It was found that the BaTiO3 nanocubes were assembled tightly and were attached face-to-face within this area. The relative density of this assembled structure was determined to be about 90% by scaling the appropriate region in Fig. 5(b) and by counting the nanocubes involved, which hypothetically have a correct size of 19 nm.Reference Mimura, Dang, Kato, Imai, Wada, Haneda and Kuwabara26–Reference Mimura, Kato, Imai, Wada, Haneda and Kuwabara28
FE-SEM images of BaTiO3 nanocube assemblies on a Pt-coated Si substrate. (a) and (b) surface images of as-fabricated assemblies, (c) surface image of the assemblies after heat treatment at 850 °C, and (d) cross-sectional image of (c). (Reproduced from Reference Mimura, Kato, Imai, Wada, Haneda and KuwabaraRef. 27).
Figure 5(c) shows the BaTiO3 nanocube-assembled structure after heat treatment at 850 °C. The surface morphology of the assembled BaTiO3 nanocubes after heat treatment was almost the same as the as-formed structure and the ordering was maintained, i.e., the nanocube single crystals as building blocks were clearly confirmed to be face-to-face with respect to each other without abnormal grain growth. It should be noted that some missing nanocube building blocks partially appeared at the surface after heating. If the lacks had been homogeneously distributed in the bulk, the density of this sample should be about 98%. In Fig. 5(d), which is a cross-sectional image of the region shown in Fig. 5(c), the internal of the BaTiO3 nanocube-assembled structure was found to be dense and ordered. The appearance of a sharp straight edge running from the surface to the bottom indicated that the nanocubes were aligned along this direction. The thickness of this assembly showed a gradient due to the capillary force assisted self-assembly method.Reference Mimura, Dang, Kato, Imai, Wada, Haneda and Kuwabara26 In the case of the BaTiO3 nanocube-assembled structure, the thickness changed from 300 nm at the central region of the substrate to 1.2 μm at the bottom region of the substrate. The reason for the BaTiO3 nanocubes being highly ordered over a relatively wide area is that the size distribution of the BaTiO3 nanocubes is very narrow, which corresponds to an almost monodispersed state in toluene.Reference Dang, Mimura, Kato, Imai, Wada, Haneda and Kuwabara24 The narrow size distribution of the nanocubes was one of the most important factors for the fabrication of the ordered structure. It is also worth noting that the precise ordering of face-to-face attachment of the single crystal nanocubes with narrow size distribution suppressed mass transfer and grain growth during the heat treatment. Therefore, the microstructure remained after the heat treatment at a relatively high temperature.
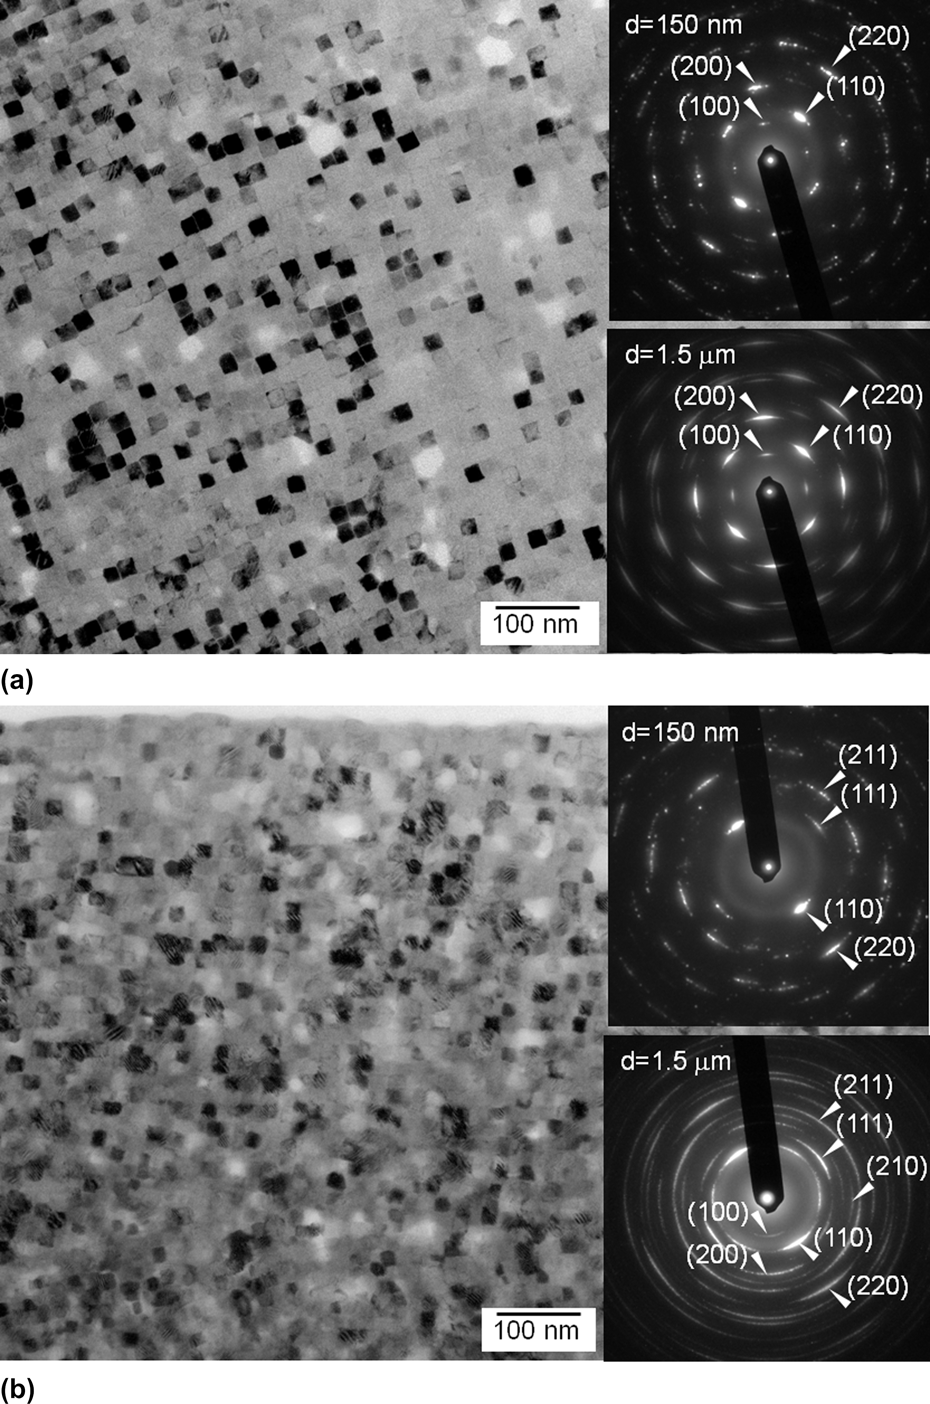
Figures 6(a) and 6(b) show HR-TEM images and SAED patterns of the BaTiO3 nanocube assembly on the Pt-coated Si substrate heat treated at 850 °C. The plan-view image [Fig. 6(a)] shows that the nanocubes are highly ordered in a large area. The contrast in the TEM image is associated with a slight rotation of each of the nanocubes, which leads to slight differences in orientation with respect to the electron beam. Both SAED patterns of two regions of the BaTiO3 nanocube assembly had a spot-like appearance and were quasi-four-fold symmetric. This indicates that the BaTiO3 nanocubes were highly oriented to form a superlattice. The cross-sectional image [Fig. 6(b)] also showed that the nanocubes were ordered. The SAED pattern of the small area (d = 150 nm) was spot-like and showed a high intensity of (110) and (220) planes, and that of the large area (d = 1.5 μm) was a multiple ring structure which indicated the polycrystalline nature of the specimen.
HR-TEM images and SAED patterns of (a) in-plane and (b) cross-section of BaTiO3 nanocube assemblies after heat treatment at 850 °C.
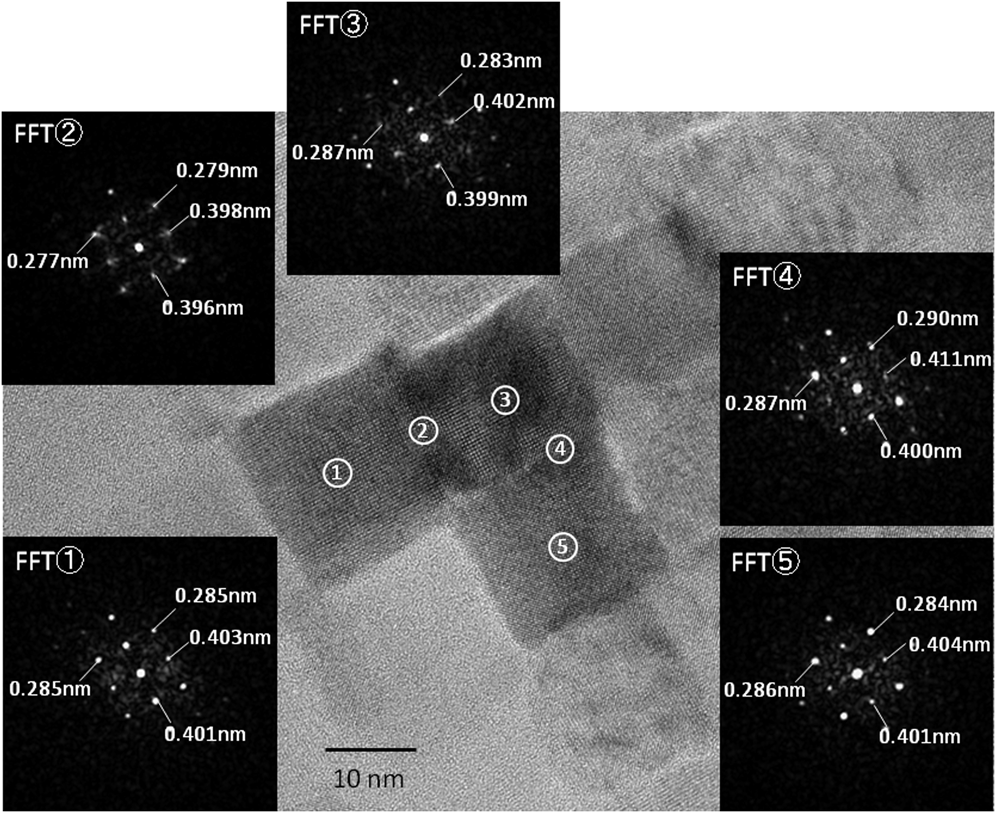
Figure 7 shows a magnified image of Fig. 6(a) and FFT patterns of points 1–5 indexed in this image. The nanocubes were tightly attached face-to-face without grain growth or subphases and were confirmed to be single crystals since the FFT patterns corresponded to the ED pattern of BaTiO3 [001]. The lattice spacing at the interface region (points 2 and 4) was slightly different to that at the inner region (points 1, 3, and 5) of the adjacent nanocubes, whereas those of points 1, 3, and 5 were almost the same. This suggests that the lattice was slightly stressed at the interface due to neighboring nanocubes. Consequently, lattice strain was induced at the interface due to rotation with a very small angle and misalignment.
Plan view HR-TEM image and FFT patterns of BaTiO3 nanocube assemblies at 850 °C.
2. Evaporation-induced self-assembly using shear force and capillary force
The mechanism of this self-assembly is basically similar to that of the preliminary capillary force-assisted self-assembly method. However, a major difference is the convection in the vicinity of the surface of the substrate. Due to the convection, the nanocubes were moved into the liquid film at the surface of the substrate. The lateral capillary force then worked between the nanocubes to connect them to each other when the evaporation of the solvent from the liquid film occurred. In the preliminary method, convection is basically induced by the evaporation of the solvent. When withdrawing the substrate from the nanocube-dispersed solution, shear stress was applied at the surface of the substrate. This accelerates convection in the vicinity of the substrate and results in pushing the supply of nanocubes toward the formation of assemblies. A schematic image of the assembly mechanism is illustrated in Fig. 8. To fabricate a large area ordered assembly, it is necessary for the assembly rate of nanocubes on the substrate, defined as “formation rate” of the assembly, to be equivalent to the withdrawal rate of the dip coating process.Reference Dimitrov and Nagayama36,Reference Watanabe, Inukai, Mizuta and Miyahara37 The evaporation rate of the solvent should be sufficiently low because the formation rate of the assembly is usually very low. In our method, mesitylene was chosen as the solvent, which has a high boiling point of 165 °C. Thereby, the withdrawal rate could be set as low as 0.01 μm/s and could be made equivalent to the formation rate. As a result, the nanocubes were assembled with a high degree of ordering over a long range.Reference Mimura and Kato29,Reference Mimura and Kato30
Schematic diagram of evaporation-induced self-assembly method using shear force and capillary force. [Reproduced from Reference Mimura and KatoRefs. 29 and Reference Mimura and Kato30. Copyright (2013) The Japan Society of Applied Physics].
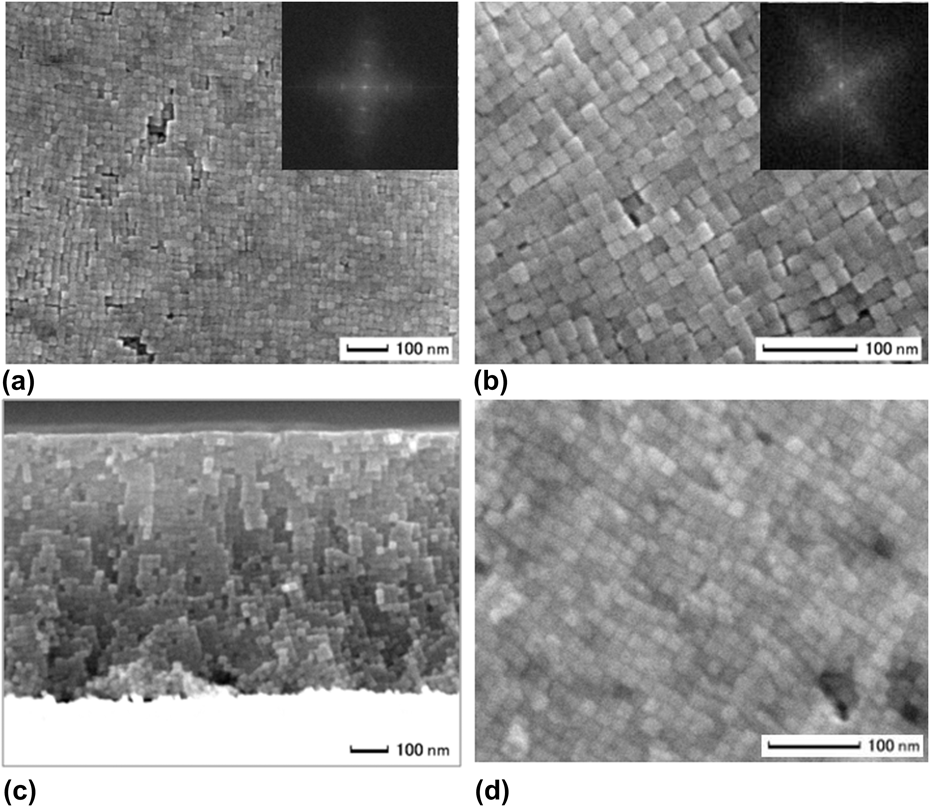
Stacked structures of BaTiO3 nanocube assemblies with a high degree of ordering were obtained on various substrates, such as Pt/Si, Pt/MgO, and Pt/SiO2. Figure 9 shows typical FE-SEM images of as-assembled films on the Pt/MgO substrate. The assembly area was about several tens of square micrometers. It was found that BaTiO3 nanocubes were tightly assembled and attached face-to-face on a variety of substrates. The characteristic microstructures correspond to those of the BaTiO3 nanocube assembly fabricated by the preliminary capillary force-assisted self-assembly method.Reference Mimura, Dang, Kato, Imai, Wada, Haneda and Kuwabara26 FFT images of these assemblies are inset in Figs. 9(a) and 9(b). Four-fold symmetric patterns were confirmed in all FFT images. This confirmed that highly ordered assemblies of nanocubes were obtained on a variety of substrates. A cross-sectional image of a BaTiO3 nanocube-assembled film on a Pt/MgO substrate is shown in Fig. 9(c). The internal portion of the assembled film is quite dense and has a highly ordered structure. The thickness of the assembly is about 600 nm. The size of the typical ordered region in the nanocube assemblies is about 20 μm2.
FE-SEM images of BaTiO3 nanocube assemblies on the Pt-coated MgO substrate. (a) and (b) surface images of as-fabricated assemblies with FFT patterns, (c) cross-sectional image of the assemblies, and (d) surface image of the assemblies after heat treatment at 850 °C. (Reproduced from Reference Mimura and KatoRef. 30).
Figure 9(d) shows microstructures of a BaTiO3 nanocube-assembled film on a Pt/MgO substrate after heat treatment at 850 °C. The highly ordered structure and shape of the BaTiO3 nanocube constituents were maintained after heat treatment. The microstructural characteristics of the assemblies are similar on the three types of substrates used. Several pores with cube-like shapes appeared at the surface of the assemblies. These pores are missing nanocubes owing to shrinkage of the films through the heating process. The microstructural development of the nanocube assemblies after heat treatment was identical to that fabricated by the preliminary capillary force-assisted self-assembly method.Reference Mimura, Dang, Kato, Imai, Wada, Haneda and Kuwabara26
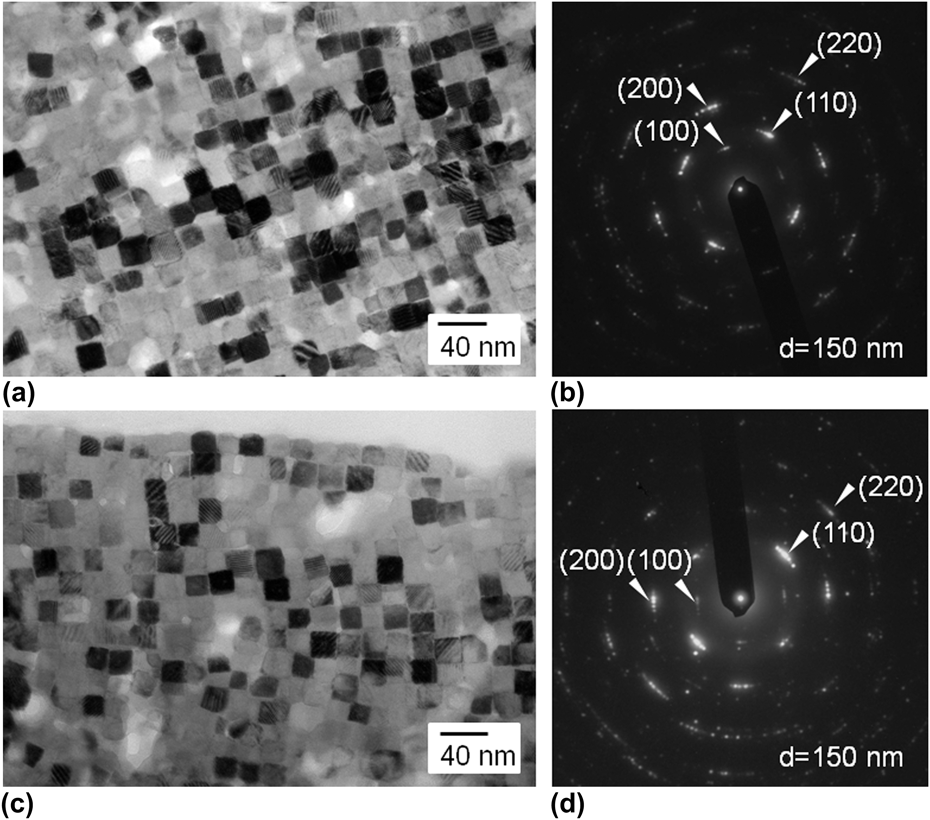
Surface and cross-sectional HR-TEM images of a BaTiO3 nanocube assembly fabricated on a Pt/MgO substrate after heat treatment at 850 °C are shown in Fig. 10. The local structures of the surface and the internal portion were determined to be highly ordered and dense. Both ED patterns of the surface and cross-sectional regions showed perfect 4-fold symmetry and indicated that the assembly had {100} orientation.Reference Mimura and Kato29,Reference Mimura and Kato30 It was again confirmed that a highly ordered structure of nanocubes was maintained during relatively high temperature heat treatment owing to the nanocube packing in a face-to-face manner. The difference in the contrast of each nanocube is due to slight misorientations between them. The stripe-like patterns in some nanocubes may be associated with incoherence in the lattice, which stems from strain generated at the interface and seems to affect the ferroelectric properties. Otherwise, the connection of each nanocube was confirmed in the high-resolution images. Thus, the assembly of BaTiO3 nanocubes after heat treatment at 850 °C yielded a unique structure being a quasisingle crystal or “supracrystal.”
HR-TEM images and SAED patterns of (a), (b) in-plane and (c), (d) cross-section of BaTiO3 nanocube assemblies after heat treatment at 850°C. [Reproduced from Refs. Reference Mimura and Kato29 and Reference Mimura and Kato30. Copyright (2013) The Japan Society of Applied Physics].
There have been significant developments in BaTiO3 thin films thus far. Heteroepitaxial growth of BaTiO3 thin films using molecular beam epitaxy was reported by Sun et al.Reference Sun, Tian, Pan, Haeni and Schlom38 The epitaxial growth requires precise matching between the lattice constants of the BaTiO3 film and the substrate. However, since the materials are different, a small mismatch was inevitable, which led to the formation of misfit dislocations at the interface extending into the epitaxial film. Schwartz et al.Reference Schwartz, Clem, Voigt, Byhoff, Stry, Headley and Missert39 and Hofmann and WaserReference Hoffmann and Waser40 reported the growth of BaTiO3 thin films with a strong c-axis texture using sol–gel and CSD methods, respectively. Textured films were also produced when a lattice-matching perovskite buffer layer such as LaNiO3 or LaAlO3 was inserted between the BaTiO3 film and the substrate. The textured films generally had a uniaxial orientation, large columnar grains, and a rather rough surface. In contrast, the nanocube-ordered films obtained by our method are distinguishable from the above heteroepitaxial or textured films. Any kind of substrate, including Pt, Si, and SiO2, can be used with our proposed technique. The unique mechanism by which individual nanocubes are epitaxially connected during heat treatment without grain growth leads to the formation of a quasisingle-crystal film that is unaffected by the crystallographic properties of the substrate. Another important consideration is the effect of lattice distortion, which is known to enhance the dielectric properties of films. It was reported that heteroepitaxially grown BaTiO3/SrTiO3 superlattice films exhibited high dielectric constants due to the ordered distortion induced by the lattice mismatch.Reference Harigai, Nam, Kakemoto, Wada, Saito and Tsurumi41 However, in the films produced by our method, the nanocubes are in epitaxial contact with each other at six different interfaces, which gives rise to a 3D distorted architecture with both in-plane and out-of-plane components. Control of the interfaces between the nanocubes is thus likely to lead to unique properties that can be applied not only to devices using dielectric effects but to a wide range of next-generation electronic devices.
Based on the SEM, TEM, and SAED results, it was found that the BaTiO3 assemblies possessed simple cubic (sc) symmetry on flat surfaces of various substrates. Otherwise, the symmetry and its transformation from sc to face centered cubic (fcc) or body centered tetragonal (bct) have been discussed in terms of the precise shape of a cube, the truncation degrees, and the related surface properties of iron oxideReference Disch, Wetterskog, Hermann, Alvarez, Busch, Bruckel, Bergstrom and Kamali42 and platinum nanocubes.Reference Demortiere, Launois, Goubet, Albouy and Petit43,Reference Chan, Demortiere, Vukovic, Kral and Petit44 The highly ordered bct mesocrystals with large correlation lengths in three dimensions, such as over several micrometers in the lateral dimensions and about 300 nm in height, were produced by self-assembly of truncated iron oxide nanocubes.Reference Disch, Wetterskog, Hermann, Alvarez, Busch, Bruckel, Bergstrom and Kamali42 Energy modeling, which rests on the detailed structural information obtained primarily from grazing incidence small-angle x-ray scattering together with the well-defined size and degree of truncation of the nanocubes, supported the observations of a bct structure for the nanocubes with a truncation degree of 0.45. The simple model also suggested the formation of a range of structures, such as sc and bct, when the truncation degree was varied. At moderate truncation, the bct configuration dominated over the sc. At lower truncations with a degree of less than 0.4, the sc structure dominated, thereby predicting a transition from an sc to a bct structure as the degree of truncation increased.Reference Demortiere, Launois, Goubet, Albouy and Petit43 The structural transformation was driven by the rapidly growing van der Waals attraction along the bct diagonal as the degree of truncation increased. The short distance between the truncated corners may be a result of the face-specific adsorption of oleic acid as a surfactant suggesting surface coverage on the {111} faces that is significantly less than one monolayer. The short distance and small c lattice constant may stem from shrinkage of the assemblies perpendicular to the substrates due to residual solvent loss upon final drying. With regard to magnetic dipolar interactions, it was found that in the case of the sc lattice, the multibody dipolar interactions canceled out each other due to the symmetry of the array, whereas in the case of the bct lattice, the resulting energy was much smaller than the corresponding van der Waals energies. The estimates of the multibody interaction energies suggested that in the arrays, the additive van der Waals interactions dominated over the magnetic interactions. In contrast, the sc and fcc superlattices of octylamine-coated regular and truncated Pt nanocubes, respectively, were prepared and microscopic and atomistic modeling were used to explain the observed remarkably different structures.Reference Chan, Demortiere, Vukovic, Kral and Petit44 The fcc packing can be stabilized by Coulombic coupling between multipolar electrostatic fields of charged truncated nanocubes, which originated from charge transfer between their ligands and platinum cores. This coupling created a local energy minimum when the truncated nanocubes had adjacent or shifted corners, which can retain the fcc packing in solvent and vacuum against global stabilization of the sc structure. Compared with the diverse symmetry of superlattices consisting of truncated functional nanocubes, the BaTiO3 nanocubes seemed to have perfect or nearly regular cubic shape and thereby can construct supracrystals with sc symmetry.
C. Piezoresponse properties of BaTiO3 and BaTiO3–SrTiO3 mixture assemblies
The d 33-E loops of a BaTiO3 nanocube assembly after heating at 850 °C on the Pt-coated Si substrate were characterized using two types of cantilever with different force constants. The thickness of the assemblies was 600 nm. Figures 11(a) and 11(b) show the d 33-E curves measured using the cantilevers with force constants of 0.2 and 2.8 N/m, respectively. Both of them showed ferroelectric hysteresis behavior. However, in the case of using the lower force constant cantilever, the curve was not sufficiently saturated as shown in Fig. 11(a). This indicated that the electrostatic interaction between the cantilever tip and the surface of the assembly affected the measurements. This interaction has been reported to be proportional to the electrical field and works strongly for a cantilever with a low force constant or a “soft cantilever.”45 However, the d 33-E curve measured using the higher force constant had a saturated rectangular shape as shown in Fig. 11(b). It seems to show an accurate d 33-PFM value of the BaTiO3 nanocube assemblies since the electrostatic interaction was suppressed upon using the appropriate cantilever with the higher force constant. BaTiO3 nanocube assemblies fabricated on Pt/MgO and Pt/SiO2 substrates with thicknesses of 600 and 400 nm, respectively, had saturated rectangular-shaped ferroelectric hysteresis loops as shown in Fig. 12. The saturation value of d 33-PFM was in the range of 10–20 pm/V on various substrates. This value is relatively low compared with that of epitaxial or textured BaTiO3 thin films, which contained significant strain under stress induced by the substrates. The low value is considered to be due to the fact that the present BaTiO3 nanocube assemblies are free from the effects of the substrate. Otherwise, as shown in the HR-TEM images in Fig. 10, the nanocubes were slightly rotated and misaligned with each other. These small misfit interfaces in the assembly may affect the piezoelectric properties. The most distinctive feature of the BaTiO3 nanocube assemblies that differed from that of the BaTiO3 single crystal is that the former have many interfaces between the ordered nanocubes. If the interfaces can be completely controlled by tuning the composition and arrangement of nanocubes, the resistivity of the assemblies will be enhanced and the piezoelectric properties can be improved by entirely applying a voltage. An investigation of the relation between the interface and properties is now in progress. Additionally, the d 33-E curves were shifted to the negative bias of the poling field. The imprint behaviors are considered to stem from the asymmetry of the top and bottom electrodes. By using the cantilever with a high force constant, the interface between the top of the cantilever tip and the surface of the nanocube assembly was improved to have good electrical contact. Thus, the effects of asymmetry of the electrode work functions on the d 33-PFM-E relation are distinct for the cantilever with a high force constant.
d 33-E curves for BaTiO3 assemblies on Pt-coated Si substrates after heat treatment at 850 °C measured using (a) a low force constant cantilever and (b) a high force constant cantilever. [Reproduced from Reference Mimura and KatoRefs. 29 and Reference Mimura and Kato30. Copyright (2013) The Japan Society of Applied Physics].
d 33-E curves for BaTiO3 assemblies on (a) Pt-coated MgO and (b) Pt-coated SiO2 substrates after heat treatment at 850 °C measured using a high force constant cantilever. [Reproduced from Reference Mimura and KatoRefs. 29 and Reference Mimura and Kato30. Copyright (2013) The Japan Society of Applied Physics].
In contrast, the d 33-E curve of the BaTiO3–SrTiO3 mixture nanocubes was nonlinear but did not show hysteresis or stepwise behavior at higher electric fields. Moreover, it should be noted that these d 33-E relationships corresponded to the results on a dielectric nanocube monolayer or bilayer structure.Reference Mimura, Dang, Kato, Imai, Wada, Haneda and Kuwabara26,Reference Mimura, Kato, Imai, Wada, Haneda and Kuwabara28 Although the configurations of the BaTiO3 and SrTiO3 nanocubes were random, a large BaTiO3/SrTiO3 heterointerface lattice strain along the out-of-plane direction existed in assemblies with thicknesses of about 250 nm. The results indicate that the interfacial lattice strain along the out-of-plane direction in the nanocubes assembly may affect the field-induced displacement behavior, which is definitely distinguishable from that of two-dimensional superlattice artificial films.Reference Schwartz, Clem, Voigt, Byhoff, Stry, Headley and Missert39
IV. CONCLUSION
An ordered arrangement of BaTiO3 nanocubes was synthesized in aqueous solution with the addition of oleic acid and t-butylamine under hydrothermal conditions. It was found that BaTiO3 nanocubes formed through an in situ growth mechanism. BaTiO3 nuclei formed in the Ti-based hydrous gel and transformed into a cubic morphology. Through growth of BaTiO3 and loss of Ti-based hydrous gel, random aggregates of nanocubes changed into a close-packed superlattice because of the hydrophobic surface in an aqueous solution. BaTiO3 nanocubes with uniform morphology and size could be synthesized by controlling the molar ratio of oleic acid to t-butylamine. The addition of oleic acid was important for the morphology, size control, and the formation of ordered aggregates of BaTiO3 nanocubes. In contrast, t-butylamine accelerated the formation of the BaTiO3 phase and improved the size distribution of the nanocubes.
Highly ordered BaTiO3 nanocube-assembled films were fabricated by the evaporation-induced self-assembly method using shear force and capillary force on various substrates. The orderly assembled area was enlarged by withdrawing the substrates from the colloidal solution, compared with the preliminary capillary force-assisted self-assembly. BaTiO3 nanocubes were assembled face-to-face, and the internal structure of the nanocube assemblies was dense on a variety of substrates. Also, the thickness of the assembly film could be controlled by changing the density of the BaTiO3 nanocube-dispersed solution. The constituents of assemblies after heating at 850 °C maintained the high degree of ordering and cube shapes without grain growth. The piezoresponse behavior of the BaTiO3 nanocube assembly exhibited a ferroelectric hysteresis loop with a high rectangular appearance by measurements using a high force constant cantilever. The values of d 33-PFM of these assemblies were in the range of 10–20 pm/V. These values are considered to be accurate piezoelectric properties of the BaTiO3 nanocube assembly after heating at 850 °C owing to the suppression of the electrostatic interaction between the cantilever tip and the surface of the assembly.
The evaporation-induced self-assembly method using shear force and capillary force has great potential to fabricate BaTiO3 nanocube assemblies on a variety of substrates with high crystallographic orientation and is expected to be used for future dielectric device applications. Macrocracks induced by shrinkage during the evaporation of solvents should be suppressed for practical device applications. The optimization of substrate materials and surface functions would solve the serious problem of cracks to form crack-free assemblies. The BaTiO3 nanocube assembly should be characterized to have a lot of interfaces between ordered nanocubes in three dimensions. The interfaces of the BaTiO3 nanocubes can be controlled and designed to obtain better dielectric properties. The series of studies and systematic analysis in previous papers on nanocrystals and assemblies pave the way to a new type of crystallography and methodology of thin films leading to a novel device technology, wherein the structure and functionality of assemblies are basically determined by the shape of the constituent nanocrystals. Improving our current understanding of the shape-induced structural diversity of nanocrystalline assemblies is of importance in fields ranging from biomineralization to the production of novel functional materials.
ACKNOWLEDGMENTS
This work was supported by the Collaborative Research Consortium of Nanocrystal Ceramics and the Advanced Low Carbon Technology Research and Development Program (ALCA) of Japan Science and Technology Agency (JST).