


INTRODUCTION
Independent candidates are generally thought to be unimportant for political representation. They have no formal affiliation with the established political parties that are the primary vehicles for representation in most democracies (Sartori Reference Sartori1968), and are rarely elected to represent the constituencies they contest (Ehin et al. Reference Ehin, Madise, Solvak, Raagepera, Vassil and Vinkel2013, Chap. 4). The conclusion that they are unimportant for representation is problematic, however. The logic behind it focuses narrowly on the fact that elections are typically won by party rather than by independent candidates, and ignores the process by which electoral outcomes are generated. If independents appeal to some segment of the electorate, they can affect who turns out to vote, for whom voters vote, and who among the other candidates is elected to represent the constituency. In this article, we argue that from the perspective of who gets elected, independent candidates are important for representation.
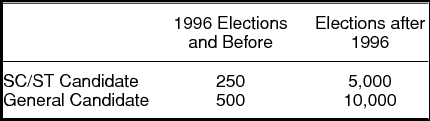
To make this argument, we estimate the causal effect of independent candidates on voter turnout and election outcomes in India. India is a useful context for several reasons. Like many other major democracies, India requires a money deposit for participation as a candidate in elections.Footnote 1 At the same time, India practices affirmative action in the amount candidates pay. The first deposits were set in 1947 at 500 rupees for General candidates and 250 rupees for Scheduled Caste or Tribe (SC/ST) candidates,Footnote 2 and were left unchanged for 50 years. By 1996, the deposits had eroded to almost nothing in real terms, and from a pecuniary standpoint, candidate entry was effectively free. Substantial increases in the number of candidates eventually led the Election Commission of India to increase the deposits sharply and differentially,Footnote 3 to 10,000 rupees for General candidates, and 5,000 rupees for SC/ST candidates. The deposit increases had a disproportionate effect on participation by independents, as the number of independents decreased more in constituencies where the deposit increased to 10,000 rupees, relative to constituencies where the deposit increased to 5,000 rupees. This exogenous variation in participation by independents provides a powerful first stage for an instrumental variables-based identification strategy.
India is a parliamentary democracy with single-member districts, where the national government is formed by the party, or coalition of parties, with the most elected representatives. Voters vote for local representatives, and if the representative is a member of the governing coalition, then the constituency is represented more directly in government. Coupling our instrumental variables strategy with this feature lets us estimate the effect of independents on constituency representation in government.
We show that a standard deviation increase in the number of independents increases voter turnout by more than 6 percentage points, increases the total vote share for independents by more than 10 percentage points, and reduces the vote share of the winner by about 5 percentage points. Independents thus induce some voters to vote rather than stay home, some to switch whom they vote for, and allow the winning candidate to win with support from a smaller segment of the electorate, ultimately suggesting that independents could affect the outcome of the election. We show independents, in fact, decrease the probability of electing a governing-coalition representative by 31 percentage points. This finding implies that the price of participation by independents is constituency representation in government.Footnote 4
We identify the parties who benefit from a loss by a governing-coalition candidate. India is an ethnolinguistically diverse democracy, and this diversity is reflected by the politics of the parties that contest elections. As Indian democracy has matured, several ethnic and regional parties have emerged across the country. We show that independents increase the probability of an ethnic party winning the constituency by 15 percentage points. Consistent with winners being able to win with less vote share, ethnic parties, though more likely to win, see no change in their collective share of the vote. Finally, we show the probability of major national parties winning decreases almost one for one with the increase in the probability of ethnic parties winning, suggesting that the prospects for ethnic parties improve at the expense of national parties in particular.
RELATED LITERATURE
The study of entry barriers for political candidates has a long theoretical lineage (Tullock Reference Tullock1965).Footnote 5 Scholarship has developed around the premise that candidates enter when their chances of winning exceed the costs of entering (Cox Reference Cox1997). These entry costs ultimately govern the nature and extent of political competition.Footnote 6 Empirical research has followed this line of thought, focusing largely on the effects of ballot access restrictions, such as filing fees and petition requirements, on various metrics of political competition (Ansolabehere and Gerber Reference Ansolabehere and Gerber1996).Footnote 7
Entry costs are also central to the analysis in this article, but for a different reason. Our interest is not in how entry costs influence political competition per se, but rather in exploiting the nature of their influence to formulate an instrumental variable for the participation of candidates who are affected by changes in entry costs. In this regard, our contribution lies in showing how the ensuing changes in candidate participation can be used to identify the causal effect of affected candidates on various electoral outcomes.Footnote 8
Scholarship on independent or nonparty candidates has gained momentum only recently, arising out of perceived trends in antiparty sentiment (Owen and Dennis Reference Owen and Dennis1996), as well as increasing trends in the number of independents within and across countries (Ehin et al. Reference Ehin, Madise, Solvak, Raagepera, Vassil and Vinkel2013; Bolleyer and Weeks Reference Bolleyer and Weeks2009). Empirical research has examined factors that explain the participation and performance of independents, focusing on the nature of the electoral system (Weeks Reference Weeks2016; Ehin et al. Reference Ehin, Madise, Solvak, Raagepera, Vassil and Vinkel2013; Brancati Reference Brancati2008, for example). To the best of our knowledge, our article provides the first estimates of the causal effect of independents on voter turnout and election outcomes, and is consequently the first to show that the representation effects of these seemingly insignificant candidates can be substantial.
Scholars have provided several theoretical justifications for why independents might affect representation when elected,Footnote 9 but have not explored theoretical justifications for why independents might affect representation when they are not elected. One theory, which formed the basis of the Law Commission of India (2015) recommendation to ban independents, argues that independents lead to greater vote fragmentation because they increase the number of candidates substantially and because candidate proliferation confuses voters.
Our evidence implies that independents increase fragmentation and generate significant “waste” (Anckar Reference Anckar1997; Tavits and Annus Reference Tavits and Annus2006). Many voters turn out for or switch to a candidate who has no legitimate chance to win, suggesting independents either encourage turnout by nonstrategic voters or provide existing nonstrategic voters (who already turn out) with a preferable option.Footnote 10 Our other results reinforce this point, as independents decrease the collective vote share of the top two candidates.Footnote 11 The wasted votes in turn facilitate the election of a representative who obtains a lower share of the votes. This may draw the legitimacy of elected representatives into question, especially if legitimacy is determined by voter turnout and the vote share of the winning candidate—the winner’s mandate.
A wealth of research has documented the advantages of governing-party representatives in a wide range of contexts. Khemani (Reference Khemani2007) uses data on state finances to provide evidence of greater transfers from the federal government of India to states whose ruling party is the same as that of the federal government. Asher and Novosad (Reference Asher and Novosad2017) showed recently that Indian state-level constituencies perform better economically when the seat is held by a member of the state governing party. An array of evidence from other contexts supports this finding: Rogowski (Reference Rogowski2016), among several others, provides a fascinating example from the US; Brollo and Nannicini (Reference Brollo and Nannicini2012) provide an example from Brazil; Burgess et al. (Reference Burgess, Jedwab, Miguel, Morjaria and Miguel2015) provide one from Kenya. In light of this evidence, our finding that independents reduce the probability of electing a governing-coalition representative suggests that participation by independent candidates comes at a potentially significant price.
CONTEXT AND DATA
Parliamentary System
Our focus is on elections to the Lok Sabha, the lower house of the national parliament, which controls the federal budget. Lok Sabha members are elected from local constituencies via a single-member, simple-plurality system. Members hold their seats for five years, unless parliament is dissolved in the interim period. During elections, 543 seats are contested: 412 open seats, which can be held by anyone; 84 seats reserved for SC persons; 47 seats reserved for ST persons. The number of reserved seats in a state is proportional to the SC/ST population in the state. The reservation of a particular seat depends on the state rank of the SC/ST population in the parliamentary constituency.Footnote 12 Seat reservation is one of the two pillars upon which our identification strategy is based.Footnote 13
The Election Commission of India classifies candidates as either National, State, Unrecognised, or Independent. National classification requires a sufficiently strong presence in several states. State classification requires a sufficiently strong presence in at least one state. Unrecognised parties are parties that are registered with the Commission but have lost or never met the National or State classification requirements. Independent candidates have no party affiliation.Footnote 14 Our operational definition of independent candidates includes candidates who are officially designated as Independents and candidates who belong to unrecognised parties with only one candidate running.Footnote 15
Independents do not benefit from the economic and political resources of parties, or from brands that parties have developed over several elections. They are often inexperienced outsiders who run because of an interest in a single issue.Footnote 16 Some use their candidacy to promote a business or private interest. Others were former members of a major party, having been forced out due to some internal conflict or disillusionment with the party’s direction. Former major-party members can be expected to take votes from the party they left.Footnote 17
Reform on Entry Deposits
The Election Commission has several rules to prevent entry by “frivolous” candidates. Citizens are eligible to run if they are over 25 and if they have not been sentenced to prison for two or more years. They must be nominated, via signatures, by members of the constituency where they wish to run. Finally, citizens must pay an entry deposit to participate as a candidate. The deposit is refunded if the candidate wins the election or obtains at least one-sixth of the vote.Footnote 18 The deposit amounts to a nonrefundable fee for candidates who have little chance at winning. It is especially significant for the liquidity or borrowing constrained.
The deposit schedule is found in Table 1. Note that the amount of the deposit for SC/ST candidates has always been half that of the deposit for General candidates.Footnote 19 Also note that gdp per capita in 1996 was between 12,000 and 13,000 Indian rupees.Footnote 20 Candidates went from effectively paying nothing in real terms by 1996 to paying a significant fraction of the annual income of a typical citizen starting in 1998. The deposit increases and, in particular, the increased difference provides the second pillar (in addition to seat reservation) of our identification strategy.Footnote 21
Entry Deposits

Nominal values of the deposit (rupees), depending on the whether the candidate is SC/ST, and whether they participated before or after the reform. Deposits are refunded if the candidate obtains at least one-sixth of the vote. Nominal Indian per capita GDP in 1996 was between 12,000 and 13,000 rupees. 10,000 Indian rupees in 1996 was roughly 281 U.S. dollars in 1996.
It is worth reiterating that the deposit increases had nothing to do with historical differences in voter and candidate participation across reserved and open constituencies. The Election Commission sought to eliminate “frivolous candidates” for two primary reasons (Bhattacharya Reference Bhattacharya2014). First, parties would occasionally try to confuse voters by floating fake (independent) candidates with names that were similar to the names of rival candidates. As Bhattacharya (Reference Bhattacharya2014) notes, the success of the deposit increase in eliminating this practice was limited, because parties are relatively wealthy and able to continue the practice after the reform. Second, there were episodes of misbehavior in a handful of State Assembly constituencies leading up to the reform, with hundreds of candidates contesting a single seat. These elections were expensive for the Commission to administer, as the book of candidate information must be printed and made available to any citizen who requests it. While the Commission had been considering responses to candidate proliferation across the country for several years (Bhattacharya and Mitra Reference Bhattacharya and Mitra2014), one specific event precipitated the Commission’s decision. In the 1996 Tamil Nadu State Assembly elections, a single seat was contested by 1,033 candidates. Quoting the Hindu Times of March 21, 2016Footnote 22 “What was the [C]ommission’s response to this one-off Assembly constituency issue and other anomalies, such as the 480 contestants in the Nalgonda Lok Sabha constituency in 1996, among others? It resolved to increase the security deposit amount [. . .].”
The entry-deposit reform was part of a broader package of reforms that took place between 1996 and 1998. The other relevant reforms were (1) a change to the number of petition signatures required to run as a candidate, (2) introduction of a cap on the number of constituencies from which a citizen could contest, (3) introduction of instructions on ballot orderings, and (4) polling day became a paid holiday. Unlike the change in deposit requirements, these other reforms did not involve a differential rule change across open and reserved constituencies. Moreover, our specification allows for differential trends that may have emanated from other reforms that took place at the same time, via, for example, interactions between time trends and turnout in the base period of our sample. Lastly, the first two reforms only affect outcomes indirectly—if they have any effect at all—through the set of entering candidates, and so do not affect our main identification argument. Nonetheless, later we will elaborate on the concerns each reform raises and, where applicable, how we deal with these concerns.
Descriptive Statistics
Our goal is to understand the causal chain linking entry costs, the participation of independents, and electoral outcomes. Our strategy relies on comparisons of participation across open and reserved constituencies, before and after entry deposits were raised significantly. The strategy is built on elections data from the Election Commission of India, covering all elections that took place between 1977 and 2004.Footnote 23 The raw elections data includes information on the number of eligible electors (the electorate) in a constituency, the percentage of eligible electors who voted (voter turnout), as well as the identities of the various candidates and the votes they obtained. Our unit of analysis is defined by the constituency and election year. Our primary sample has more than 4,800 observations from 543 constituencies and nine elections.
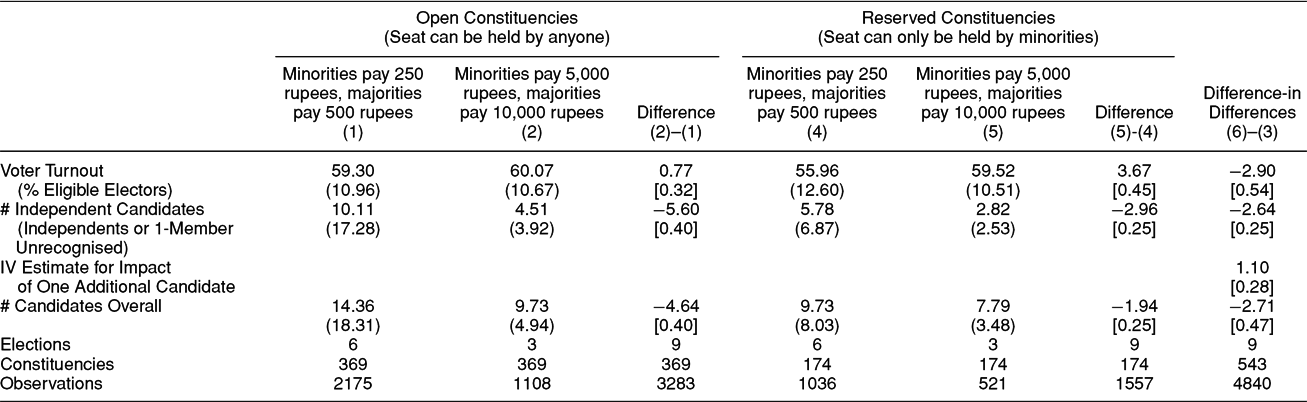
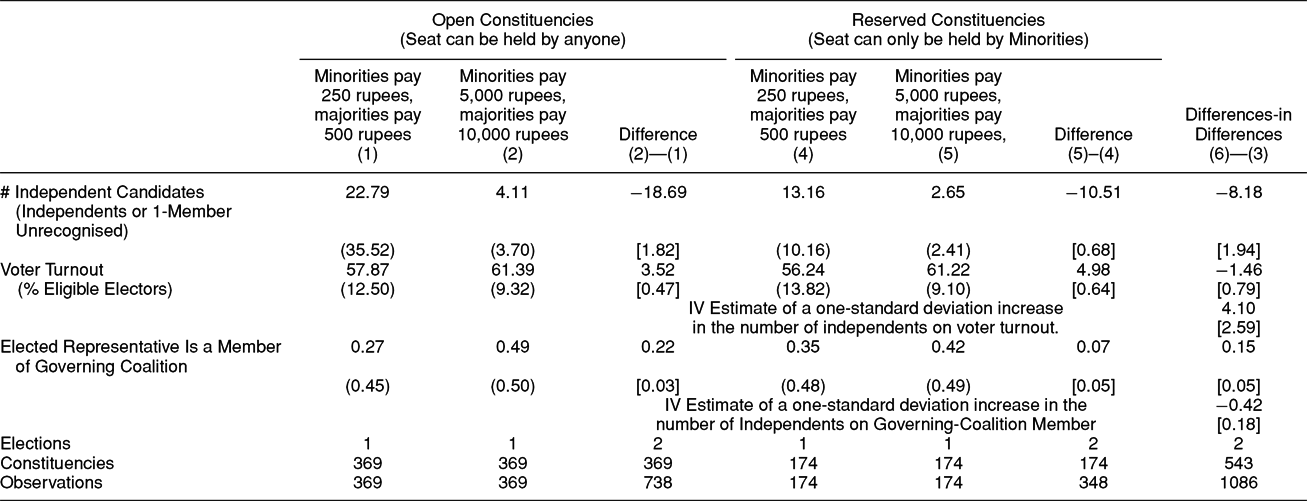
Table 2 reports summary statistics for voter turnout, independent candidates, and the number of candidates overall. Columns 1 and 2 present means in open constituencies. Column 3 compares them. Columns 4–6 do the same but for reserved constituencies. Column 7 compares the mean difference in Column 6 with the mean difference in Column 3. It provides unconditional difference-in-differences estimates of the effects of higher deposits. Between Rows 2 and 3 is the ratio of the coefficient estimates from Rows 1 and 2, that is the implied IV estimate of the effect of independents on turnout.
Descriptives for National Elections (1977-2004)

Voter turnout is the fraction of eligible voters who cast a vote. Independent candidates include candidates who are defined as Independents by the Election Commission or who are from Unrecognised parties with one candidate running. Standard deviations for means are in round parentheses. Standard errors (in square parentheses) for mean comparisons are clustered at the level of the constituency.
The raw data suggests the reform led to a nationwide decline in independent candidates. Open constituencies see 5.60 fewer independent candidates (Column 3). Reserved constituencies see 2.96 fewer (Column 6). The differences-in-differences estimate in Column 7 shows a relative decline in open constituencies of 2.64 candidates. The decline lines up with how the new entry deposits differ across open and reserved constituencies, and implies that we have a powerful instrument for the number of independent candidates. The bottom row does the same exercise, but for candidates in general. It shows that most of the reduction in the total number of candidates stems from the reduction in the number of independent candidates.
The top row shows open constituencies also experience a relative decline in voter turnout. Open constituencies have 0.77 percentage points more turnout after the reform. Reserved constituencies have 3.67 percentage points more. The differences-in-differences estimate shows a relative decline of 2.90 percentage points in open constituencies. Coupling this reduced form estimate with the first stage estimate for independent candidates (Row 2) delivers an IV estimate of 1.10. One additional independent candidate implies an additional 1.10 percentage points in turnout.
ENTRY BARRIERS AND INDEPENDENT CANDIDATES
The first stage of our instrumental variables strategy assumes
 $$\begin{eqnarray*}
(\#\,\,Independents)_{je} &=& \pi _{j} + \pi Open_{j}Post_{e}\nonumber\\
&& + \pi _e + X_{je}\Pi + u_{je},
\end{eqnarray*}$$
where e ∈ {1977, 1980, 1984, 1989, 1991, 1996, 1998, 1999, 2004} denotes the election and j the constituency. πj, πe are constituency and election year fixed effects. Open j is a binary indicator that takes the value 1 if constituency j was open during our sample period, and the indicator Post e takes the value 1 if election e occurred after the 1996 reforms.
X je is a set of variables whose trends may be similar to those of the deposit and our outcome variables:
• Independents in 1977 (Trends): Interactions of base-period independent candidates with a fourth-order polynomial in a time trend. This is particularly important because 1977 was the first election after India’s notorious emergency period. This period may have set constituencies that were affected differently on different trends in political participation.
• Turnout in 1977 (Trends): Interactions of base-period turnout with a fourth-order polynomial in a time trend.
• Eligible Electors (in Logs): The natural logarithm of the number of eligible electors. This controls for the possibility that large and small electorates differ systematically in their turnout propensity.
• Distance Between Winner and Runner-Up in Last Election: A dummy that indicates whether there was less than a 5 percentage point difference between the vote shares of the winner and runner-up in the previous election as well as a fourth-order polynomial in the actual difference between these vote shares. Constituencies with close elections in the recent past are likely to have higher turnout.
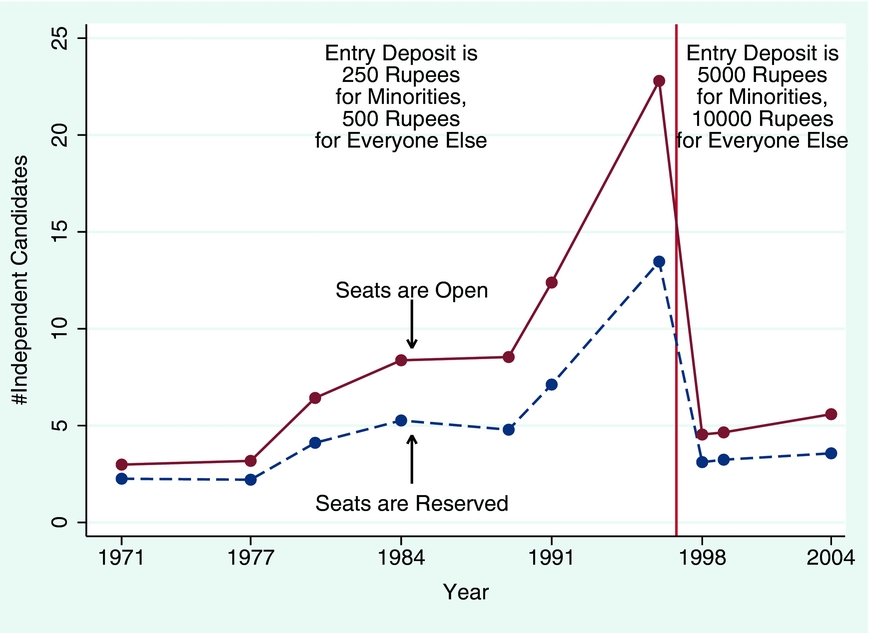
Figure 1 depicts the differential evolution of the total number of independent candidates across open and reserved constituencies.Footnote 24 Open constituencies saw an immediate reduction of about 20 independent candidates per constituency following the reform. Reserved constituencies saw an immediate reduction of about ten independent candidates. As described in our discussion of the context, the reform was not a response to pre-1996 differences in the evolution of independents across open and reserved constituencies.
Entry Deposits and Independent Candidates

Note that the lack of a common pre-trend in the number of independent candidates (across open and reserved constituencies) is not necessary for our identification argument. While a differential pre-trend in the number of independents affects our ability to interpret the first stage causally, a causal first stage is not a requirement for identification using an instrumental variables strategy.Footnote 25 That said, if our controls are sufficient to warrant a causal interpretation of the first stage, then the first stage by itself should be of interest to a political science literature that explores drivers of participation by independents (Ishiyama, Batta, and Sortor Reference Ishiyama, Batta and Sortor2013; Brancati Reference Brancati2008; Moser Reference Moser1999; Drometer and Rincke Reference Drometer and Rincke2009; Stratmann Reference Stratmann2005).
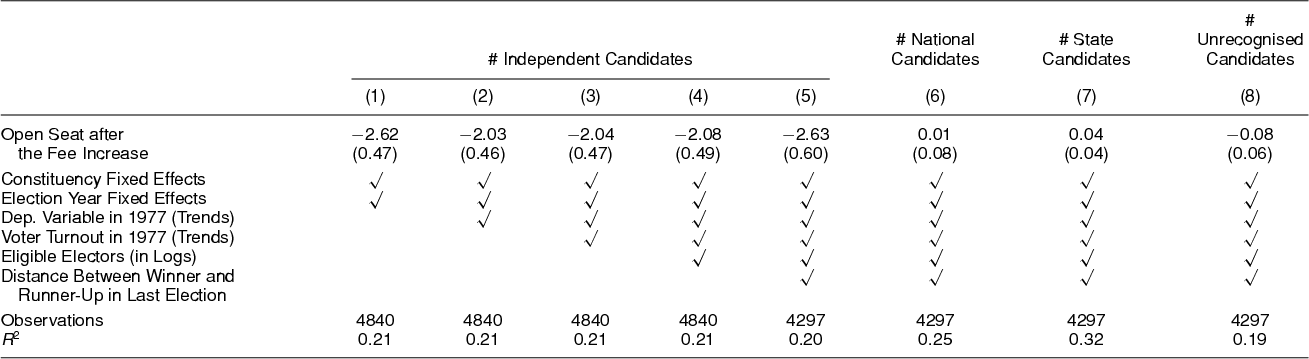
First-stage estimates are found in the first five columns of Table 3. The estimated effect on independents is qualitatively robust to flexible controls for differential trends in voter and candidate participation, population, and the contestability of seats, and highly statistically significant across specifications. The estimates imply that there were 2.0–2.6 fewer independent candidates in open relative to reserved constituencies.
Entry Deposits Exclude Independents Disproportionately

First-stage estimates of the number of candidates (for each candidate type) on the interaction of indicators for whether the constituency was open and whether the election took place after 1996. Controls are defined in the main text. Standard errors (in parentheses) are clustered at the level of constituency.
The last three columns of Table 3 replicate the first stage for candidates who belong to a political party. The deposit had no economically or statistically significant effect on their candidacy, which is unsurprising because party candidates can use party resources to cover the deposit. This suggests that the effects of independents on the different electoral outcomes we consider below cannot be attributed to the deposit’s influence on party candidates.
Our strategy does not require knowledge of the caste status of individual candidates. It relies on the fact that in reserved constituencies only SC/ST individuals may hold office, and that in open constituencies the proportion of SC/ST individuals is small relative to the proportion of General candidates.Footnote 26 All candidates in reserved constituencies pay the lower deposit, as all are SC/ST candidates. However, the probability that a candidate pays the lower deposit in open constituencies is much smaller. To formally verify this, we use data on SC/ST status of individual candidates from 2004.Footnote 27 For the 120 reserved constituencies in the 2004 data, 99.9 percent (with a standard deviation of 0.01) of all candidates are either SC or ST.Footnote 28 In the remaining 423 constituencies, only 17.4 percent are from these historically disadvantaged groups. We also checked the percentages for constituencies that were reserved at least once in our 1977–2004 sample. In this sample of 173 ever-reserved constituencies, the proportion of SC/ST candidates is 76.2 percent, with a standard deviation of 38. The proportion in an always open constituency is 16.6 percent, with standard deviation of 16.6. Either way, the probability of treatment (paying the higher deposit) is much larger in open constituencies.Footnote 29
INDEPENDENTS AND VOTER TURNOUT
We assume voter turnout is generated by
 $$\begin{eqnarray*}
(Voter\,\,Turnout)_{je} &=& \alpha _{j} + \beta (\#\,\,Independents)_{je} + \delta _e\\
&& +\, X_{je}\Gamma + \varepsilon _{je}.
\end{eqnarray*}$$
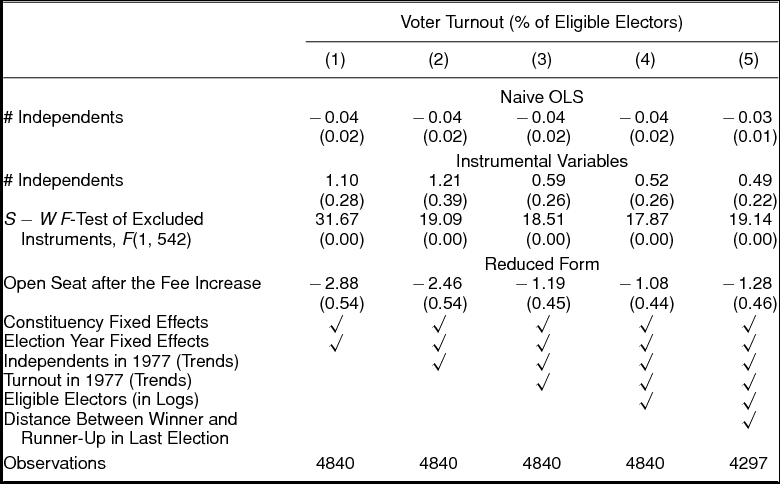
(Voter Turnout)je is the percentage of eligible electors who vote, measured on a scale of zero to 100. αj encapsulates constituency-level permanent and unobserved differences in turnout, such as the historic propensity to participate in the political process. δe encapsulates election-specific shocks to turnout that are common across constituencies. β > 0 if an increase in independent candidates causes higher voter turnout. If voter decisions are unaffected by the presence of independent candidates, then we would expect β = 0.Footnote 30 The instrumental variable estimates of β can be interpreted causally if the exclusion restriction Cov(Open jPost e, εje) = 0 is satisfied. This says that after controlling for a host of unobserved trends and controls, there should not be unobserved and systematic differences in turnout that track the differential evolution of the entry deposit in open and reserved constituencies.
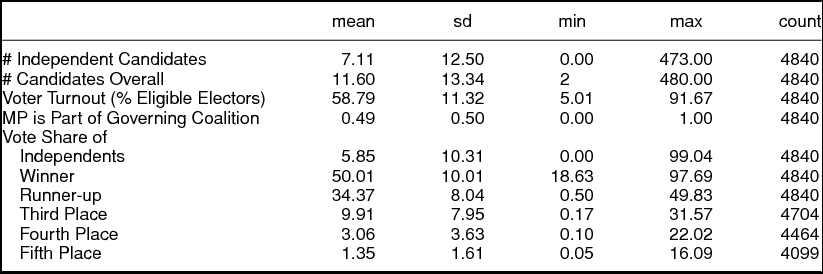
Estimates are found in Table 4. The table has three panels. The top panel presents OLS estimates. The middle panel presents instrumental variables estimates of the effect of the number of independent candidates, together with the F-statistic for a test of the relevance of the excluded instrument. The bottom panel presents the reduced form. Note that while our tables report IV estimates of the effect of one additional independent candidate, we will focus our discussion on the implied effect of a one standard deviation increase (12.50) in the number of independent candidates. The standard deviation can be found, together with summary statistics for the full sample, in Appendix Table A1.Footnote 31
Independents and Voter Turnout

The point estimates in the first two rows describe the effect of the number of independent candidates. The table reports Sanderson-Windmeijer F-Statistic and p-value for excluded instruments, that is, for no differential effect (across open and reserved constituencies) on # Independents. Standard errors (in parentheses) are clustered at the level of constituency.
Column 1 implies that a standard-deviation increase in independent candidates causes turnout to increase by 13.75 percentage points. The remaining IV estimates show flexible controls for differential trends dampen the estimated effect. Allowing for differential trends across constituencies as a function of turnout in the initial period reduces the magnitude by about 50%. This suggests that constituencies with high turnout historically tend to have positively correlated trends in independent candidates and voter turnout. As we add trends in other constituency-level variables, the estimate stabilizes around 6 percentage points (Columns 4-5). All the estimates are statistically significant at conventional significance levels.
The OLS estimates are smaller in magnitude and have the opposite sign from the IV estimates, implying a confound that co-varies across constituencies over time positively (negatively) with independent candidates and negatively (positively) with turnout. While it is difficult to pin down a specific story that rationalizes this pattern, one possibility is that constituencies that exhibit dissatisfaction with the major political parties tend to have lower turnout and more independents.Footnote 32
Leads and Lags
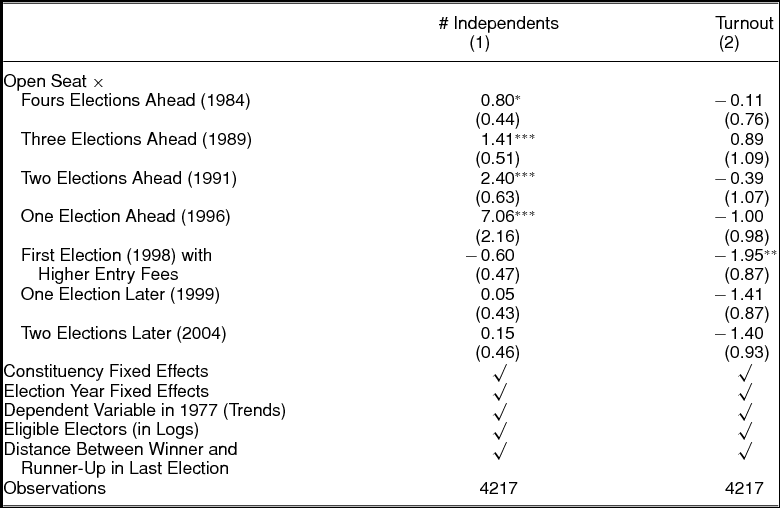
We evaluate the assumption that our controls encapsulate unobserved differences in how turnout evolves across open and reserved constituencies, lending a causal interpretation to our estimates. We estimate the leads and lags specification:
 $$\begin{eqnarray*}
y_{je} &=& \pi _{j} + \sum _{k=-4}^{2} \pi _k Open_{j}Post_{e+k} + \pi _e + X_{je}\Pi + u_{je},
\end{eqnarray*}$$
where y je is either the number of independent candidates or voter turnout. In denoting elections, k < 0 identifies the elections leading up to the reform, k = 0 indicates the first election after the reform, and k > 0 denotes the elections thereafter. Estimates are found in Table 5. The excluded category for the leads and lags is the 1980 election.Footnote 33 The coefficients thus measure the change in the dependent variable relative to its 1980 value.
Pre-Trends for Open and Reserved Constituencies

The excluded category for the leads and lags is the 1980 election. Standard errors (in parentheses) are clustered at the level of the constituency. ***, **, and * denote statistical significance at 1-, 5-, and 10-percent levels.
From 1980 to 1984, the number of independent candidates increased by 0.80 in open relative to reserved constituencies. The increase from 1980 to 1989 was 1.41 candidates. From 1980 to 1991 it was 2.40 candidates. By 1996, the increase was 7.06 more than the increase in reserved constituencies. The increase was the same for open and reserved constituencies in the three elections following the reform. The estimates are consistent with Figure 1.
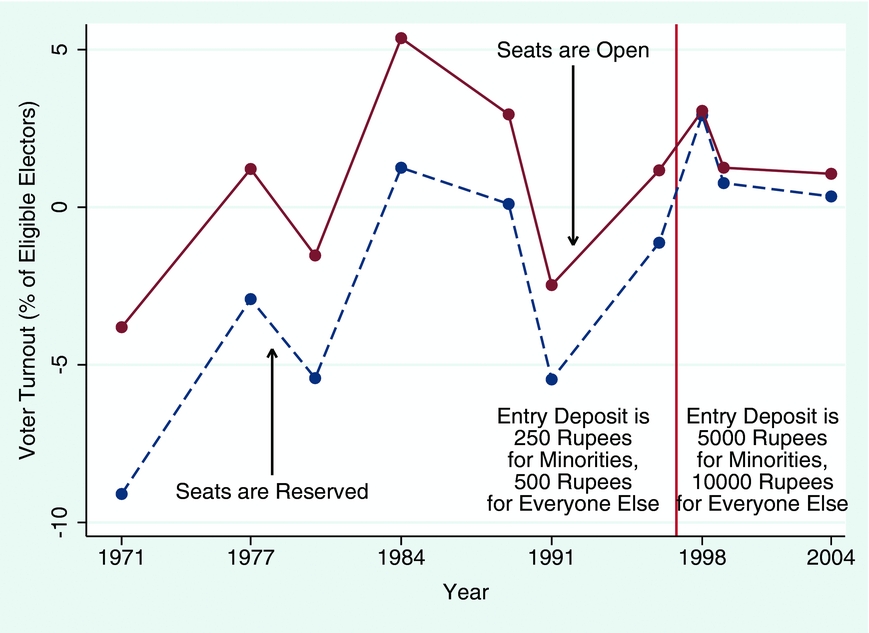
Turnout was statistically the same for open and reserved constituencies before the reform. With the new entry deposits, open constituencies experienced an immediate and significant 1.95 percentage point drop in voter turnout. Figure 2 affirms the turnout results in Table 5. It shows voter turnout follows a statistically similar trend in open and reserved constituencies leading up to the reform. It also shows that voter turnout drops substantially in open versus reserved constituencies after the reform.Footnote 34 The coefficients becomes less negative as we move to the 1999 and 2004 elections. While the negative coefficients for 1999 and 2004 are consistent with the reform deterring entry disproportionately in later elections, they may also reflect other changes that were taking place at the same time, such as differential changes in real income. Because of this, Online Appendix Table OA6 replicates our main results while excluding data from elections that took place after 1998.Footnote 35
Entry Deposits and Voter Turnout

Discussion
A large body of scholarship has estimated the relationship between voter turnout and the number of candidates or the number of a particular type of candidate. The number of candidates is thought to increase turnout because it presents voters with more choice, which increases their utility from turning out.Footnote 36 It is thought to decrease turnout because it increases the likelihood of a coalition government, weakening the link between the favored policy of citizens and the policy choice of the eventual government. The literature has yielded inconsistent evidence, a relatively even distribution of positive, negative, and statistically insignificant estimates (Cancela and Geys Reference Cancela and Geys2016).
This inconsistency likely owes to the fact that estimates in the literature have not been obtained using exogenous variation in candidates, and thus partly reflect the effects of unobserved correlates of both the number of candidates and turnout. For example, if citizens are dissatisfied with the expected state of the economy, then they may participate more or less depending on whether their dissatisfaction leads them to mobilize or withdraw from the political process (Schlozman and Verba Reference Schlozman and Verba1979; Rosenstone Reference Rosenstone1982). This biases estimates upward if dissatisfaction affects voter and candidate participation in the same way (for example, decreases both) and biases estimates downward if dissatisfaction affects voter and candidate participation in opposite ways.Footnote 37 Our focus on independents and exogenous variation in their participation helps eliminate these sorts of biases.
Our estimates are informative for research that focuses specifically on turnout in India. Existing scholarship has uncovered provocative empirical patterns: India has relatively high turnout despite having relatively low levels of income and education (Kumar and Banerjee Reference Kumar and Banerjee2017); the poor turn out to vote at least as much as the middle and upper classes (Kumar Reference Kumar2009); voters in rural areas now turn out more than voters in urban areas (Banerjee Reference Banerjee2015). By contrast, we show that turnout depends heavily on the participation of independent candidates. Our finding complements that of Ujhelyi, Chatterjee, and Szabó (Reference Ujhelyi, Chatterjee and Szabó2017), who use the introduction of the “None of the Above” (NOTA) option to also show that the presence of more options on the ballot generates higher turnout.
INDEPENDENTS AND REPRESENTATION
Vote Shares
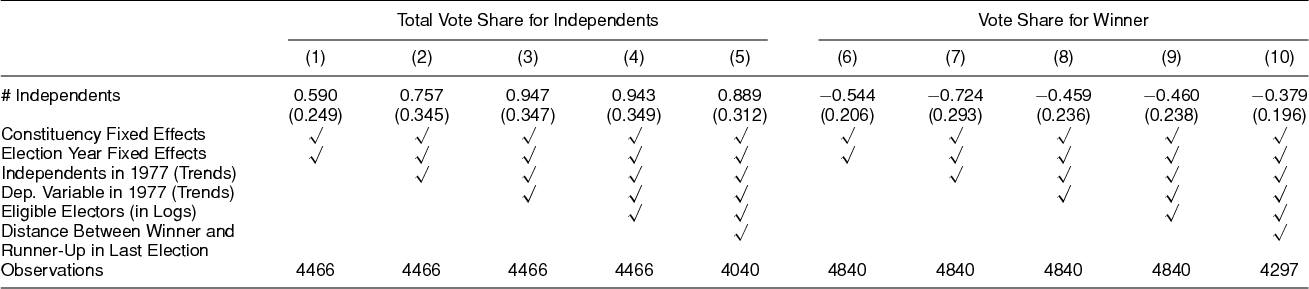
The first five columns of Table 6 report estimates of the effect of the number of independent candidates on their collective vote share. Our most flexible specifications show that the vote share of independents increases by about 11 percentage points with a standard deviation increase in independent candidates. As turnout only increases by about 6 percentage points, it must be the case that some voters switch to vote for independents.Footnote 38
Independents and the Distribution of Vote Shares

Instrumental variable estimates of the effect of the number of independent candidates. The scale for vote share is 0 to 100. Standard errors (in parentheses) are clustered at the level of constituency.
The remaining columns of Table 6 report estimates of the effect of independents on the vote share of the winning candidate. A standard deviation increase in independent candidates decreases the vote share of the winner by a statistically significant 4.7–9 percentage points. This finding is in line with what has been shown in several theoretical papers (Cox Reference Cox1987; Myerson Reference Myerson1993; Lizzeri and Persico Reference Lizzeri and Persico2009) that growth in the number of candidates enables winners to win with less vote share, implying that candidates have an incentive to target narrower segments of the electorate. To the extent that independents help generate this incentive, they improve the chances of electing a less mainstream candidate.
Governing Coalition
We estimate
 $$\begin{eqnarray*}
&&(Member\,\, of\,\, Governing\,\, Coalition)_{je}\nonumber\\
&&\quad= \alpha _{j} + \beta (\#\,\, Independents)_{je} + \delta _e + X_{je}\Gamma + \varepsilon _{je},
\end{eqnarray*}$$
where the dependent variable takes the value 1 if the candidate who wins constituency j in election e belongs to the party or pre-election alliance that eventually forms the government.Footnote 39 Our IV strategy deals with the concern that the incentives for candidate entry are stronger in constituencies where the prospects for the expected governing coalition are poor, or in other words, that the relationship instead runs from (Member of Governing Coalition)je to # Independents)je. Our strategy deals with this reverse-causality concern because the differential changes to entry deposits are exogenous to changes in support for the expected governing coalition.
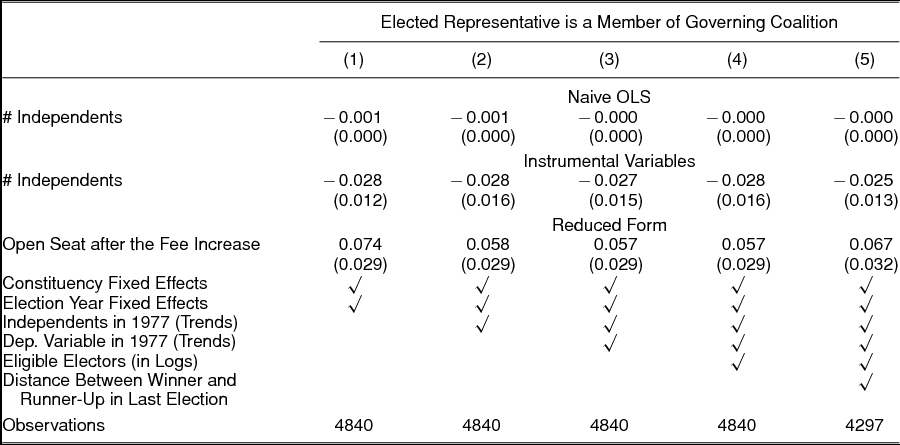
Estimates are reported in Table 7. A standard deviation increase in the number of independents reduces the probability of governing-coalition representation by roughly 31 percentage points. The IV estimates are fairly stable across the different specifications. The naive OLS estimates, by contrast, are substantively and statistically negligible after controlling for unobserved differential trends across constituencies. The IV estimates are, to the best of our knowledge, the first causal estimates of the effect of independent candidates on constituency representation in government.
Independents and Representation in Government

Instrumental variable estimates of the effect of the number of independent candidates (with no party affiliation) on the likelihood that the winner of the constituency is a member of the governing coalition. Standard errors (in parentheses) are clustered at the level of constituency.
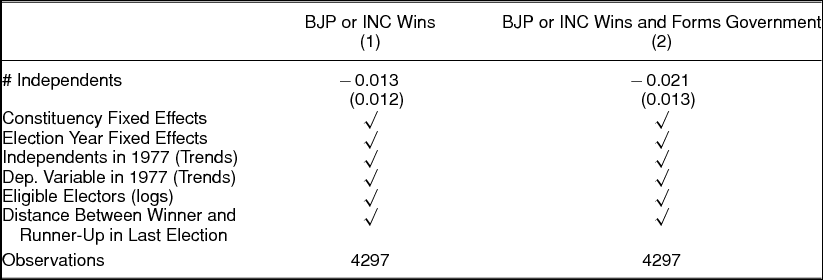
Our interpretation of the IV estimates is that independents affect constituency representation directly by decreasing the chances of electing a governing-coalition representative. An alternative interpretation is independents affect constituency representation indirectly, by decreasing the chances of electing a representative who belongs to the inc or bjp, the two dominant parties in Indian politics since independence. Appendix Table A4 uses two outcomes to investigate this possibility: an indicator for whether the bjp or inc wins the constituency; an indicator for whether the bjp or inc wins and is the party that forms government. The table shows a statistically significant effect for the latter (p < 0.10) but not the former,Footnote 40 suggesting that the effect of independents on the chances of electing a governing-coalition representative is more than an indirect effect on the chances of a dominant party winning the constituency.
Ethnic Parties
Who benefits from a loss by the governing-coalition candidate? As Indian democracy matured between independence and the early 1990s, a wide range of narrowly focused ethnic parties emerged to give voice to India’s vast array of constituent parts. These parties would never win a majority (or even plurality) of seats in a national election, and usually target specific ethnolinguistic interests in one or two states. As noted in our discussion of the parliamentary system, independents tend to represent interests other than those of a specific ethnolinguistic group, likely increasing competition among nonethnic candidates, and improving the chances of electing an ethnic-party candidate. In this subsection, we investigate whether ethnic parties are the primary beneficiaries of entry by independents.
We rely on Thachil and Teitelbaum (Reference Thachil and Teitelbaum2015) and Chandra (Reference Chandra2004) to identify ethnic parties. Thachil and Teitelbaum (Reference Thachil and Teitelbaum2015) isolate major state parties who either held office or formed the opposition in state legislature, and among these, define “ethnic parties on the basis of their appeals to the particular interests of one ethnic category to the exclusion of others.” We cross-check their list against Chandra (Reference Chandra2004) because she, like us, focuses on the 1996 and 1998 general elections.Footnote 41 We add communist and marxist parties to the Thachil and Teitelbaum (Reference Thachil and Teitelbaum2015) list because, while these parties generally target voters via economic issues, they employed an ethnic targeting strategy between 1996 and 1998, attempting to provide the best “head count” option for voters in specific castes (Chandra Reference Chandra2004). A full list of ethnic parties, and the states they are most associated with, is found in the caption to Table 8.
Independents and Election Prospects of Ethnic Parties

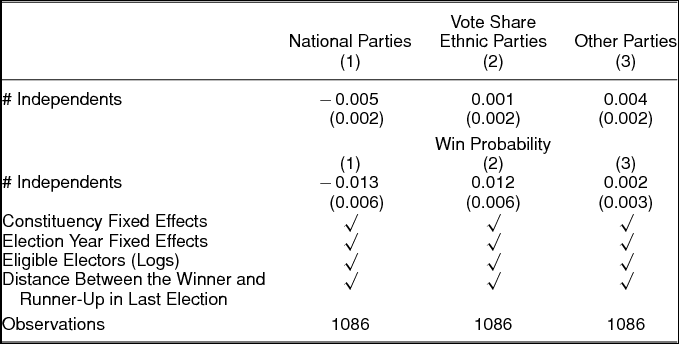
Instrumental variable estimates of the effect of the number of independent candidates. Standard errors (in parentheses) are clustered at the level of constituency. Ethnic parties and their states: Asom Gana Parishad (AGP), Assam; Bahujan Samaj Party (BSP), Haryana, Madhya Pradesh, Punjab, Uttar Pradesh; Communist and Marxist Parties (CPI, CPM), Kerala, West Bengal; Dravida Munnetra Kazhagam (DMK), Tamil Nadu; Haryana Vikas Party (HVP), Haryana; Janata Dal (JD), Bihar, Karnataka; Rashtriya Janata Dal (RJD), Bihar; Samajwadi Party (SP) Uttar Pradesh; Shiv Sena (SHS), Maharashtra; Telugu Desam Party (TDP), Andhra Pradesh.
Table 8 reports estimates of the effect of independents on three candidate types. The first type belongs to the major alliances formed around the bjp and the inc. The second type belongs to parties defined as major ethnic or regional parties. The third type belongs to any other party. This last type includes independents as well as small national and local parties, such as the All India Indira Congress, which was a nonethnic faction that broke away from the inc. The upper panel of Table 8 reports estimates of the effects on the collective vote shares of these candidate types. The lower panel reports estimates of the effects on their probabilities of winning.
Independents shift 5 percent (p < 0.05) of the major national alliance vote share to other, nonethnic, parties. They have no statistical effect on the vote share of major ethnic/regional parties. Independents also decrease the win probability for major national alliances by 16 percentage points (p < 0.05). They increase the win probability for ethnic parties by 15 percentage points (p < 0.05). They have no statistical effect on the win probability for other parties. The estimates in the first two columns (lower panel) nearly offset each other, suggesting ethnic parties win when major national alliances lose. Independents thus change the political equilibrium by shifting vote share away from the mainstream National to nonethnic parties and, ultimately, by making it easier for ethnic parties to win.
Chandra (Reference Chandra2004) has argued that the success of ethnic parties depends on opportunities for intraparty advancement, as well as on the size of the ethnic group it claims to represent. Parties defined by the ethnicities of leaders and members give voters an opportunity to do a simple “head count” within each party and to decide which party will advance their material interests. Our article identifies a different channel—participation by independent candidates—through which ethnic parties can succeed in democracies where patronage is important.Footnote 42
ROBUSTNESS
Amendment to the Representation of the People Act (of 1951)
As noted in our discussion of the context, the entry-deposit reform was part of a broader package of reforms that took place between 1996 and 1998. Here we elaborate on the other relevant reforms as well as the implications for our identification strategy.
The first reform increased the signature requirement for unrecognized and independent candidates from one to ten, while the number of required signatures for recognized parties dropped from two to one. By the standards of other democracies the signature requirements in India are trivial. To put it in context, according to Brancati (Reference Brancati2008), the percentage of signatures required relative to the total number of electors averaged over the 34 democracies (including ones with no signature requirement) is 0.31%. In India, given that the average constituency in our sample has approximately 945,000 electors, this would amount to a signature requirement of just under 3,000. Indeed, in even the most rural and remote constituencies, the 10-signature requirement can be met by enlisting the support of friends and family.
The second reform restricted the number of constituencies a candidate could contest. Prior to the reforms, a General candidate could, in principle, contest any number of the open constituencies, while SC/ST candidates could contest any number of the SC/ST-reserved or general constituencies. The reforms reduced the maximum number of contestable constituencies to two. The reform really only has implications for higher profile candidates, usually party leaders or prospective prime ministers who need to guarantee themselves a seat in the legislature.Footnote 43 Independents, and other candidates from smaller parties, are unaffected because they typically only have resources to contest in one constituency in any case. From this standpoint, the reform should have minimal implications for our identification strategy.Footnote 44
The third reform stipulated that ballots were to be ordered, first, according to party type and, second, alphabetically within each party-type category. The ordering of party types was to be (1) candidates from recognised parties, (2) candidates of registered but unrecognised parties, and (3) independents. Within each category, candidates were required to be listed alphabetically. Prior to the reforms, the presentation of candidate names on the ballot was at the discretion of the presiding officer. We expect that the changes to the ordering of candidates had no effect on voter turnout, as the average voter was likely unaware of this change before voting. Changes to the candidate order could, in principle, affect electoral outcomes, however. Shue and Luttmer (Reference Shue and Luttmer2009) have shown that ballot placement can affect the chances of winning, and the effects are strongest in precincts with poorer and less educated voters. By the logic of their results, we would expect the increase in the probability of electing a governing-coalition candidate to be smaller in open constituencies, implying that, if anything, we are underestimating the effect of independents on who wins.
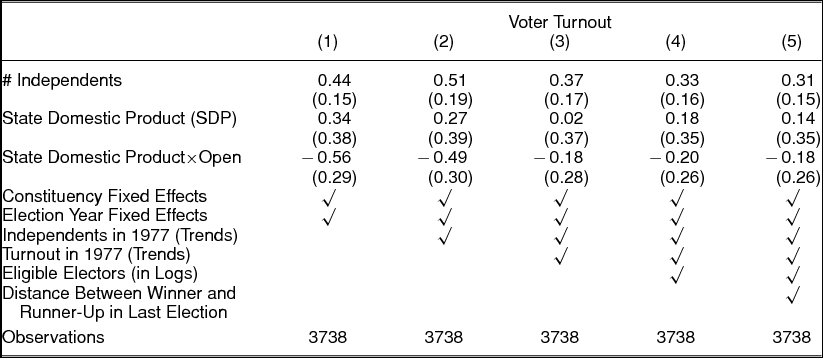
The fourth reform specified that polling days were to be paid holidays for workers, unless it causes danger or results in substantial losses for the employer. In principle, this should increase voter turnout, but may do so differentially. For example, the mandated paid holiday may have increased turnout more in poorer districts where workers are less able to forfeit a day’s wages. Alternatively, poorer districts could experience a relative decrease in turnout if the cost to employers of letting workers take time from work is larger in wealthy districts. Absent detailed information about employer practices on the day of elections, it is difficult to know which is the case.Footnote 45 To ensure our results are robust to this possibility, Appendix Table A5 considers modifications of our main specification where, in the absence of data on constituency-level income, we include as a control an interaction between the reservation status of the district and state-level income (state domestic product). This allows for the possibility that turnout depends on income differentially across reserved and unreserved constituencies. Our results are unaffected by the inclusion of this variable.Footnote 46
Dummy Candidates
By 1996, 50 years of inflation had effectively made it costless to run a candidate in an election, and there was concern that parties were running dummy candidates to steal votes from opponents. For example, one might observe the names Mohammed Khan, Muhammed Khan, and Mohammad Khan, where only the latter was a legitimate candidate. The idea was to confuse supporters of Mohammad Khan into mistakenly voting for one of the other two candidates.Footnote 47
Dummy candidates are a concern because their presence may correlate with the deposit as well as the turnout and voting decisions of voters. However, as noted by Bhattacharya and Mitra (Reference Bhattacharya and Mitra2014), running dummy candidates is only feasible for the larger parties, who in principle are unaffected by the deposit. By this token, we expect the reform to have no effect on the number of dummy candidates. Online Appendix OA.2 confirms this, by constructing measures of dummy candidates—the distances between the names of candidates running in an election—and by showing that their presence was largely unaffected by the higher entry deposits. The estimates imply that our main results cannot be explained by dummy candidates.
Voter Preferences and Information
Our identification strategy assumes outcomes in open and reserved constituencies would have evolved in the same way in the absence of the reform. One of the more obvious threats to the strategy relates to the diffusion of information and communication technologies. Gentzkow (Reference Gentzkow2006) has shown that the spread of television reduced voter turnout in the United States, because voters substituted toward television and away from other types of media such as newspapers and the radio in choosing what type of media to consume. In India, television spread rapidly starting in the 1980s and 1990s. This could compromise our strategy if television diffused differentially across open and reserved constituencies. Another potential threat relates to differences in the evolution of voter preferences. Our sample begins with the first election after the “emergency” period in India,Footnote 48 and continues through a period that saw the assassinations of Indira and then Rajiv Gandhi, of massive trade liberalization, and a devolution of powers to states, among other changes.
Our flexible controls should soak up a good deal of the variation in turnout that is generated by the diffusion of television. As before, clustering the standard errors on the constituency helps us adjust for differences in diffusion that could manifest in differences in slope coefficients. Nonetheless, Online Appendix OA.3 draws on data from the 1971 Indian National Election Study to show our results are robust to adjustments for information and communication technologies, voter preferences, and other factors.
CONCLUSION
We have exploited exogenous changes in the entry deposits candidates pay for their participation in the political process to estimate the causal effect of independent candidates on voter turnout and election outcomes in India. We have shown that, while they increase turnout, they decrease the chances that a constituency will elect a candidate that belongs to the party, or coalition of parties, that forms the national government. This implies the price of independent participation is constituency representation in government and, consequently, that independents can be important for political representation.
Our article leaves several questions open for future research. Our results regarding turnout and the vote share of independents are consistent with voters turning out to vote for the independent candidates themselves, and in turn with independent candidates providing voters with better opportunities to express their preferences.Footnote 49 If this is the case, then independents generate a trade-off between giving voters better opportunities for preference expression and constituency representation in government. Our results are consistent with other mechanisms, however, including one in which independents trade handouts for votes and/or turnout (Nichter Reference Nichter2008). Sorting through the various mechanisms is important because the entry deposit increases were sizeable relative to average income, and likely deterred candidacy by poorer, nonpartisan, (Ansolabehere and Gerber Reference Ansolabehere and Gerber1996) but representative segments of the population.
While we are able to say much about who citizens elect to represent their constituency, we say little about how responsive the elected representative is when voters are faced with a broader set of choices. India is a mature democracy and has had a relatively free media in the post-1977 era. Independents can affect what the representative learns about the preferences of the electorate during the campaign,Footnote 50 and can increase citizen knowledge about alternative policies, as well as what citizens know about each other’s preferences.Footnote 51 They may thus facilitate the selection of representatives who are more responsive to their constituents. While we are unable to test this directly, it would be of interest to know whether it is the case.
The generalizability of our findings will determine the practical relevance for other election commissions, particularly in parliamentary democracies where representatives are elected by a plurality in single-member districts. The portability of the effect of independents on turnout will depend on the preference distribution of voters in other contexts. Because of the many language and ethnic identities in India, we expect a relatively wide distribution even within constituencies, which presents potential candidates with greater opportunities to draw out voters, and lends itself to large effects of independents on turnout. This should not be the case in democracies with more narrow preference distributions.
Lastly, the effect of independents on constituency representation should have portability to democracies with first-past-the-post systems. The effect should be less pronounced in democracies with multimember districts. Our finding that ethnic parties benefit most from independents is even less portable. However, one might expect similar patterns in the UK, for example, where parties like the Scottish National Party and Plaid Cymru appeal to ethnic identity and could benefit from vote splitting between parties who do not. It is also possible that the same mechanism has applicability to countries with “special interest” parties, such as the Green Party in Canada, which focuses narrowly on issues that are a priority for a relatively small segment of the electorate.
SUPPLEMENTARY MATERIAL
To view supplementary material for this article, please visit https://doi.org/10.1017/S0003055418000199.
Replication files can be find on Dataverse at: https://doi.org/10.7910/DVN/AJHFHU.
ADDITIONAL TABLES AND ROBUSTNESS
Summary Statistics for Full Sample

Descriptives for 1996 and 1998 Elections Alone (With Influential Observations)

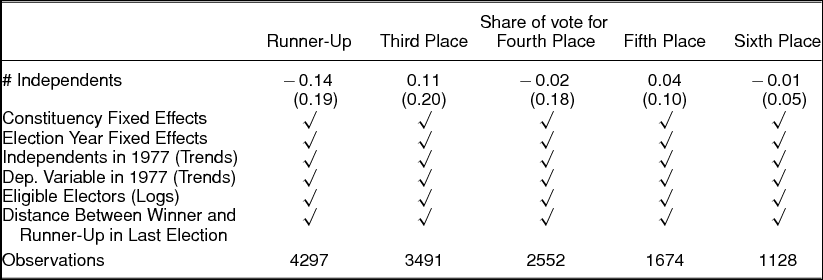
Independents and the Vote Shares of the Runner-Up, Third-Place Candidate, and So On

Independents and Established Parties

Robustness to Differential Trends in State Income





Comments
No Comments have been published for this article.