1. Introduction
Risk is a measure of possible variation of economic outcomes. It is a measure of the variation between the actual outcome and the expected outcome. An individual is exposed to a significant amount of risk associated with perils such as death, disability, fire, and so on. By purchasing an insurance contract, the individual can transfer this risk or variability of possible outcomes to an insurance company in exchange for a set of payments called premiums. This contract gives the individual the right to make a claim on the insurance company to cover losses incurred. In life insurance, the risk is associated with variability in the number of death claims, which is modelled by a probability frequency distribution. In most property/casualty lines of insurance, not only is there frequency distribution of the number of claims, but there is also severity or loss distribution for size of claim.
Claims are triggers that accrue costs against an insurer. The cost of a claim is the magnitude of the effect associated with it. This may also be referred to as loss, size, or amount of damage. Thus, modelling the number of claims is a critical part of loss reserving, pricing, and underwriting in insurance companies. The precision of claims count estimation is therefore crucial to the successful performance of an insurance company. Usually, count regression analysis is used that allows for risk factors to be identified, including the expected frequency of claims of policy holders. A common way to calculate the premium is to obtain the conditional expectation of the claims count, given the risk characteristics and combined it with the expected claim size. Jewell (Reference Jewell1974) presents the Bayesian credibility model for claim counts with a natural conjugate prior distribution. This model is widely used in non-life insurance companies as part of the process of estimating and predicting the expected claims count in upcoming periods using the past experience of claims of a particular risk class.
In this paper, we consider a mixed Poisson model for claims count data arising in Group Life insurance. We present a Bayesian formulation to determine the number of groups in an insurance portfolio consisting of claim numbers or deaths. We take a non-parametric Bayesian approach to modelling this mixture distribution using a Dirichlet process prior and use reversible jump Markov chain Monte Carlo (RJMCMC) to estimate the number of components in the mixture. The physical interpretation of the model is that heterogeneity is assumed to be drawn from one of a finite number of possible groups, and its proportion will be estimated using Markov chain Monte Carlo (MCMC). Unlike Haastrup (Reference Haastrup2000), we show that the assumption of identical heterogeneity for all groups may not hold as 88% of the posterior probability is assigned to models with two or three components, and 11% to models with four or five components, whereas models with one component are never visited. We apply different RJMCMC algorithms and show that the birth/death method is preferred. Our major contribution to the actuarial literature is showing how to account for both model uncertainty and parameter estimation within a single framework.
Dellaportas et al. (Reference Dellaportas, Forster and Ntzoufras2000, Reference Frühwirth-Schnatter2003) describe Bayesian model and variable selection using Gibbs sampler and MCMC. Ntzoufras & Dellaportas (Reference Ntzoufras and Dellaportas2002) model outstanding insurance liabilities incorporating claims count uncertainty using Bayesian analysis. Katsis & Ntzoufras (Reference Katsis and Ntzoufras2005) and Ntzoufras et al. (Reference Robert and Casella2005) perform Bayesian analysis of insurance claims count distribution using the Gibbs sampler and reversible jump algorithm, respectively. Bermúdez & Karlis (Reference Bermúdez and Karlis2011) apply MCMC methods to Bayesian multivariate regression Poisson models for the pricing of an insurance contract that contains different types of coverages, which may be dependent, such as automobile insurance. Bermúdez & Karlis (Reference Bermúdez and Karlis2012) also apply a finite mixture of bivariate Poisson regression models to insurance ratemaking. Verrall & Wüthrich (Reference England, Verrall and Wüthrich2012) use the RJMCMC method for parameter reduction in claims reserving. Other Bayesian and MCMC methods with applications to claims reserving are also presented in England et al. (Reference Donnelly and Wüthrich2011) and Donnelly & Wüthrich (2012). Streftaris & Worton (Reference Walhin and Paris2008) apply efficient and approximate Bayesian inference to insurance claims data, whereas Gibbs sampler is used in the Bayesian modelling of financial guarantee insurance in Puustelli et al. (Reference Titterington, Smith and Makov2008). The reader is directed to Anastasiadis & Chukova (Reference Anastasiadis and Chukova2012) for an extensive overview of the recent literature on the modelling of insurance claims, and the processes associated with them.
The remainder of this paper is organised as follows: section 2 introduces and extends the Poisson mixture model. Algorithms are presented in section 3. These include the reversible jump model selection and the split and merge method of Dellaportas et al. (Reference Dellaportas, Forster and Ntzoufras1997). We apply these algorithms to count data obtained from a major Norwegian insurance company. Numerical results are presented and analysed in section 4. We conclude in section 5.
2. Model and Data
In this section, we present a credibility model for heterogeneity along with data consisting of exposures and deaths/claims count. The data arise from 1,125 groups insured during all, or part of the period 1982–1985, by a major Norwegian insurance company. There are n=72 groups distinguished by occupation category. The heterogeneity model is used to model differences in each of the n groups. The ith group has risk exposure E i, and observed number of deaths D i. The data are also analysed in Haastrup (Reference Haastrup2000) and Norberg (Reference Norberg1989). Let D 1, … ,D n denote the number of observed deaths in each insured group. Associated with each group is the exposure, denoted as E 1, … , E n, respectively, which is a measure of the propensity of that group to produce claims/deaths. Let D n denote the collection of all deaths for each group, where
 $$D^{n} \,=\,\{ D_{{\rm 1}} ,\ldots,D_{n} \} $$
Similarly, let E n denote the collection of all exposures for the groups. That is,
 $$E^{n} \,=\,\{ E_{{\rm 1}} ,\ldots,E_{n} \} $$
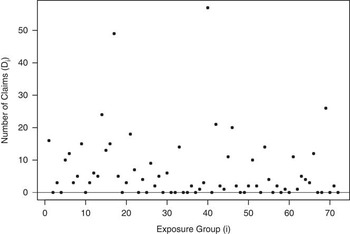
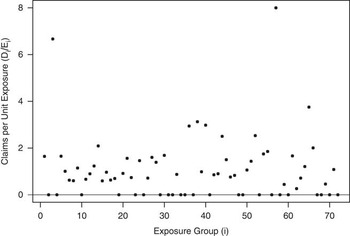
Figure 1 shows a plot of the claim number for each group, whereas Figure 2 shows the claim numbers normalised by their corresponding exposures.
Plot of the number of observed claims for each group.

Plot of the number of observed claims per unit exposure.

The heterogeneity model is used to model differences in each of the n groups. For each group, the exposures are recorded followed by the resulting number of deaths or claims. Haastrup (Reference Haastrup2000) assumes that each group i has a unique heterogeneity parameter, denoted λ i, and that the number of deaths D i, follows a Poisson distribution with mean λ iE i. The groups are assumed to be mutually independent, given the heterogeneity parameters λ 1, λ 2, … , λ n. Furthermore, Haastrup assumes that this distribution is identical for each group. In practice, large values of E i will account for large values of D i, which will lead to similar values of λ i for each i.
Thus,
 $$D_{i} \sim{\rm Poisson}\,(\lambda _{i} E_{i} ),\quad \quad i\,=\,1,\ldots,n$$
We take a fully Bayesian approach and assume that λ i are i.i.d and follow a Gamma distribution with parameters α and β, that is,
 $$\lambda _{i} \sim{\rm Gamma}\,(\alpha ,\,\beta )$$
where α and β are also assumed to be unknown.
The advantage of using such mixed distributions is that it allows for overdispersion in the number of occurrences as
 $${\Bbb E}\,(D_{i} )\,=\,{\Bbb E}\,({\Bbb E}\,(D_{i} \mid\lambda ))\,=\,{\Bbb E}\,\left( {E\lambda } \right)\,=\,E\alpha /\beta $$
and
 $$\eqalignno{ {\Bbb V}{\rm ar}\,(D_{i} )\,= \,& {\Bbb E}\,({\Bbb V}{\rm ar}\,(D_{i} \mid\lambda ))\,{\plus}\,{\Bbb V}{\rm ar}\,({\Bbb E}\,(D_{i} \mid\lambda )) \cr = \,& E\alpha /\beta \,{\plus}\,E^{{\rm 2}} \alpha /\beta ^{{\rm 2}} \,\gt \,{\Bbb E}\,(D_{i} ) $$
2.1. Extending the basic model–mixture formulation
We now extend the model by proposing a Poisson mixture model formulation. We assume that D i, given λ j, has a Poisson distribution with mean λ jE i. We take a non-parametric Bayesian approach to modelling this mixture distribution using a Dirichlet process prior, and use RJMCMC to estimate the number of components in the mixture. In this case, the physical interpretation of the model is that the heterogeneity is assumed to be drawn from one of k possible components, in proportions w 1, … , w k. The method we describe is essentially a classification problem where we assume that each observed D i comes from only one of k components, where each component has a Poisson distribution. Thus,
 $$D_{i} \mid\lambda _{j} \sim{\rm Poisson}\,(E_{i} \lambda _{j} )\quad j\,=\,{\rm 1},\ldots,k;\,i\,=\,{\rm 1},\ldots,n$$
More general forms of the mixture Poisson model with covariates are discussed in Green & Richardson (Reference Haastrup2002). Mixture models for grouped claim numbers are considered by Tremblay (Reference Tremblay1992) and Walhin & Paris (Reference Walhin and Paris1999, Reference Walhin and Paris2000). Dellaportas et al. (Reference Dellaportas, Forster and Ntzoufras1997) considers count data in finance using split/merge moves, whereas Viallefont et al. (Reference Viallefont, Richardson and Green2002) provide a more general discussion of mixtures of Poisson distributions using both split/merge moves and birth/death moves. Other methods for determining the number of components in a mixture are discussed by McLachlan & Peel (Reference Ntzoufras and Dellaportas2000), Phillips & Smith (Reference Phillips and Smith1996), Carlin & Chib (Reference Carlin and Chib1995), and Stephens (Reference Viallefont, Richardson and Green2000), who use Markov chains to model jointly the number of components and component values. The advantage of the Bayesian formulation is that we can place posterior probabilities on the order of the model.
2.2. The likelihood function
Throughout our discussion, n will denote the number of data points and k the number of components in the mixture formulation. For a finite mixture model, the observed likelihood function is
 $$L\,(D^{n} \mid\lambda ,\,w,\,E^{n} )\,=\,\prod\limits_{i\,=\,1}^n {\mathop{\sum}\limits_{j\,=\,1}^k {w_{j} f_{j} \,(D_{i} \mid\lambda _{j} ,\,E_{i} )} } $$
where the weights are non-negative and  $\mathop{\sum}\nolimits_{j\,=\,1}^k {w_{j} \,=\,1} $
. Even for moderate values of n and k, this takes a long time to evaluate as there are k n terms when the inner sums are expanded (Casella et al., Reference Dellaportas and Karlis2000). Another form of the likelihood function will be derived shortly. Classical estimation procedures for mixture models are described by Titterington et al. (Reference Walhin and Paris1990) and McLachlan & Peel (Reference Ntzoufras and Dellaportas2000).
Let z i be categorical random variables taking values in {1, … ,k} with probabilities w 1, … ,w k, respectively, so that
 $$p\,(z_{i} \,=\,j\mid w)\,=\,w_{j} $$
Let f j (·) denote a Poisson density with parameter λ j. Suppose that the conditional distribution of D i, given z i=j, is Poisson (λ j), j=1, … , k. Then the unconditional density of D i is given by
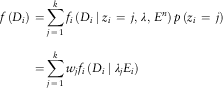 $$\eqalignno{ f\,(D_{i} )\,= & \mathop{\sum}\limits_{j\,=\,1}^k {f_{i} \,(D_{i} \mid z_{i} \,=\,j,\,\lambda ,\,E^{n} )\,p\,(z_{i} \,=\,j)} \cr = & \mathop{\sum}\limits_{j\,=\,1}^k {w_{j} f_{i} \,(D_{i} \mid\lambda _{j} E_{i} )} $$
With each pair (D i, E i), we associate a latent variable z i, which is an indicator variable that indicates which component of the mixture is associated with (D i, E i). We have z i=j if the ith data point (D i, E i), comes from the jth component of the mixture. Thus, for each i, we have
 $$z_{i} \mid w\sim{\scr M}({\rm 1};\,w_{{\rm 1}} ,\ldots,\,w_{k} )$$
and
 $$D_{i} \mid z_{i} \sim{\cal P}(\lambda _{{zi}} E_{i} )$$
By incorporating the indicator variables z i, the complete data likelihood is then
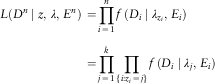 $$\eqalignno{ L(D^{n} \mid z,\,\lambda ,\,E^{n} )\,= & \prod\limits_{i\,=\,1}^n {f\,(D_{i} \mid\lambda _{{z_{i} }} ,\,E_{i} )} \cr = & \prod\limits_{j\,=\,1}^k {\prod\limits_{\{ i:z_{i} \,=\,j\} } {f\,(D_{i} \mid\lambda _{j} ,\,E_{i} )} } $$
At times, especially for the fixed k case described below, it is more convenient to work with (3) as it involves multiplications only, rather than additions and multiplications, as in (1). Note that the inclusion of the categorical variables (z i) does not add to the complexity of the model. Instead, it results in a simplification of the likelihood function from being a product of sums as in (1) to a product only, as in (3).
The convenience of using the missing data formulation is that the posterior conditional distribution of the model parameters would be standard distributions. Moreover, the augmented variables z i allow us to see the component of the mixture to which the data points are assigned.
2.3. Gibbs updates for fixed k
We consider a mixture of Poissons, where conditional on there being k components in the mixture:
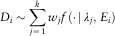 $$D_{i} \sim\mathop{\sum}\limits_{j\,=\,1}^k {w_{j} f\,( \cdot \!\mid\lambda _{j} ,\,E_{i} )} $$
The weights w j, sum to 1, and are non-negative. That is,
 $$\mathop{\sum}\limits_{j\,=\,1}^k {w_{j} \,=\,1\;{\rm and}\;w_{j} \,\geq \,0} $$
f(D i ∣ λ, z i=j, E i) ~ Poisson (λ jE i) with allocations P(z i=j)=w j
and
 $$w\sim{\cal D}\,(\delta _{{\rm 1}} ,\ldots,\,\delta _{k} )$$
follows a Dirichlet distribution. We also make the additional assumption that the δj’s are equal to 1, so that p(w) is a uniform distribution on the space described by (4). For the Poisson parameters λ j, we take Gamma priors, so that
 $$\lambda _{j} \sim{\rm Gamma}\,(a,\,b),\quad \quad j\,=\,{\rm 1},\ldots,k$$
with the ordering constraint
 $$\lambda _{{\rm 1}} \,\lt \,\lambda _{{\rm 2}} \,\lt \,\cdots \lt \,\lambda _{k} $$
to ensure that the components are identifiable. The ordering constraint is not necessary for the Monte Carlo algorithm to work. However, it does avoid the problem of label switching, as otherwise, any permutation of the indices {1, … ,k} will result in the same posterior distribution. The choice of objective priors is particularly difficult for finite mixture models, as common improper priors will lead to improper posteriors; see subsection 3.2.2 of Frühwirth-Schnatter (Reference Green2006) for a discussion. Note that a Dirichlet distribution as the prior on the weights is conjugate so we also have a Dirichlet posterior distribution for the weights but with updated parameters. In addition, we choose identical priors on the hyperparameters λ j so the model is invariant to ordering.
There are k! ways to order k distinct objects. Because of the ordering constraint in equation (5), and the fact that the λs are i.i.d., the joint density of the collective λ is
 $$p\,(\lambda \mid\alpha ,\,\beta ,\,k)\,=\,k\,!\,\,p\,(\lambda _{1} \mid\alpha ,\,\beta )\, \cdots \,p\,(\lambda _{k} \mid\alpha ,\,\beta )\,I_{{\lambda _{1} \,} {{\lt \,\lambda _{2} \,\lt \,\cdots\lt \lambda _{k} }}} \,(\lambda )$$
When k is fixed and known, the factorial term k! does not affect the MCMC algorithm as it can be absorbed into the normalising constant. However, in the variable k case, it must be noted, as it is a factor in the reversible jump acceptance probability. The joint density of all unknowns is
 $$\pi \,(w,\,\lambda ,\,z\mid D^{n} )\,\propto\,p\,(w\mid\delta )\,p\,(z\mid w)\,p\,(\lambda \mid\alpha ,\,\beta )\,L\,(D^{n} \mid\lambda ,\,z,\,E^{n} )$$
With the missing data formulation, the likelihood term L (D n ∣ λ, z, E n) can be written as
 $$L\,(D^{n} \mid\lambda ,\,z,\,E)\,=\,\prod\limits_{i\,=\,1}^n {\left( {{{e^{{{\minus}\lambda _{{z_{i} }} E_{i} }} \,(\lambda _{{z_{i} }} E_{i} )^{{D_{i} }} } \over {D_{i} \,!\,}}} \right)} $$
and
 $$p\,(z\mid w)\,=\,\prod\limits_{j\,=\,1}^k {w_{j}^{{n_{j} }} } $$
where n j=#{i ∣ z i=j} is the number of observations allocated to component j. The prior distributions are
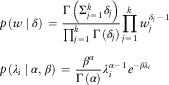 $$\eqalignno{ & p\,(w\mid\delta )\,=\,{{\Gamma \,\left( {\Sigma _{{j\,=\,1}}^{k} \delta _{j} } \right)} \over {\prod_{{j\,=\,1}}^{k} \Gamma \,(\delta _{j} )}}\prod\limits_{j\,=\,1}^k {w_{j}^{{\delta _{j} \,{\minus}\,1}} } \cr & p\,(\lambda _{i} \mid\alpha ,\,\beta )\,=\,{{\beta ^{\alpha } } \over {\Gamma \,(\alpha )}}\lambda _{i}^{{\alpha \,{\minus}\,1}} e^{{{\minus}\beta \lambda _{i} }} $$
Using Bayes’ theorem, we have the following posterior conditional distributions:
 $$\pi \,(\lambda _{j} )\,\propto\,\lambda _{j}^{{\alpha \,{\minus}\,1}} e^{{{\minus}\beta \lambda _{j} }} \,{\times}\,\lambda _{j}^{{\Sigma _{{i\,\mid\, z_{i} \,=\,j}} D_{i} }} e^{{{\minus}\lambda _{j} \Sigma _{{i\,\mid\, z_{i} \,=\,j}} E_{i} }} \,I_{{(\lambda _{{j\,{\minus}\,1,\,}} \lambda _{{j\,{\plus}\,1}} )}} \,(\lambda _{j} )$$
and
 $$\pi \,(w\mid\delta ,\,z)\,\propto\,p(w\mid\delta )\,p\,(z\mid w)$$
so that
 $$w\sim{\cal D}\,(\delta _{{\rm 1}} \,{\plus}\,n_{{\rm 1}} ,\ldots,\delta _{k} \,{\plus}\,n_{{_{k} }} )$$
where n j=#{i|z i=j}. For z, we update the allocations using
 $$P\,(z_{i} \,=\,j)\,\propto\,w_{j} f\,(D_{i} \mid\lambda _{j} ,\,E_{i} )\quad i\,=\,1,\ldots,n;\quad j\,=\,1,\ldots,k$$
so that
 $$p\,(z_{i} \,=\,j)\,=\,{{w_{j} f\,(D_{i} \mid\lambda _{j} ,\,E_{i} )} \over {\Sigma _{{j\,=\,1}}^{k} \,w_{j} f\,(D_{i} \mid\lambda _{j} ,\,E_{i} )}}$$
This follows from equation (2). The Gibbs algorithm for fixed k is then (Robert & Casella, Reference Robert and Casella1999)
Step 1: Simulate z i from
 $$p\,(z_{i} \,=\,j)\,\propto\,w_{j} f\,(D_{i} \mid\lambda _{j} ,\,E_{i} )\ {\rm for}\ j\,=\,{\rm 1},\ldots,k$$
and compute  $n_{j} ,\,n_{j} \bar{D}_{j} ,\,n_{j} \bar{E}_{j} $
from
 $$n_{j} \,=\,\mathop{\sum}\limits_{i\mid z_{i} \,=\,j} {(1)} \quad n_{j} \bar{D}_{j} \,=\,\mathop{\sum}\limits_{i\mid z_{i} \,=\,j} {D_{i} } \quad n_{j} \bar{E}_{j} \,=\,\mathop{\sum}\limits_{i\mid z_{i} \,=\,j} {E_{i} } $$
Step 2: Simulate
 $$\lambda _{j} \sim{\rm Gamma}\,(\alpha \,{\plus}\,n_{j} \bar{D}_{j} ,\,\beta \,{\plus}\,n_{j} \bar{E}_{j} )\,{\Bbb I}_{{(\lambda _{{j\,{\minus}\,1}} ,\,\lambda _{{j\,{\plus}\,{\rm 1}}} )}} \,(\lambda _{j} )\;{\rm for}\;j\,=\,{\rm 1},\ldots,k$$
Step 3: Simulate
 $$w\sim{\cal D}\,(\delta \,{\plus}\,n_{{\rm 1}} ,\ldots,\delta \,{\plus}\,n_{k} )$$
3. The Algorithms
The analysis in the preceding sections assumed that the number of components in our mixture formulation is fixed and known. We now extend the results to the case where k varies. That is, the number of components of the mixture are not known in advance. This is a model selection problem in which the objective is to select a model with the number of components that best describe our data. The algorithms used in our model selection analysis now follow.
3.1. RJMCMC
The reversible jump algorithm is an extension of the Metropolis–Hastings algorithm. We assume there is a countable collection of candidate models, indexed by  $$M_{i} \in {\scr M}\,=\,\{ M_{1} ,\,M_{2} ,\ldots,M_{k} \} $$
. We further assume that for each model M i, there exists an unknown parameter vector
 $\theta _{i} \in {\Bbb R}^{{n_{i} }} $
, where n i, the dimension of the parameter vector, can vary with i. Typically, we are interested in finding which models have the greatest posterior probabilities, and also to obtain estimates of the parameters. Thus, the unknowns in this modelling scenario will include the model index M i, as well as the parameter vector θ i. We assume that the models and corresponding parameter vectors have a joint density π(M i, θ i). The reversible jump algorithm constructs a reversible Markov chain on the state space
 $${\scr M}\,{\times}{\cup}_{{M_{i} \,\in \,{\scr M}}} \,{\Bbb R}^{{n_{i} }} $$
, which has π as its stationary distribution (Green, Reference Green and Richardson1995). In many instances, and in particular for Bayesian problems, this joint distribution is of the form
 $$\pi \,(M_{i} ,\,\theta _{i} )\,=\,\pi \,(M_{i} ,\,\theta _{i} \mid X)\,\propto\,L(X\mid M_{i} ,\,\theta _{i} )\,p\,(M_{i} ,\,\theta _{i} )$$
where the prior on (M i, θ i) is often of the form
 $$p\,(M_{i} ,\,\theta _{i} )\,=\,p(\theta _{i} \mid M_{i} )\,p\,(M_{i} )$$
with p(M i) being the density of some counting distribution.
Suppose we are at model M i and a move to model Mj is proposed, with probability r ij. The corresponding move from θ i to θ j is achieved by using a deterministic transformation h ij, such that
 $$(\theta _{j} ,\,v)\,=\,h_{{ij}} \,(\theta _{i} ,\,u)$$
where u and v are random variables introduced to ensure dimension matching necessary for reversibility. To ensure dimension matching, it is necessary that
 $$\dim \,(\theta _{j} )\,{\plus}\,\dim \,(v)\,=\,\dim \,(\theta _{i} )\,{\plus}\,\dim \,(u)$$
For discussions about possible choices for the function h ij, we refer the reader to Green (Reference Green and Richardson1995) and Brooks et al. (Reference Brooks, Giudici and Roberts2003b). Let
 $$A\,(\theta _{i} ,\,\theta _{j} )\,=\,{{\pi \,(M_{j} ,\,\theta _{j} )} \over {\pi \,(M_{i} ,\,\theta _{i} )}}\,{{q\,(v)} \over {q\,(u)}}{{r_{{ji}} } \over {r_{{ij}} }}\;\left| {{{\partial h_{{ij}} \,(\theta _{i} ,\,u)} \over {\partial \,(\theta _{i} ,\,u)}}} \right|$$
The acceptance probability for a proposed move from model (M i, θ i) to model (M j, θ j) is then
 $${\rm min}\,\{ {\rm 1},\,A\,(\theta _{i} ,\,\theta _{j} )\} $$
where q(u) and q(v) are the respective proposal densities for u and v, and ∣ ∂h ij (θ i, u)/∂(θ i, u) ∣ is the Jacobian of the transformation induced by h ij. Green (Reference Green and Richardson1995) shows that the algorithm with acceptance probability given above simulates a Markov chain that is reversible and follows from the detailed balance equation
 $$\pi \,(M_{i} ,\,\theta _{i} )\,q\,(u)\,r_{{ij}} \,=\,\pi (M_{j} ,\,\theta _{j} )\,q\,(v)\,r_{{ji}} \left| {{{\partial h_{{ij}} \,(\theta _{i} ,\,u)} \over {\partial \,(\theta _{i} ,\,u)}}} \right|$$
Detailed balance is necessary to ensure reversibility and is a sufficient condition for the existence of a unique stationary distribution. For the reverse move from model M j to model M i, it is easy to see that the transformation used is (θ i, u)=h −1(θ j, v) and the acceptance probability for such a move is
 $$\min \,\left\{ {1,\,{{\pi \,(M_{i} ,\,\theta _{i} )} \over {\pi \,(M_{j} ,\,\theta _{j} }}\,{{q\,(u)} \over {q\,(v)}}\,{{r_{{ij}} } \over {r_{{ji}} }}\left| {{{\partial h_{{ij}} \,(\theta _{i} ,\,u)} \over {\partial \,(\theta _{i} ,\,u)}}} \right|^{{{\minus}1}} } \right\}\,=\,\min \,\{ 1,\,A\,(\theta _{i} ,\,\theta _{j} )^{{{\minus}1}} \} $$
For inference regarding which model has the greater posterior probability, we can base our analysis on a realisation of the Markov chain constructed above. The marginal posterior probability of model M i is
 $$\pi \,(M_{i} \mid X)\,=\,{{p\,(M_{i} )\,f\,(X\mid M_{i} )} \over {\Sigma _{{M_{j} \,\in \,{\scr M}}} \,p\,(M_{j} )\,f\,(X\mid M_{j} )}}$$
where
 $$f\,(X\mid M_{i} )\,=\,\mathop{\int} {L\,(} X\mid M_{i} ,\,\theta _{i} )\,p\,(\theta _{i} \mid M_{i} )\,d\theta _{i} $$
is the marginal density of the data, which is obtained by integrating over the unknown parameters θ. In practice, we estimate π(M i ∣ X) by counting the number of times the Markov chain visits model M i in a single long run after reaching stationarity. These between-model moves described in this section are also augmented with within-model Gibbs updates as given in section 2.3 to update model parameters.
To assess convergence of the reversible jump algorithm, we use the method of Brooks & Giudici (Reference Brooks and Giudici1999) in which they propose to run I≥2 chains in parallel and base their convergence diagnostic on splitting the total variation not just between chains, but also between models. Their method was extended by Brooks et al. (Reference Brooks, Giudici and Philippe2003a) to include non-parametric techniques, including χ 2 tests, Kolmogorov–Smirnov tests, and direct convergence rate estimation.
Brooks et al. (Reference Brooks, Giudici and Philippe2003a) suggest several methods for assessing convergence within the context of model selection problems. In particular, for reversible jump algorithms, we can have some idea of how fast the simulations approach stationarity by comparing the empirical stationary distribution with the observed model orders. They propose specific test statistics based on the χ 2 distribution and also a Kolmogorov–Smirnov test for goodness of fit. The χ 2 and Kolmogorov–Smirnov compare the stationary distribution of each chain and computes p-values for the computed test statistics. A critical value of 5% is used so that if the χ 2 or Kolmogorov–Smirnov statistic is above this significance level there is no reason to reject the chains as not being from the same stationary distribution. See Brooks et al. (Reference Brooks, Giudici and Philippe2003a) for further details.
3.2. Reversible jump model selection
To update the model order, and thereby increase or decrease the number of components in the mixture, we use a combination of birth/death and split/merge moves as described below. We assume a uniform prior on the number of components k, so that
 $$k\sim U\,\{ {\rm 1},\ldots,k_{{{\rm max}}} \} $$
where k max is chosen to allow the algorithm to explore all feasible models. We set k max=72, the number of groups, as under our hypothesis, this is the maximum number of components in the mixture. k=k max only when the groups are all distinct. Setting k max=72 will allow for direct comparison of the empirical Bayesian and the mixture model approach.
By introducing a prior on the number of components k, we extend the joint density (6) of all parameters. This yields
 $$\pi \,(k,\,w,\,z,\,\lambda \mid D^{n} )\,\propto\,p\,(k)\,p\,(w\mid\delta ,\,k)\,p\,(\lambda \mid\alpha ,\,\beta ,\,k)\,p\,(z\mid k)\,L\,(D^{n} \mid\lambda ,\,z)$$
Note that the densities of the other model parameters now depend on k. In sections 3.3 and 3.5, we describe in detail two algorithms that are used to simulate from this density. These algorithms are then combined with the fixed k updates of section 2.3 to simulate from the density in equation (10). Modelling mixtures with and without the Dirichlet process prior is considered by Green & Richardson (Reference Green and Richardson2001), who also consider the case of an unknown number of components. Alternatives to the reversible jump algorithm exist in this context. For example, Dellaportas & Karlis (Reference Dellaportas and Karlis2001) develop a semi-parametric sample-based method to approximate a mixing density g(θ), based on the method of moments.
3.3. Split and merge moves
Note that the joint density in equation (10) now depends on k. We use the split/merge method of Dellaportas et al. (Reference Dellaportas, Forster and Ntzoufras1997) and Viallefont et al. (Reference Viallefont, Richardson and Green2002). Suppose we are at a configuration with k components, with
 $$\theta _{k} \,=\,\{ (\lambda _{{\rm 1}} ,\,w_{{\rm 1}} ),\ldots,\,(\lambda _{k} ,\,w_{k} )\} $$
and suppose a move to increase the number of components is proposed. We select uniformly one of the current k components to be split. Suppose the jth component (λ j, w j) is selected to be split into two components  $$(\lambda _{{j_{1} }} ,\,w_{{j_{1} }} )$$
and
 $$(\lambda _{{j_{2} }} ,\,w_{{j_{2} }} )$$
such that j 1=j and j 2=j+1, the components originally numbered j+1, … , k are then renumbered j+2, … , k+1. The split is also designed so that the first two moments of the split component remain the same as the original component. Thus, we simulate u1 and u2 from densities defined on the interval [0, 1]. Usually, we use β densities and set
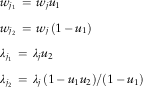 $$\eqalignno{ & w_{{j_{{\rm 1}} }} \,=\,w_{j} u_{{\rm 1}} \cr & w_{{j_{{\rm 2}} }} \,=\,w_{j} \,({\rm 1}\,{\minus}\,u_{{\rm 1}} ) \cr & \lambda _{{j_{{\rm 1}} }} \,=\,\lambda _{j} u_{{\rm 2}} \cr & \lambda _{{j_{{\rm 2}} }} \,=\,\lambda _{j} \,({\rm 1}\,{\minus}\,u_{{\rm 1}} u_{{\rm 2}} )/({\rm 1}\,{\minus}\,u_{{\rm 1}} ) $$
Other choices for splitting and merging components are described in Viallefont et al. (Reference Viallefont, Richardson and Green2002). The proposed parameter is then
 $$\eqalignno{ \theta _{{k{\plus}{\rm 1}}} = & \{ (\lambda _{{\rm 1}} ,\,w_{{\rm 1}} ),\ldots,\,(\lambda _{j} _{{{\minus}{\rm 1}}} ,\,w_{{j{\minus}{\rm 1}}} ),\,(\lambda _{{j_{{\rm 1}} }} ,\,w_{{j_{{\rm 1}} }} ),\,(\lambda _{{j_{{\rm 2}} }} ,\,w_{{j_{{\rm 2}} }} ) \cr & (\lambda _{{j{\plus}{\rm 1}}} ,\,w_{{j{\plus}{\rm 1}}} ),\ldots,\,(\lambda _{k} ,\,w_{k} )\} $$
If the ordering constraint in equation (5) is not satisfied, then the move is rejected immediately, as the reverse move in which we merge two adjacent components would not be possible. We can compute the Jacobian for this transformation as
 $$\left| {{{\partial \theta _{{k{\plus}1}} } \over {\partial \,(\theta _{k} ,\,u_{1} ,\,u_{2} )}}} \right|=\left| {{{\partial \,(w_{{j_{1} }} ,\,w_{{j_{2} }} ,\,\lambda _{{j_{1} }} ,\,\lambda _{{j_{2} }} )} \over {\partial \,(w_{j} ,\,\lambda _{j} ,\,u_{1} ,\,u_{2} )}}} \right|={{\lambda _{j} w_{j} } \over {1{\minus}u_{1} }}$$
For the reverse move, we select a pair of adjacent components j 1 and j 2. Combining them to get a new component labelled j, we set
 $$w_{j} =w_{{j_{1} }} {\plus}w_{{j_{2} }} ,\quad \lambda _{j} ={{w_{{j_{1} }} \lambda _{{j_{1} }} {\plus}w_{{j_{2} }} \lambda _{{j_{2} }} } \over {w_{{j_{1} }} {\plus}w_{{j_{2} }} }}$$
by keeping the first two moments of the proposed and current configuration constant. We then sample a new set of allocation variables according to equation (7). We also keep track of the probability of each allocation, so that p a(z) represents the probability of a given allocation. To compute p a(z), we first simulate z i using equation (7). For each i, the probability of that allocation is given by
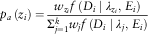 $$p_{a} \,(z_{i} )={{w_{{z_{i} }} f\,(D_{i} \mid\lambda _{{z_{i} }} ,\,E_{i} )} \over {\Sigma _{{j=1}}^{k} w_{j} f\,(D_{i} \mid\lambda _{j} ,\,E_{i} )}}$$
Finally, we compute the probability of all allocations by
 $$p_{a} \,(z)=\prod\limits_{i=1}^n {p_{a} \,(z_{i} )} $$
3.4. Acceptance probability
The acceptance probability of a move of type (k, θ k) ⇒ (k′, θ k′) is then min{1, A k, k′}, where
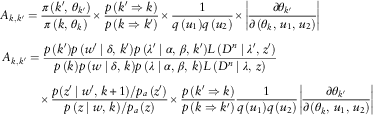 $$\eqalignno{ A_{{k,\,k'}} =\, & {{\pi \,(k',\,\theta _{{k'}} )} \over {\pi \,(k,\,\theta _{k} )}}{\times}{{p\,(k'\Rightarrow k)} \over {p\,(k\Rightarrow k')}}{\times}{1 \over {q\,(u_{1} )q\,(u_{2} )}}{\times}\left| {{{\partial \theta _{{k'}} } \over {\partial \,(\theta _{k} ,\,u_{1} ,\,u_{2} )}}} \right| \cr A_{{k,\,k'}} = & \,{{p\,(k')p\,(w'\mid\delta ,\,k')p\,(\lambda '\mid\alpha ,\,\beta ,\,k')L\,(D^{n} \mid\lambda ',\,z')} \over {p\,(k)p\,(w\mid\delta ,\,k)p\,(\lambda \mid\alpha ,\,\beta ,\,k)L\,(D^{n} \mid\lambda ,\,z)}}\cr &{\times} {{p(z'\mid w',\,k{\plus}1)/p_{a} \,(z')} \over {p\,(z\mid w,\,k)/p_{a} \,(z)}}{\times}{{p\,(k'\Rightarrow k)} \over {p\,(k\Rightarrow k')}}{1 \over {q\,(u_{1} )q\,(u_{2} )}}\left| {{{\partial \theta _{{k'}} } \over {\partial \,(\theta _{k} ,\,u_{1} ,\,u_{2} )}}} \right| $$
with k′=k+1 this becomes
 $$\eqalignno{ A_{{k,\,k{\plus}1}} = & \,{{p\,(k{\plus}1)} \over {p\,(k)}}{\times}{{p\,(w'\mid\delta ,\,k{\plus}1)} \over {p\,(w\mid\delta ,\,k)}}{\times}{{p\,(\lambda '\mid\alpha ,\,\beta ,\,k{\plus}1)} \over {p\,(\lambda \mid\alpha ,\,\beta ,\,k)}}\cr &{\times} {{L\,(D^{n} \mid\lambda ',\,w')} \over {L\,(D^{n} \mid\lambda ,\,w)}}{\times}{{p\,(k{\plus}1\Rightarrow k)} \over {p\,(k\Rightarrow k{\plus}1)}}{\times}{1 \over {q\,(u_{1} )q\,(u_{2} )}}\left| {{{\partial \theta _{{k{\plus}1}} } \over {\partial \,(\theta _{{k}},\,{\rm u}_{1} ,\,{\rm u}_{2} )}}} \right| $$
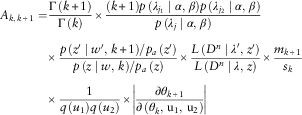
Now with a uniform prior on the number of components k and the weights w
 $$\eqalignno{ A_{{k,\,k{\plus}1}} = & {{\Gamma \,(k{\plus}1)} \over {\Gamma \,(k)}}{\times}{{(k{\plus}1)p\,(\lambda _{{j_{1} }} \mid\alpha ,\,\beta )p\,(\lambda _{{j_{2} }} \mid\alpha ,\,\beta )} \over {p\,(\lambda _{j} \mid\alpha ,\,\beta )}} \cr & {\times} {{p\,(z'\mid w',\,k{\plus}1)/p_{a} \,(z')} \over {p\,(z\mid w,\,k)/p_{a} \,(z)}}{\times}{{L\,(D^{n} \mid\lambda ',\,z')} \over {L\,(D^{n} \mid\lambda ,\,z)}}{\times}{{m_{{k{\plus}1}} } \over {s_{k} }} \cr & {\times}{1 \over {q\,(u_{1} )q\,(u_{2} )}}{\times}\left| {{{\partial \theta _{{k{\plus}1}} } \over {\partial \,(\theta _{{k}},\,{\rm u}_{1} ,\,{\rm u}_{2} )}}} \right| $$
where the ratio of Gamma terms comes from the ratio of the prior distributions on  $w\hskip0.6pt'$
and w and
 $${{p\,(k{\plus}1\Rightarrow k)} \over {p\,(k\Rightarrow k{\plus}1)}}={{m_{{k{\plus}1}} /(k{\plus}1{\minus}1)} \over {s_{k} /k}}={{m_{{k{\plus}1}} } \over {s_{k} }}$$
3.5. Birth and death moves
Suppose we are now at model M k with k components, say
 $$\theta _{k} =\left\{ {(\lambda _{{\rm 1}} ,\,w_{{\rm 1}} ),\ldots,(\lambda _{k} ,\,w_{k} )} \right\}$$
If a move is proposed to increase the number of components by one, then we simulate
 $$\tilde{w}\sim{\rm Beta}({\rm 1},\,k)\ {\rm and}\ \tilde{\lambda }\sim{\rm Gamma}(a,\,b)$$
independently. The proposed new component will then have weight  $\tilde{w}$
and the other weights are then scaled by a factor of
 $({\rm 1}{\minus}\tilde{w})$
, so that the sum of the weights remain equal to 1. The corresponding Poisson parameter for the proposed component in
 $\tilde{\lambda }$
. Note that
 $\tilde{\lambda }$
is sampled from its prior distribution. The proposed component is then
 $$\theta _{{k{\plus}{\rm 1}}} =(\lambda _{{\rm 1}} ,\,w_{{\rm 1}} /({\rm 1}{\minus}\tilde{w})),\ldots,(\lambda _{{k,\,w_{k} }} /({\rm 1}{\minus}\tilde{w})),\,(\tilde{\lambda },\,\tilde{w})\} $$
Using this proposed value of θ k+1, we also simulate proposed values for the allocations  $z\hskip0.1pt'$
with model k+1. Using the general form of the reversible jump acceptance probability, see, for example, Green (Reference Green and Richardson1995), the probability of changing the number of components to k+1 is then min{1, A k, k+1}, where
 $$A_{{k,\,k{\plus}1}} ={{\pi \,(k{\plus}1,\,\theta _{{k{\plus}1}} )} \over {\pi (k,\,\theta _{k} )}}{\times}{{p\,(k{\plus}1\Rightarrow k)} \over {p\,(k\Rightarrow k{\plus}1)}}{\times}{1 \over {q\,(\tilde{w})q\,(\tilde{\lambda })}}{\times}\left| {{{\partial \theta _{{k{\plus}1}} } \over {\partial \,(\theta _{k} ,\,\tilde{w},\,\tilde{\lambda })}}} \right|$$
Making the necessary substitutions yield
 $$\eqalignno{ A_{{k,\,k{\plus}1}} = \,& {{p\,(k{\plus}1)p\,(w'\mid\delta ,\,k{\plus}1)p\,(\lambda '\mid\alpha ,\,\beta ,\,k{\plus}1)L\,(D^{n} \mid\lambda ',\,z')} \over {p\,(k)p\,(w\mid\delta ,\,k)p\,(\lambda \mid\alpha ,\,\beta ,\,k)L\,(D^{n} \mid\lambda ,\,z)}}\cr & {\times} {{p\,(z'\mid w',\,k{\plus}1)/p_{a} \,(z')} \over {p\,(z\mid w,\,k{\plus}1)/p_{a} \,(z)}}{\times}{{p\,(k{\plus}1\Rightarrow k)} \over {p\,(k\Rightarrow k{\plus}1)}}{\times}{1 \over {q\,(\tilde{w})q\,(\tilde{\lambda })}} \cr & {\times}\left| {{{\partial \theta _{{k{\plus}1}} } \over {\partial \,(\theta _{k} ,\,\tilde{w},\,\tilde{\lambda })}}} \right| $$
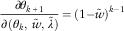
Using equations (12) and (13) we then have the Jacobian
 $${{\partial \theta _{{k{\plus}1}} } \over {\partial \,(\theta _{k} ,\,\tilde{w},\,\tilde{\lambda })}}=(1{\minus}\tilde{w})^{{k{\minus}1}} $$
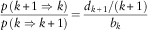
If we denote the probability of a birth when there are k components by b k, and the probability of a death by d k, with b k+d k=1, then
 $${{p\,(k{\plus}1\Rightarrow k)} \over {p\,(k\Rightarrow k{\plus}1)}}={{d_{{k{\plus}1}} /(k{\plus}1)} \over {b_{k} }}$$
as for the move to be reversible we would then be able to kill k+1 components in the new model, each with equal probability. Substituting these values in equation (14), the ratio A k,k+1 reduces to
 $$\eqalignno{ A_{{k,\,k{\plus}1}} = & {{\Gamma \,(k{\plus}1)} \over {\Gamma \,(k)}}{\times}(k{\plus}1)p\,(\tilde{\lambda }){\times}{{L\,(D^{n} \mid\lambda ',\,z')} \over {L\,(D^{n} \mid\lambda ,\,z)}}{\times}{{p\,(z'\mid w',\,k{\plus}1)/p_{a} \,(z')} \over {p\,(z\mid w,\,k)/p_{a} \,(z)}} \cr {\times} & {{d_{{k{\plus}1}} /(k{\plus}1)} \over {b_{k} }}{1 \over {q\,(\tilde{w})q\,(\tilde{\lambda })}}{\times}(1{\minus}\tilde{w})^{{k{\minus}1}} $$
which on substituting  $q(\tilde{\lambda })=p(\tilde{\lambda })$
and
 $q\,(\tilde{w})=k\,({\rm 1}{\minus}\tilde{w})^{{k{\minus}{\rm 1}}} $
further reduces to
 $$A_{{k,\,k{\plus}1}} ={{p\,(z'\mid w',\,k{\plus}1)/p_{a} \,(z')} \over {p\,(z\mid w,\,k)/p_{a} \,(z)}}{{L\,(D^{n} \mid\lambda ',\,z')} \over {L\,(D^{n} \mid\lambda ,\,z)}}{\times}{{d_{{k{\plus}1}} } \over {b_{k} }}$$
For a proposed death move, the acceptance probability is then
 $${\rm min}\{ 1,\,A_{{k,\,k{\plus}1}}^{{{\minus}1}} \} $$
Although the algorithm simulates new values of the allocations when proposing to move, it is not necessary to carry the allocations along. For between-model moves, we could replace the missing data formulation by noting that
 $${{p\,(z\mid w,\,k)} \over {p_{a} \,(z)}}L\,(D^{n} \mid\lambda ,\,z)=L\,(D^{n} \mid\lambda ,\,w)$$
4. Results
We now present some numerical results for this data set based on the model described in section 2.1, and the algorithms described in section 3.2.
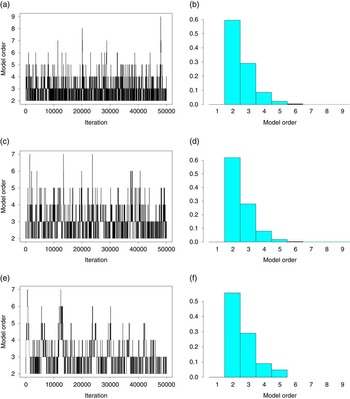
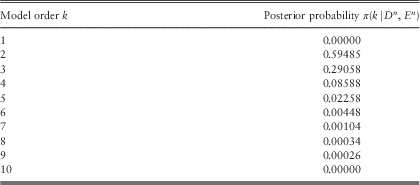
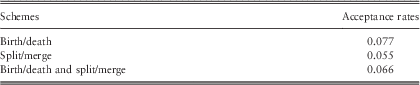
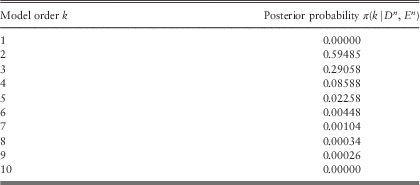
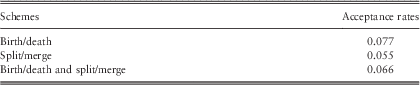
Table 1 shows the posterior model probabilities calculated from the reversible jump algorithm by counting the proportion of time that the algorithm visits each model. A plot of the number of components as the chain evolves is shown in Figure 3(a). The results clearly show that the number of components has a posterior mode at k=2. In addition, the model with k=1 component is never visited. Moreover, if the algorithm is started with k=1, then immediately it jumps to k=2, and never returns to k=1. As >88% of the posterior probability mass is placed on the models with two or three components, we discuss those models in detail in section 4.2. The between-model acceptance rates were 7.7% and 5.5% for the birth/death and split/merge moves, respectively. The total acceptance rate when there is equal probability of proposing a birth/death move or a split/merge move, is 6.6%. These results are tabulated in Table 2.
Left: Model trace indicator. Right: Histogram of posterior model order. (a) Birth/death and split/merge model trace. (b) Birth/death and split/merge histogram. (c) Birth/death model trace. (d) Birth/death histogram. (e) Split/merge model trace. (f) Split/merge histogram.

Posterior model order.
Acceptance rates.
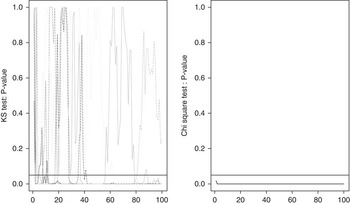
To assess convergence of the algorithm, we simulated four chains using different starting values and different random number seeds for a total of 100,000 iterations. Both the χ 2 and Kolmogorov–Smirnov diagnostics are computed. These diagnostics are plotted in Figure 4.
Convergence diagnostics. KS, Kolmogorov–Smirnov.

4.1. Comparing the model move schemes
A comparison of the individual acceptance probabilities shows that the between-model moves are accepted with a larger rate for the birth/death scheme compared with the split/merge scheme. This might not always be true, as other split/merge schemes may be proposed (Viallefont et al., Reference Viallefont, Richardson and Green2002). However, it is interesting to note that although the birth and death rates are higher than the split and merge rates, the combined scheme seems to mix better than either scheme implemented alone. Although the birth and death scheme has a higher acceptance rate for between-model moves, the excursions away from the values of highest posterior density, k=2 and k=3, are longer than for the combined scheme or the split and merge scheme. This is because when proposing parameters independently from the prior, areas of low probability can be proposed, whereas with the split and merge scheme, areas of low probability mass will generally be rejected. Based on the results presented, the birth/death method would be the preferred algorithm.
4.2. Detailed results for k=2 and k=3
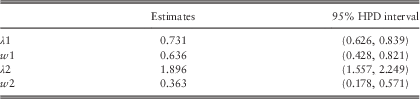
Recall the missing data formulation introduced in section 2.1 for the number of components conditional on k=2. We observed the posterior distribution of z at each iteration when k=2. A study of values of z will tell us how the data have been allocated to the components and therefore, which data points have been generated from either the first Poisson distribution or the second Poisson distribution. This information, along with further information from the portfolio, will help insurance companies classify groups of life insurance portfolios. The parameter estimates are shown in Table 3.
Parameter estimates conditional on k=2.
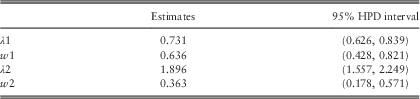
Note: HPD, highest posterior density.
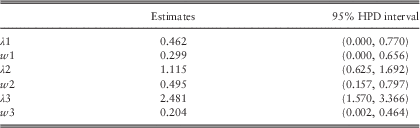
Similar results for the posterior parameter estimates, conditional on there being three components in the mixture, are given in Table 4.
Parameter estimates conditional on k=3.
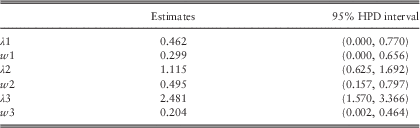
Note: HPD, highest posterior density.
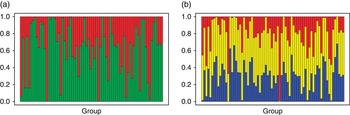
Figure 5 shows the posterior probability of each data point being allocated to a particular component of the mixture, conditional on k=2 and k=3, respectively.
Probability (vertical axis) of data from group i (horizontal axis) being assigned to individual components conditional on k=2 (a) and k=3 (b).

5. Conclusion
We present a model for heterogeneity in Group Life insurance by proposing a Poisson mixture model for count data to determine the number of groups in a portfolio consisting of claim numbers or deaths. We take a non-parametric Bayesian approach to modelling this Poisson mixture distribution using a Dirichlet process prior and use RJMCMC to estimate the number of components in the mixture. We show that a mixture with two or three components works best, in that they result in the highest posterior probabilities for parameters. In particular, 88% of the posterior probability is assigned to models with two or three components, and 11% to models with four or five components, whereas models with one component are never visited. In contrast to Haastrup (Reference Haastrup2000), we show that the assumption of identical heterogeneity for all groups may not be valid. In this case, it is necessary to put similar groups together for further analysis.
We contribute to the actuarial literature by showing how to account for both model uncertainty and parameter estimation within a single framework. This research can be extended to the case where claims are grouped, such as in Walhin & Paris (Reference Walhin and Paris1999, Reference Walhin and Paris2000).
There are two main advantages of our model. First, it allows us to use the data to estimate the number of groups within observed count data. This is much better than a priori assuming a fixed number of groups. Our example confirms the absence of heterogeneity by proving that two or three components are much more likely than assuming a single heterogeneous group. The second advantage of our model is that it allows ratemaking and further risk calculations to be done for each group.
Acknowledgement
The authors sincerely thank the two anonymous referees for their comments and suggestions which greatly helped to improve the manuscript.