INTRODUCTION
The Pleistocene record of subalpine and alpine vertebrate communities is generally poorly known in North America, and especially in the southern Rocky Mountains, owing to a paucity of sites with well-preserved faunas, with the rare exceptions of Porcupine Cave (Barnosky, Reference Barnosky2004; Barnosky et al., Reference Barnosky, Bell, Emslie, Goodwin, Mead, Repenning, Scott and Shabel2004) and the Ziegler Reservoir site (Snowmastodon; Pigati and Miller, Reference Pigati and Miller2014). The cold and wet conditions that characterize high elevations in this region are rarely conducive to the preservation of vertebrate remains, even when sedimentary deposits of the requisite age are present. Yet, vertebrates in such settings, especially small mammals, can be particularly sensitive to environmental perturbations (Rowe and Terry, Reference Rowe and Terry2014). A record of their history can potentially yield important insight into how individual taxa and broader communities responded over time to changing climates of the Pleistocene and Holocene, an understanding that also has the potential to provide information on the possible consequences of global warming and other human transformations of the landscape (Barnosky et al., Reference Barnosky, Bell, Emslie, Goodwin, Mead, Repenning, Scott and Shabel2004; Rowe and Terry, Reference Rowe and Terry2014).
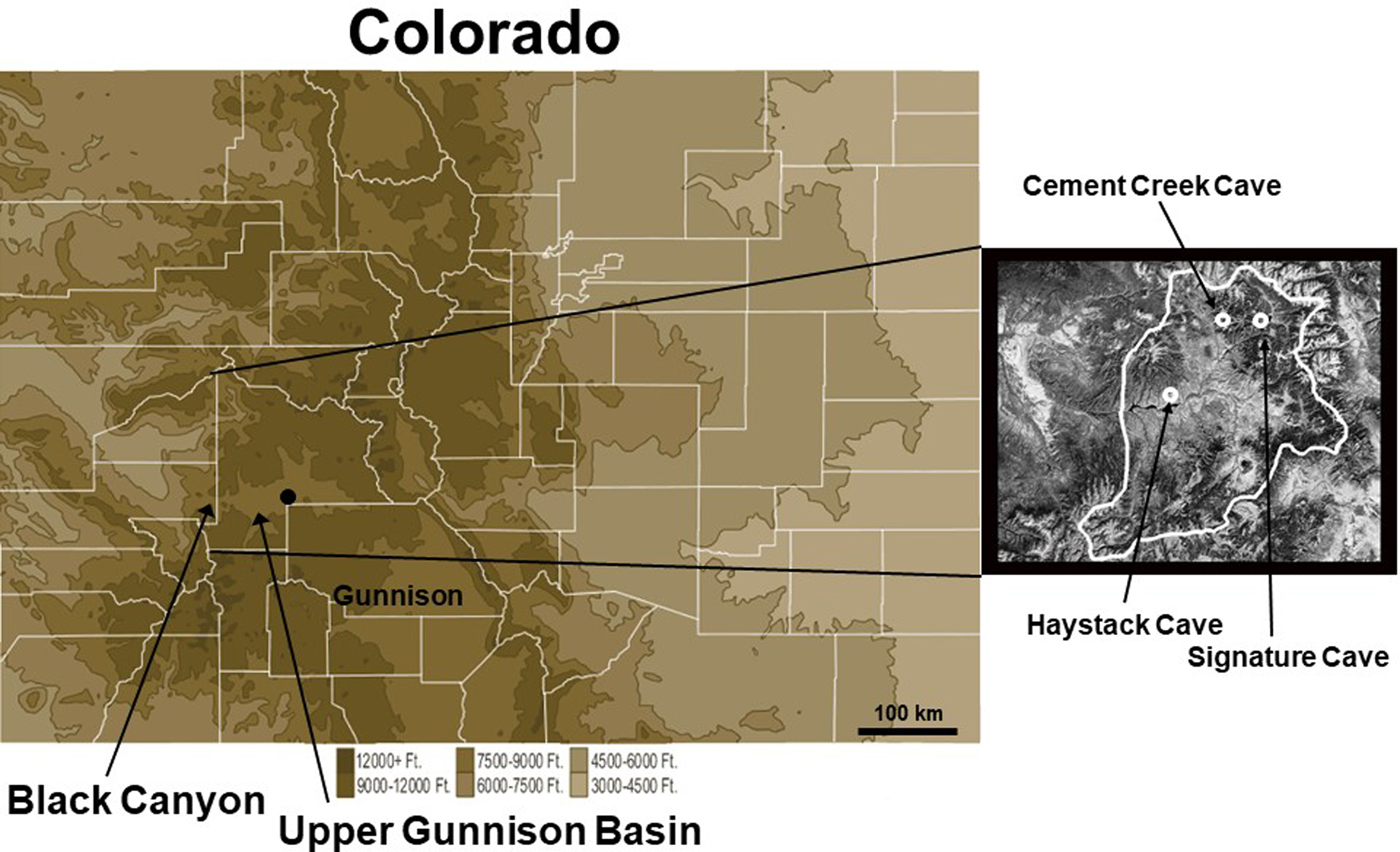
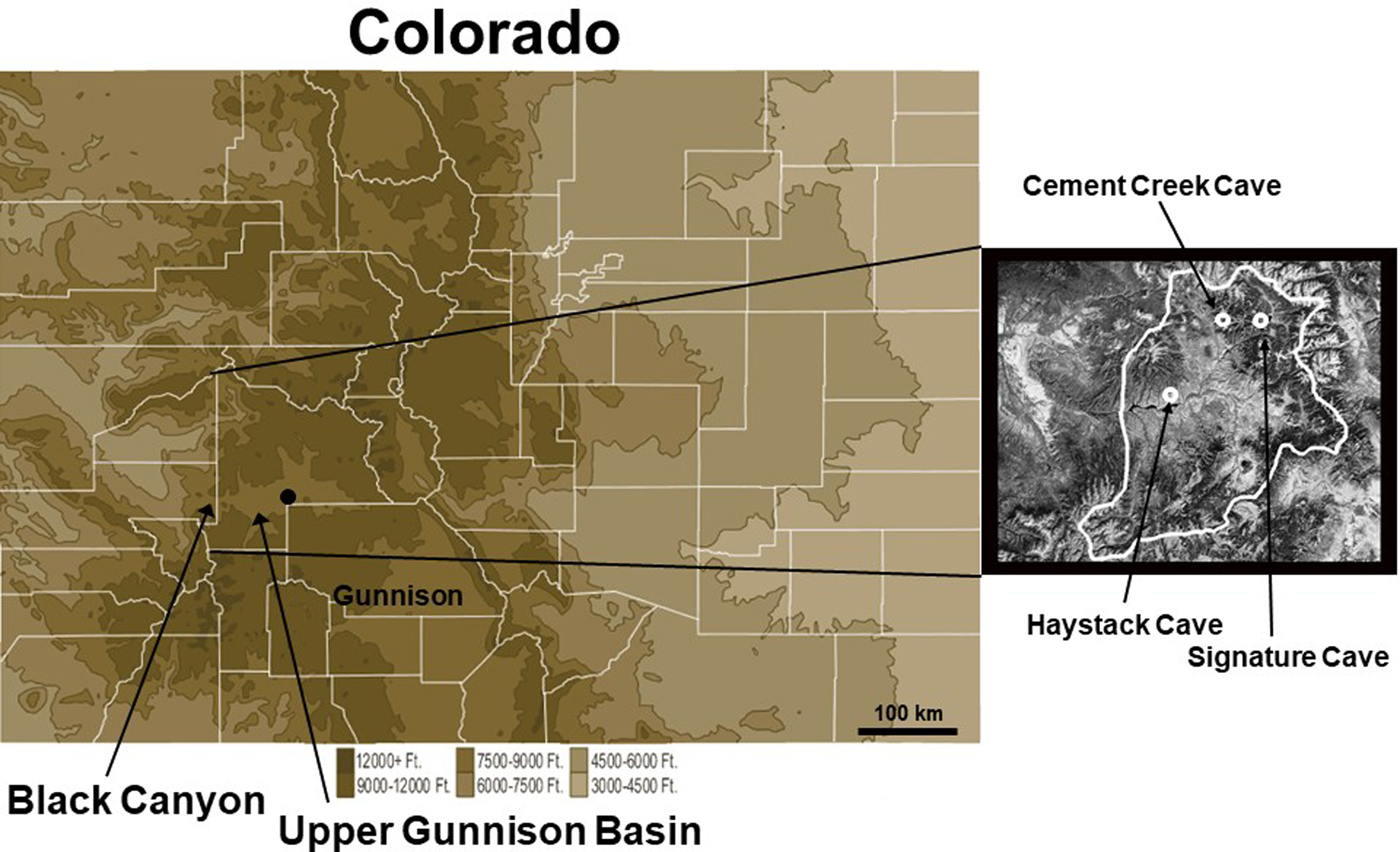
To develop a record of these vertebrate communities, we investigated three fossil-rich caves in the Upper Gunnison Basin (UGB) of southwestern Colorado (Fig. 1). These paleontological localities span a horizontal distance of 60 km and form an elevation transect from 2450 m above sea level (m asl) on the lower, presently xeric basin floor at Haystack Cave, to 2860 m asl at Cement Creek Cave and 3055 m asl at Signature Cave, both in the upper, cooler and wetter, reaches of the UGB. The remains recovered from these caves collectively span the period from the late Pleistocene to the Late Holocene and provide a more or less continuous ~40,000 yr record of vertebrate history—including of the communities that existed before and after the last glacial maximum (LGM).
(color online) Elevational map of Colorado (modified from https://geology.com) showing the location of the Upper Gunnison Basin where the city of Gunnison is located. The Black Canyon of the Gunnison is the only low-elevation exit from the basin on the west side. The detail to right shows the boundaries of the basin (bold white outline) and the locations of Haystack (elevation 2450 m), Cement Creek (2860 m), and Signature (3055 m) Caves.
Portions of the faunas from Haystack and Cement Creek Caves have been previously published. The fossil material from the initial excavation of Haystack Cave in 1978 was reported by Emslie (Reference Emslie1986), with selected taxa from subsequent excavations discussed by Nash (Reference Nash1987). Cement Creek Cave was first excavated in 1998, and the fossil shrews (Sorex spp.) from this site and Haystack Cave are reported in Emslie (Reference Emslie2002). Subsequent, more extensive excavations in Cement Creek Cave took place in 2007; isotopic analyses of its fossil yellow-bellied marmots (Marmota flaviventris) and bushy-tailed woodrats (Neotoma cinerea) are presented by McLean and Emslie (Reference McLean and Emslie2012), McLean et al. (Reference McLean, Ward, Polito and Emslie2014), and Reynard et al. (Reference Reynard, Meltzer, Emslie and Tuross2015). Signature Cave, excavated in 2008 and 2011, is reported here for the first time, along with a summary of vertebrate remains, including newly identified material, from all three caves.
These localities, supplemented by evidence from archaeological sites in the UGB (Stiger, Reference Stiger2001, Reference Stiger2006), have together yielded a diverse assemblage of almost 60 species of large and small mammals, including a variety of extinct and locally extirpated forms. Here, we use this evidence to examine species occurrence and abundance, turnover, community richness and evenness, and vertebrate resilience through time and at different elevations in the UGB.
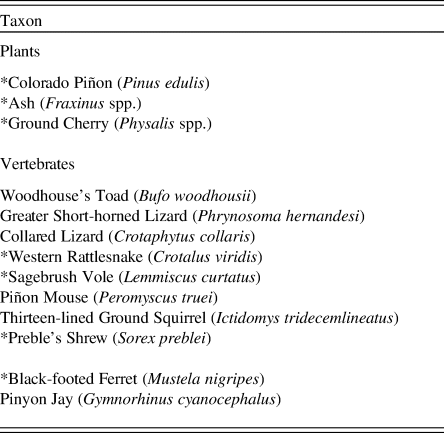
The vertebrate history of the UGB is principally, but not solely, a result of changes in climate and vegetation; topographic isolation also plays a significant role. A crescent-shaped range of high mountains nearly surrounds the UGB, and most passes through those mountains are at elevations of more than 3000 m asl. The only lower-elevation access to the UGB from adjacent regions is through the narrow gorge of the Black Canyon of the Gunnison, which includes a 20 km section that at its narrowest is more than 700 m deep and just 400 m across. As a consequence of its formidable topographic barriers, conspecifics of numerous plants and animals extirpated within the UGB since the Pleistocene have been unable to recolonize the basin (Table 1; Armstrong, Reference Armstrong1972; Stiger, Reference Stiger2001; Emslie et al., Reference Emslie, Coats and Oleksy2015).
Plant and animal taxa that should occur in the Upper Gunnison Basin, based on current environmental conditions, but are absent. An asterisk (*) denotes species that have been identified in either the fossil or archaeological record in the basin verifying their presence there in the past.
THE STUDY AREA
The physiography and ecology of the UGB have been described in detail elsewhere (Barrell, Reference Barrell1969; Stiger, Reference Stiger2001, Reference Stiger2006; Emslie et al., Reference Emslie, Coats and Oleksy2015; Reynard et al., Reference Reynard, Meltzer, Emslie and Tuross2015; Andrews et al., Reference Andrews, Meltzer and Stigerin press) and need only be summarized here. The UGB is a large (~11,000 km2), high-elevation basin that slopes westward from the western flank of the Continental Divide to the eastern edge of the Colorado Plateau (Fig. 1). Over that span, its elevation drops from ~4300 to ~2200 m asl. Owing to its elevation and surrounding mountains, the UGB has a cold, continental climate with an average annual temperature basin-wide of ~3.1°C, with temperatures declining steeply with increasing elevation (Fall, Reference Fall1997b; Andrews et al., Reference Andrews, Meltzer and Stigerin press). Yet, the floor of the UGB often experiences bitter winter temperatures as cold air sinks into the basin and is blocked from outflow by mountain barriers. In addition, and partly because of rain shadow effects, the UGB is drier than other Rocky Mountain regions at this elevation, with an annual average precipitation of ~25 cm on the basin floor, but which increases to twice that at higher elevations (Stiger, Reference Stiger2006; Andrews et al., Reference Andrews, Meltzer and Stigerin press). The region is within the North American monsoon system and receives approximately one-third of its precipitation in the late summer months (July to September); winter precipitation falls as snow, with both the absolute amount of snowfall and its relative proportion to overall annual precipitation increasing at higher elevations (Andrews et al., Reference Andrews, Meltzer and Stigerin press).
Gradients of temperature, moisture, and topography are responsible for the composition of modern UGB plant communities, which are bracketed by dual tree lines: a higher one (above ~3450 m asl), in which tree growth is limited by cold, and a lower tree line (~2750 m asl), in which the lack of moisture is the limiting factor (Fall, Reference Fall1997b). The modern vegetation gradient comprises alpine tundra at the highest elevations and steps down through a succession of forested zones, with considerable mixing among them depending on local microclimates. The modern mammalian fauna is composed of many species typical of southern Rocky Mountain environments, but likewise quite diverse as a result of the elevation gradient and the variety of forested and open habitats, wetlands, and streams that characterize the region.
Barrell (Reference Barrell1969) noted that tree species in the UGB follow predictable elevation gradients as in other Rocky Mountain regions, but the herbaceous vegetation do not: he observed numerous species considered to be more restricted to alpine tundra at lower elevations in the basin mixed with sagebrush (Artemisia spp.) steppe. He attributed this “floristic unity” to Pleistocene climates that caused species contractions and expansions from a core refuge zone in the center of the basin and hypothesized that remnants of this zone survive today, allowing alpine species to exist in the lower basin with sagebrush grassland habitat and vice versa. An alternate possibility is that these are relict patches of sagebrush steppe-tundra from when it was the dominant community in the late Pleistocene. These patches may still exist because of the relative lack of disturbance to basin habitats since historic times (see Supplementary Materials for description of UGB communities). Thus, the unique geography of the basin with its diversity of microclimates facilitates and maintains “unusual” plant associations (e.g., high- and low-elevation species). Both of these hypotheses remain to be tested in the basin with detailed botanical surveys that could be combined with microclimatic data to provide insight on these unusual plant associations. The vertebrate record presented here provides some support for these hypotheses.
THE LATE QUATERNARY IN THE UPPER GUNNISON BASIN
During the late Pleistocene, alpine glacial complexes were present on the northern (Elks and Sawatch Mountains) and southern margins (San Juan Mountains) of the UGB (Pierce, Reference Pierce, Gillespie, Porter and Atwater2003). In places, glacial ice reached thicknesses of >350 m (Brugger, Reference Brugger2006) and extended from >4000 m to near the basin floor (~2500 m) (Brugger, Reference Brugger2010). Glaciers reached their maximum extent ~21,000 cal yr BP, with recession beginning after ~17,000 cal yr BP (Brugger, Reference Brugger2006, Reference Brugger2007; Leonard et al., Reference Leonard, Laabs, Plummer, Kroner, Brugger, Spiess, Refsnider, Xia and Caffee2017).
Estimates of the local LGM temperature from the position and chronology of glacial ice under different models ranges from 5°C to 8°C cooler than present (Brugger, Reference Brugger2006, Reference Brugger2010; Leonard et al., Reference Leonard, Laabs, Plummer, Kroner, Brugger, Spiess, Refsnider, Xia and Caffee2017). The rate of post-LGM warming likewise varies, but based on patterns of ice retreat, it is estimated that the most rapid period of warming—perhaps by as much as 2.5°C—was in the ~2000 yr after ~16,000 cal yr BP (Leonard et al., Reference Leonard, Laabs, Plummer, Kroner, Brugger, Spiess, Refsnider, Xia and Caffee2017). Comparable temperature ranges are indicated in palynological analyses (Fall, Reference Fall1997b; Briles et al., Reference Briles, Whitlock and Meltzer2012), which also provide evidence of a downward shift in the elevation of the upper tree line by as much as 700 m (Markgraf and Scott, Reference Markgraf and Scott1981; Fall, Reference Fall1997b; Briles et al., Reference Briles, Whitlock and Meltzer2012).
During the subsequent Bølling-Allerød period (14,700–12,900 cal yr BP), summer insolation rose steadily (Berger and Loutre, Reference Berger and Loutre1991; data for 40°N latitude), and there was a sharp rise in the pollen of arboreal species, such as those of Picea, Abies, and especially Pinus, as well as a steady decline in Artemisia (Briles et al., Reference Briles, Whitlock and Meltzer2012). After 14,700 cal yr BP, the upper tree line in the form of subalpine forest moved upslope and replaced tundra and parkland (Fall, Reference Fall1997b; Jimenez-Moreno et al., Reference Jimenez-Moreno, Fawcett and Anderson2008; Briles et al., Reference Briles, Whitlock and Meltzer2012).
There was a return to cooler climate during the Younger Dryas chronozone (YDC), marked by an annual temperature decrease of as much 4–5°C (Fall, Reference Fall1997b). There is no evidence of glacial readvance during the YDC (Brugger, K.A., personal communication, Reference Brugger2010), but there was significant change in vegetation, indicated by a decrease in pine and an increase (and subsequent decline) in Picea and Abies (Briles et al., Reference Briles, Whitlock and Meltzer2012). The rise in Abies suggests cooler temperatures year-round, but also increased winter precipitation in the form of snow, as Abies requires a deep winter snow pack (Fall, Reference Fall1997b). Evidence from high-elevation localities shows a return of tundra vegetation and a downslope expansion of subalpine forest, indicating a lowering of the upper and lower tree lines (Fall, Reference Fall1997b; Briles et al., Reference Briles, Whitlock and Meltzer2012).
Ultimately, however, the most significant changes in climate and biota in the UGB occurred in the Early to Middle Holocene, when incoming solar radiation peaked, summer temperature increased, and effective precipitation decreased. As a result, biotic communities changed: the upper tree line shifted upslope to perhaps 270 m higher than today (Fall, Reference Fall1997b), the forest composition changed to include more temperate taxa, and fire activity increased from previous levels (Fall, Reference Fall1997a; Jimenez-Moreno et al., Reference Jimenez-Moreno, Fawcett and Anderson2008; Briles et al., Reference Briles, Whitlock and Meltzer2012). By inference, on the floor of the UGB there was an increase in xerophytic species, but unusual mixtures of alpine species in the lower basin have been noted (Barrell, Reference Barrell1969). Beginning ~4500 cal yr BP, a cooling period caused a lowering of upper timberline by 100–200 m and a gradual drop in effective moisture (Markgraf and Scott, Reference Markgraf and Scott1981; Fall, Reference Fall1985, Reference Fall1997b; Short, S.K., unpublished report, 1986). Late Holocene woodrat middens indicate a forested environment in the lower elevations of the UGB, where open sagebrush grassland predominates today (Emslie et al., Reference Emslie, Stiger and Wambach2005). After 2000 cal yr BP, modern climatic conditions and vegetation communities became established in the UGB and have remained essentially unchanged since that time.
At present, Haystack Cave is situated in sagebrush shrub below the tree line; Cement Creek Cave and Signature Cave are at higher elevations within relatively open subalpine woodlands. The excavation history, stratigraphy, and taphonomy of these caves and their fossil assemblages are described below. These faunas supplement previous work on high-elevation middle Pleistocene faunas from montane regions surrounding the UGB (Barnosky, Reference Barnosky2004; Sertich et al., Reference Sertich, Stucky, McDonald, Newton, Fisher, Scott, Demboski, Lucking, McHorse and Davis2014).
CAVE DESCRIPTIONS
Detailed information on the history and methods of excavations for each of the three caves is provided in the Supplementary Materials. Here, we focus on general descriptive information for each, as well as data on their stratigraphy, age, and taphonomy. All radiocarbon ages (14C yr BP) from the caves were calibrated using OxCal v4.3 (Bronk Ramsey, Reference Bronk Ramsey2009) and the IntCal13 calibration curve (Reimer et al., Reference Reimer, Bard, Bayliss, Beck, Blackwell, Ramsey and Buck2013). This calibration generated 2σ ranges and a mean (μ) in cal yr BP for all radiocarbon ages that have been completed on the three caves discussed below (see Tables 2–4). We refer only to mean ages in cal yr BP.
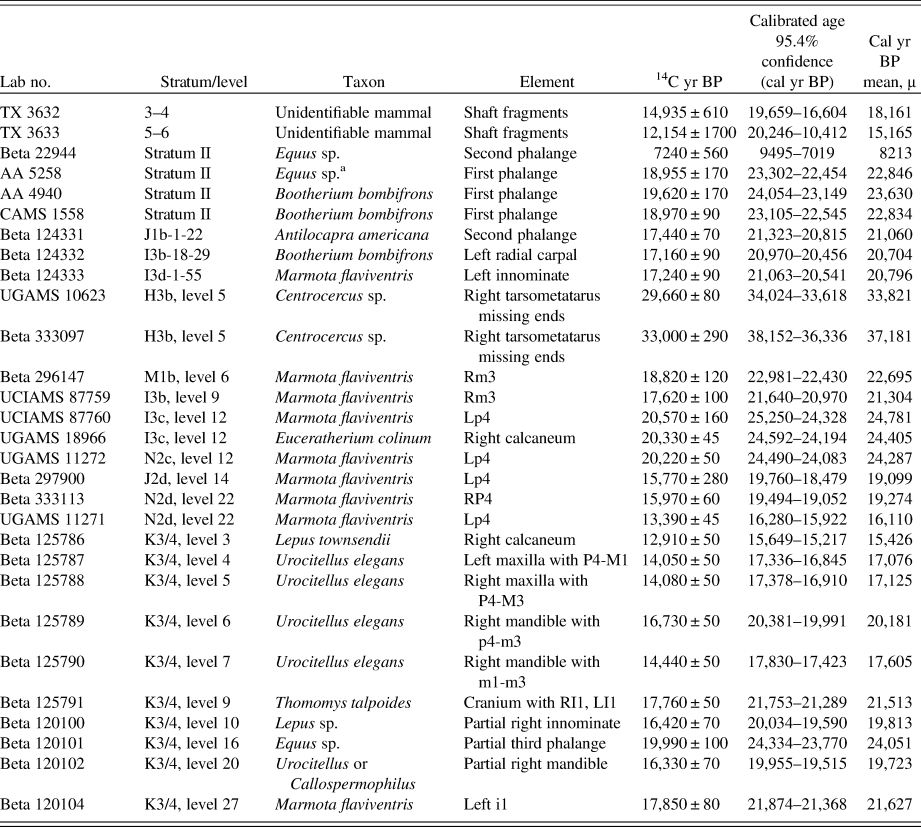
Radiocarbon ages (n = 29) completed on fossil vertebrates from Haystack Cave with lab number, stratum and/or level, taxon, and material dated. The first two ages were reported by Emslie (Reference Emslie1986) from levels excavated by Euler and Stiger (Reference Euler and Stiger1981); the ages from stratum II were reported by Nash (Reference Nash2000) and include one of Equus sp. (AA 5258) mistakenly referred to Bootherium in that report. Two other ages are from the same bone (first phalange) of Bootherium. All other specimens are sited from the grid system established by Nash (Reference Nash2000; Fig. 3); specimens from grid K3/4 are from levels excavated by Emslie in 1998 (Supplementary Materials). The two ages on Centrocercus sp. are from the same specimen. All ages on marmot (Marmota flaviventris) teeth were completed by McLean et al. (Reference McLean, Ward, Polito and Emslie2014). Radiocarbon ages calibrated with OxCal v. 4.3 using IntCal13 calibration curve (Reimer et al., Reference Reimer, Bard, Bayliss, Beck, Blackwell, Ramsey and Buck2013).

a This specimen was incorrectly referred to Bootherium by Nash (Reference Nash2000).
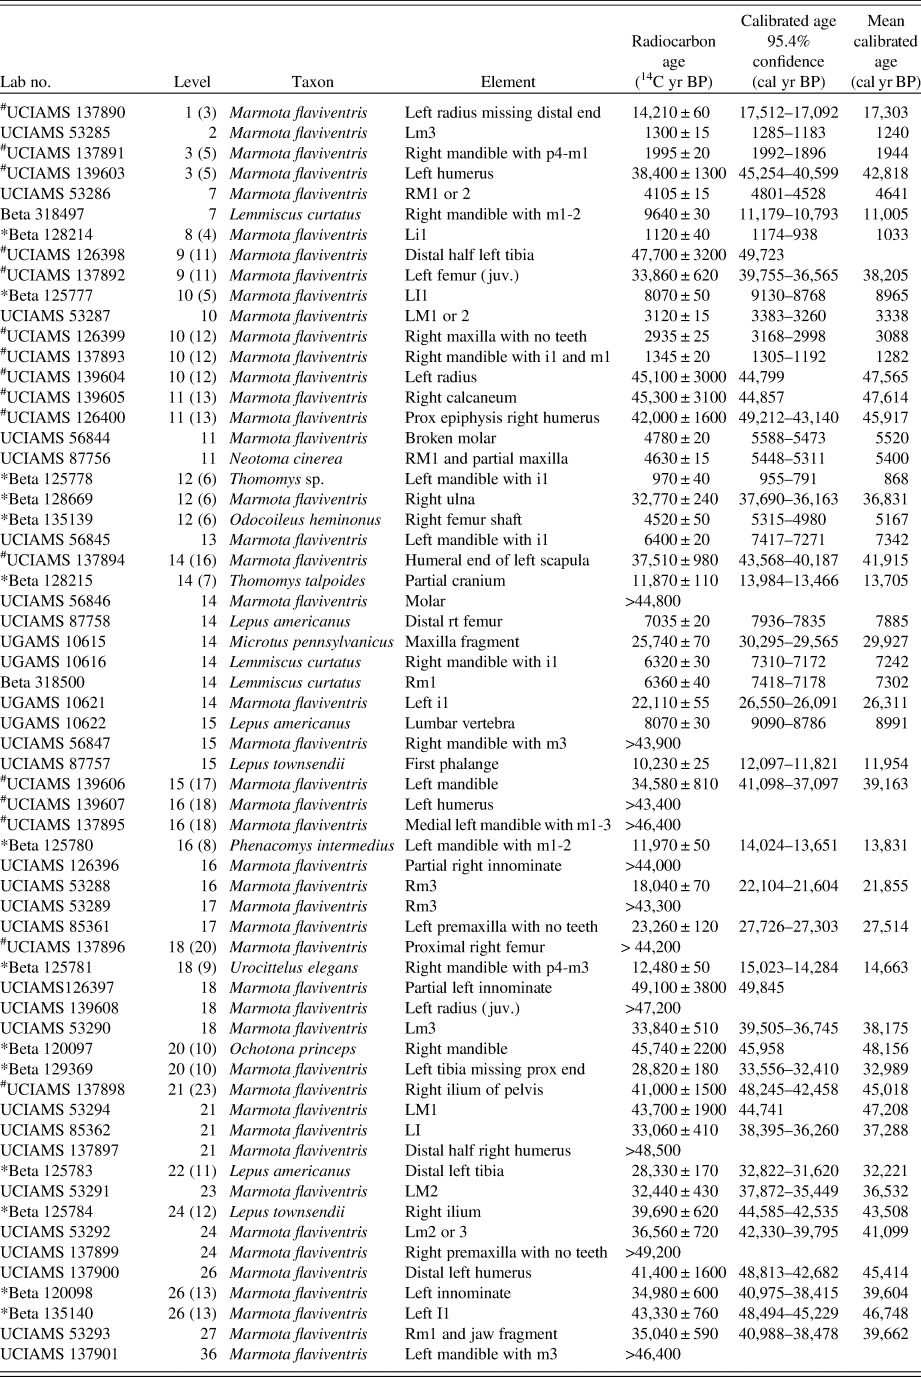
Radiocarbon ages (n = 62) completed on fossil vertebrates from Cement Creek Cave with lab number, stratum and/or level, taxon, and material dated. Lab number refers to ages completed by the University of California, Irvine, Accelerator Mass Spectrometer (UCIAMS), Beta Analytic Inc. (Beta), and the University of Georgia Accelerator Mass Spectrometer (UGAMS). Fourteen ages from TP1 (test pit 1) excavated in 1998 are indicated by an asterisk (*); 16 TP2 (test pit 2) ages are indicated with a pound sign (#). All other ages are from TP2 NE (test pit 2, northeast). For each age excavation level is given, and, in the case of TP1 and TP2, the corresponding level with TP2 NE is given with the original level from those pits in parentheses. For elements, teeth are indicated by L or R for left or right, and lower or upper case m (molar), p (premolar), or i (incisor) for lower or upper teeth, respectively. Radiocarbon ages calibrated with OxCal v. 4.3 using IntCal13 calibration curve (Reimer et al., Reference Reimer, Bard, Bayliss, Beck, Blackwell, Ramsey and Buck2013).

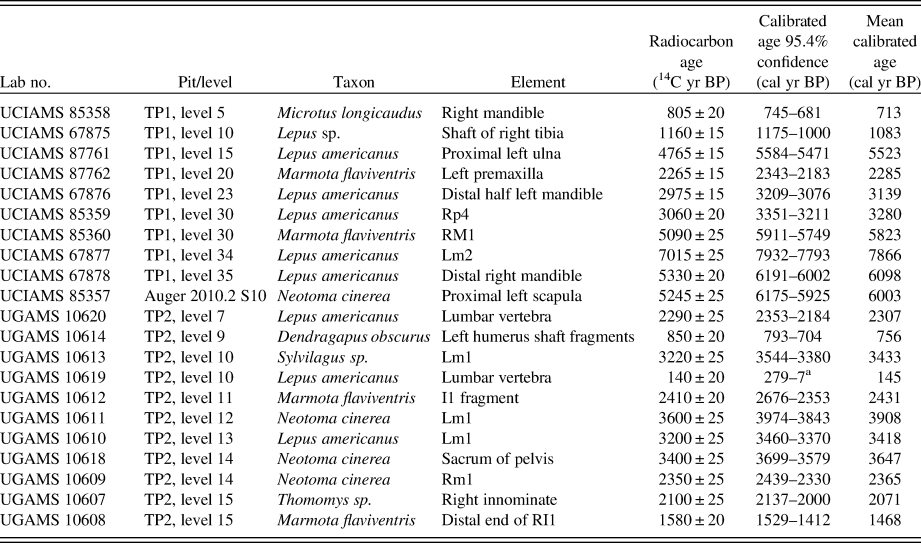
Radiocarbon ages (n = 21) from TP1 (test pit 1) and TP2 (test pit 2) at Signature Cave giving lab number, level, taxon, and material dated. Radiocarbon ages calibrated with OxCal v. 4.3 using IntCal13 calibration curve (Reimer et al., Reference Reimer, Bard, Bayliss, Beck, Blackwell, Ramsey and Buck2013).

a Calibrated age may extend out of range.
Haystack Cave
Haystack Cave (2450 m asl) is located in the dry lower, central part of the UGB, ~150 m above the Gunnison River. This rich late Pleistocene vertebrate locality has been excavated on three separate occasions since 1978. The cave is situated on the rimrock of Sapinero Mesa, inset in Fish Canyon welded ash-flow tuff (Cenozoic, Oligocene) that formed approximately 30 Ma (Prather, Reference Prather1982). The cave is tube shaped, approximately 2.3 m in diameter and 12 m long. The back of the cave tapers to a diameter of only about 1 m, where it then angles downward into a small crawlway for another 8–10 m before ending. Although the cave has been referred to as a lava tube that formed quickly in a molten rock stream, it is instead likely a result of weathering and erosion in the welded tuff—and perhaps the only known cave of this type in Colorado (Medville, Reference Medville1998). Because welded tuff is largely impermeable to water, the interior of the cave has remained dry for thousands of years, allowing for the excellent preservation of vertebrate fossils, plant remains, and archaeological materials.
The present environment surrounding Haystack Cave is a typical dry, interior basin habitat with sagebrush (Artemisia tridentata) as the dominant plant species. Gambel's oak (Quercus gambellii) and juniper (Juniperus scopulorum) occur in isolated pockets near the cave. Various other shrubs, grasses, and cactus (Opuntia spp.) also occur in the area (Emslie, Reference Emslie2002). This community typifies the lower portion of the UGB at elevations between approximately 2200 and 2600 m asl (Barrell, Reference Barrell1969).
Stratigraphy and age
Euler and Stiger (Reference Euler and Stiger1981) first published a stratigraphic section of the cave. This section, taken from their two 1 x 1 m excavation pits, indicated that most of the deposits consisted of unstratified light brown sediments and roof spalls to a depth of 1.5 m. The top 30 cm contained darker sediments and rodent fecal deposits that were considered modern in age. These initial excavations also revealed that most of the deposits are dry, uncompacted sediments and dust with thousands of rock spalls (which easily collapsed into the test pit and hindered excavations).
Excavations in 1986/1987 were more extensive, and, although the sediments continued to be dominated by loose dust and rock spall, additional stratigraphic zones were identified. Nash's (Reference Nash1987) sediment analysis determined that the deposits are composed of organics, weathered material from the surrounding bedrock, and windblown sediment. He also identified five stratigraphic units, designated strata I–V from the bottom to the top of the cave sediments. These strata occurred within 1.8 m of deposits, differentiated primarily by the amount of organics found within them as well as rock debris and bioturbation. Stratum II was the most extensive, up to 112 cm thick and composed of fine reddish-brown sandy loam (Nash, Reference Nash2000).
Altogether, there are 29 radiocarbon ages (Table 2) on vertebrates from the cave, along with half a dozen radiocarbon ages on charcoal (most of the charcoal is from upper levels and is Holocene in age ranging from modern to 3160 ± 60 14C yr BP; Nash, Reference Nash2000). All of the vertebrate ages are younger than ~25,000 cal yr BP, except for two ages on the same specimen of Centrocercus sp. (Table 2). Most of the vertebrate ages fall within the time range of ~24,780–15,165 cal yr BP, except for one on an Equus phalange that was considered invalid by Nash (Reference Nash2000) because of use of a pretreatment method (NaOH extraction) that did not remove all humate contaminants. This period of time may be one of increased accessibility and use of the cave by a variety of vertebrate species. This depositional activity correlates with the LGM and the warming trend that followed over the next several millennia. Only one bone, identified as sage grouse (Centrocercus sp.), produced an older age at 37,181 cal yr BP (Table 2). Because the age on this specimen was much older than all other specimens from the cave, a second age was obtained on this bone using a different radiocarbon lab but produced a similar result (33,821 cal yr BP; Table 2). Thus, the age of this bone suggests that older, pre-LGM deposits remain in the cave but apparently are very limited or relict.
Taphonomy
The radiocarbon evidence suggests that the period of greatest mammalian activity within Haystack Cave took place during the LGM, at a time when sediments were accumulating within the cave, ultimately leading to more than 1 m of deposition. It was during this period that open sagebrush (Artemisia spp.) steppe, grassland, and small stands of mixed conifer forest appear to have dominated the environment surrounding the cave. Data for these interpretations, first presented by Emslie (Reference Emslie1986), include the presence of vertebrate taxa that are restricted to these environments today (e.g., Lagopus sp., Ochotona princeps, Urocitellus elegans, Thomomys talpoides, Lemmiscus curtatus, and Phenacomys intermedius). In addition, other taxa from these dated sediments include those found only in open grassland and/or tundra environments (cf. Miracinonyx trumani, Antilocapra americana, and Equus sp.). Assuming all or most of these species inhabited the basin at the same time, this assemblage reflects a nonanalog, mixed community of open sagebrush grassland and alpine tundra during the late Pleistocene referred to as sagebrush steppe-tundra. Pollen analyses by Scott (Reference Scott, Euler and Stiger1981) also indicated that sagebrush dominated the plant community at Haystack Cave, along with composites, Chenopodiaceae-Amaranthus, and other nonarboreal species.
Rapid sedimentation in the cave during the late Pleistocene may have been caused largely by physical factors, principally freeze/thaw and exfoliation of the cave roof and walls (large amounts of rock spalls were removed during excavations). The rich collection of fossil material nonetheless indicates that the cave was heavily used by a variety of vertebrate species throughout this interval. This use appears to have been primarily by rodents, especially woodrats (Neotoma sp.) and ground squirrels (Urocitellus and Callospermophilus sp.). Even during excavations, old and new burrows of golden-mantled ground squirrels (C. lateralis) were frequently encountered, and live individuals were observed in the cave on numerous occasions. The abundance of marmot bones in the deposits suggests that this species also frequented the cave and may have used it for hibernation as well as a nest site. No marmots have been seen near the cave today but do occur in rocky talus in other low-elevation areas in the UGB.
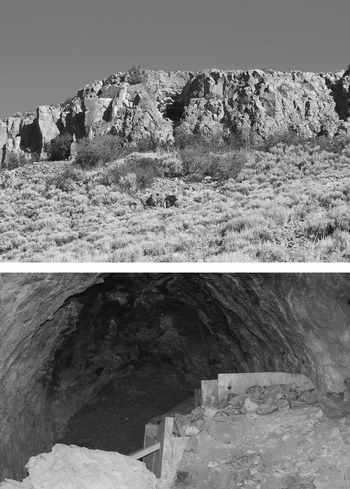
Most larger vertebrates would have been unable to access the cave, as the entrance is gained only after scaling a 5–6 m vertical face with limited access from the mesa top above (Fig. 2). Just small vertebrates (woodrats and ground squirrels), agile felids, or larger, cliff-dwelling species (bighorn sheep [Ovis canadensis]) could easily reach the cave entrance, and it appears this limited access has characterized the cave since the late Pleistocene. Large carnivore remains in the cave are limited to one or a few bones each of coyote (Canis latrans), red fox (Vulpes vulpes), black bear (Ursus americanus), extinct cheetah (cf. Miracinonyx trumani), and several mustelids (see Emslie, Reference Emslie1986; Supplementary Materials). Unlike carnivore dens, where predator remains (including juveniles) and those of their prey are plentiful (e.g., Emslie and Morgan, Reference Emslie, Morgan, Steadman and Mead1995), the small number of carnivore fossils at Haystack Cave indicates it was not a denning site for any of these species. Given the nature of the accumulated specimens, it is likely that rodents, especially marmots, ground squirrels, and woodrats, as well as some small carnivores (e.g., felids, canids, and mustelids) and perhaps raptorial birds, were the major agents accumulating bone and plant remains in the cave since the late Pleistocene. As such, most of the fauna in the cave primarily represents the local environment and lower UGB species and habitats at the time of deposition in the late Pleistocene. Use of the cave appears to have declined considerably during the Holocene.
Top: View of Haystack Cave in the Sapinero Mesa Tuff. Note the 5–6 m vertical cliff below the entrance and limited access from above. Bottom: Haystack Cave stabilization, completed in 1998, as viewed on September 23, 2014, showing the location of the plywood support against intact (unexcavated) cave sediments along the east (right) side of the cave. Solidified spray insulation foam is located between the plywood and the plastic sheeting covering the intact sediments. The cave was visited again on August 2, 2018, and remains essentially unchanged after 20 yr.

Cement Creek Cave
Cement Creek Cave (2860 m asl) is a multichambered solution cavity in Leadville limestone (Paleozoic, Middle Mississippian age) located just south of Crested Butte, Colorado (Fig. 1). Although the cave is situated just over ~6 km from the terminal lobes of the glaciers that came down the Slate and East River valleys to the north, there is no evidence the Cement Creek drainage itself was glaciated.
The environment surrounding Cement Creek Cave has been described as dominated by a mixture of pine and spruce forest (Picea engelmannii and P. pungens), with Douglas fir (Pseudotsuga menziesii), juniper, and quaking aspen (Populus tremuloides) also present. The slopes below and near the cave have sagebrush and various shrubs, grasses, and flowering plants that typify subalpine mountain regions at this elevation (Emslie, Reference Emslie2002).
The cave has been well known to locals and spelunkers for many years, as the limestone cliff in which it occurs is clearly visible from major roads and is one of several in this formation that has been surveyed and mapped (Medville, Reference Medville1994). Designated as Cave #3 in Medville (Reference Medville1994), it has extensive chambers and sediment deposits. It is relatively easy to access by a small (~1 m diameter) opening on a vertical face approximately 3–4 m above current ground level. Heavy visitation to this cave over the years has had many adverse impacts, including disturbance to cave sediments, removal of speleothems, accumulation of litter, and considerable graffiti spray painted on cave walls. However, these actions had little impact to the area in which we excavated.
Stratigraphy and age
The fossil assemblage from Cement Creek was obtained in two separate excavations. The 1998 excavations of a 50 x 50 cm test pit (TP1; see Supplementary Materials for excavation details) yielded abundant small mammal remains including well-preserved and complete jaws of shrews, voles (Arvicolinae), and ground squirrels (Emslie, Reference Emslie2002). Fourteen radiocarbon ages were obtained on rodent and rabbit (Leporidae) bones from levels 4 through 13 (Table 3). These ranged in age from 1033 cal yr BP (level 4) to 46,748 cal yr BP (level 13; Emslie, Reference Emslie2002). Although some mixing was indicated by the radiocarbon chronology at levels 5/6 and 12/13, this initial test produced the first vertebrate assemblage in Colorado that dated before and after the LGM (Mickelson et al., Reference Mickelson, Clayton, Fullerton, Borns and Porter1983; Dawson, Reference Dawson1992).
The 2007 excavations, which comprised a 1 x 1 m unit (test pit 2 [TP2]) and then an adjoining 50 x 50 cm extension to the northeast (TP2 NE), added new information on the age and stratigraphy of the deposits (see Supplementary Materials). A stratigraphic profile of TP2 NE indicates that the deposits consist of dry to moist and degraded woodrat midden in the top 60 cm (levels 1–12) and cave sediments and rock spalls in the lower deposits (levels 13–40) that abruptly change from dark to light brown in color with depth. Undisturbed portions of the upper levels are rich in macrobotanical remains (sticks, leaves, needles, and pine cones) and bones and date to the Late Holocene. The lower sediments are significantly older and are rich in vertebrate fossils, especially small mammals. A small number of bones of larger mammals (artiodactyls), birds, and reptiles also were recovered.
Two thin travertine layers exposed in these new excavations indicate distinct breaks in cave sedimentation in the Pleistocene. The upper travertine layer is at a depth of ~115 cm below the surface (at levels 17/18) and near the bottom of the 1998 test pit dated at 46,748 cal yr BP. The lower travertine layer is at a depth of 1.6 m (at levels 27/28). These travertine layers probably formed during a period of quiescence in cave deposition and as a result of moisture flow through the cave from which calcium carbonates precipitated. However, uranium series ages on speleothem fragments from levels below the upper travertine layer produced ages of 220,720 ± 2773 and 240,963 ± 3799 13C yr BP, which are much older than radiocarbon ages on bone found below these layers. Attempts to bracket the age of the travertine layers by dating bones from above and below each layer failed for lack of sufficient collagen. Why the travertine layers yielded such significantly older ages is unclear, though contamination is a likely cause, and was suspected when the samples were closely examined during the laboratory pretreatment process (Wang, X., personal communication, 2009).
A total of 45 radiocarbon ages were obtained on fossil material collected in the 2007 excavations (16 from TP2 and 32 from TP2 NE; Table 3 and Fig. 3). As TP2 NE yielded more ages and the most intact stratigraphic sequence, the levels from TP1 and TP2 were aligned with those of TP2 NE to create a composite dated section (Table 3).
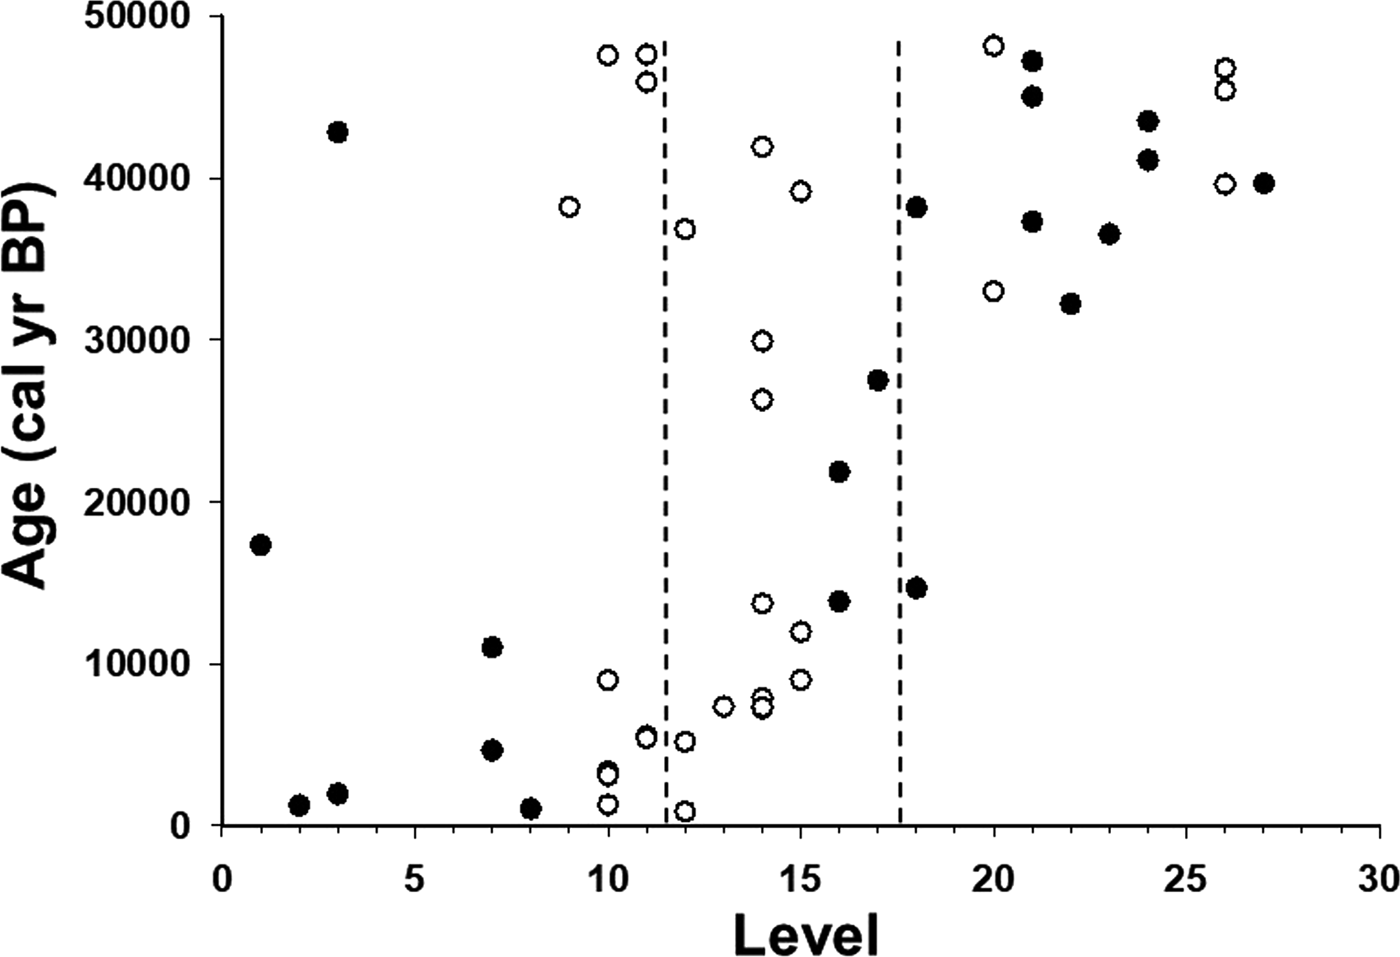
Calibrated radiocarbon ages (cal yr BP) from Cement Creek Cave (n = 50) plotted in correspondence to levels in TP2 NE (test pit 2, northeast) (see Table 3; ages beyond the calibration curve are not plotted here). Numerous specimens with older ages have been mixed into the upper levels because of rodent and human disturbances to those levels. Ages indicated by an open circle are from those levels used in analyses of richness and evenness. Vertical dashed lines are at levels where upper disturbed levels changed to a lighter-brown fossiliferous deposit (levels 11/12) and where a thin travertine layer was encountered, indicating a hiatus in deposition at levels 17/18 (see Supplementary Materials for stratigraphic profile of TP2 NE). A second travertine layer at level 30 is not indicated on this plot.

Overall, 62 radiocarbon ages have been obtained from Cement Creek Cave and range from the Late Holocene to well before the LGM (Table 3). The deepest levels of the section (below level 30) appear to be beyond the range of radiocarbon dating (McLean and Emslie, Reference McLean and Emslie2012). A plot of the 50 radiocarbon ages that could be calibrated reveals that considerable mixing has occurred in the cave, especially in the upper levels (Fig. 3). Many older bones have been moved upward, probably by burrowing rodents (old and new burrows were observed during excavations) and/or spelunkers who may have dug into these levels to unclog the crawlway into the back chambers of the cave. Only those deposits below the upper travertine layer (levels 18–40) appear to be relatively undisturbed; the bones within them generally return pre-LGM radiocarbon ages, or ages that are at or past the limits of radiocarbon dating.
Because the TP2 NE stratigraphic section was the least disturbed by rodent activity and provided a continuous sequence of deposition from the youngest to oldest (deepest) levels in the cave (levels 1–40), we identified all fossil material in 13 of the levels (levels 5, 9–15, 20, 26, 30, 35, and 40). Given the abundance of remains, we could not sample every level, so we chose every fifth level for analysis, except for levels 9–15, which cross the Pleistocene-Holocene boundary (Table 3 and Fig. 3; inadvertent mixing of fossils during screen washing prevented use of level 25; level 26 was used instead). These detailed data were generated to assess changes in the small mammal community over the past 40,000+ yr, as discussed below.
Taphonomy
Organic deposits in Cement Creek Cave, at least in the upper levels, appear to have accumulated largely through woodrat activity. The top 60 cm of the deposits is degraded midden of decomposing plant debris; modern woodrat middens are also present in and near the cave as their activities continue to this day. Besides woodrats, access to the cave was limited to all but small cliff-dwelling species. Large mammals could not access this cave. Their bones also are relatively rare in the deposits and consist mainly of fragmented long bones or whole vertebrae, partial mandibles with teeth, phalanges, tarsals, and carpals (see Supplementary Materials), all of which are within the size range that could have been carried by woodrats to their nests. One complete tibia of a black bear was recovered and is the largest fossil of a large mammal from the excavations. It has some gnaw damage and one canine puncture mark (9 x 7 mm), the size of a puma (Puma concolor) or wolf (Canis lupus) canine, on the proximal lateral side of the tibial tuberosity. This bone is the only evidence of a large carnivore in the cave.
Most of the thousands of bones in the lower deposits, though, are of small mammals including insectivores, lagomorphs, and rodents. Unlike an owl (Strigiformes) pellet deposit, where small mammal and bird bones (including crania) are preserved whole or intact, the bones in Cement Creek Cave are highly fragmented. Although owl pellets could easily have been deposited at the front of the cave by roosting birds, and carried farther into the cave by woodrats, it does not seem likely that the majority of bones were deposited in this manner. No pellets or partial pellets were found in the upper deposits or on the surface where our excavations took place, nor have any pellets been observed on the surface at the front of the cave. Instead, the high degree of bone fragmentation could have been caused by small carnivores such as weasels (Mustela spp.) that may have used the cave as a den.
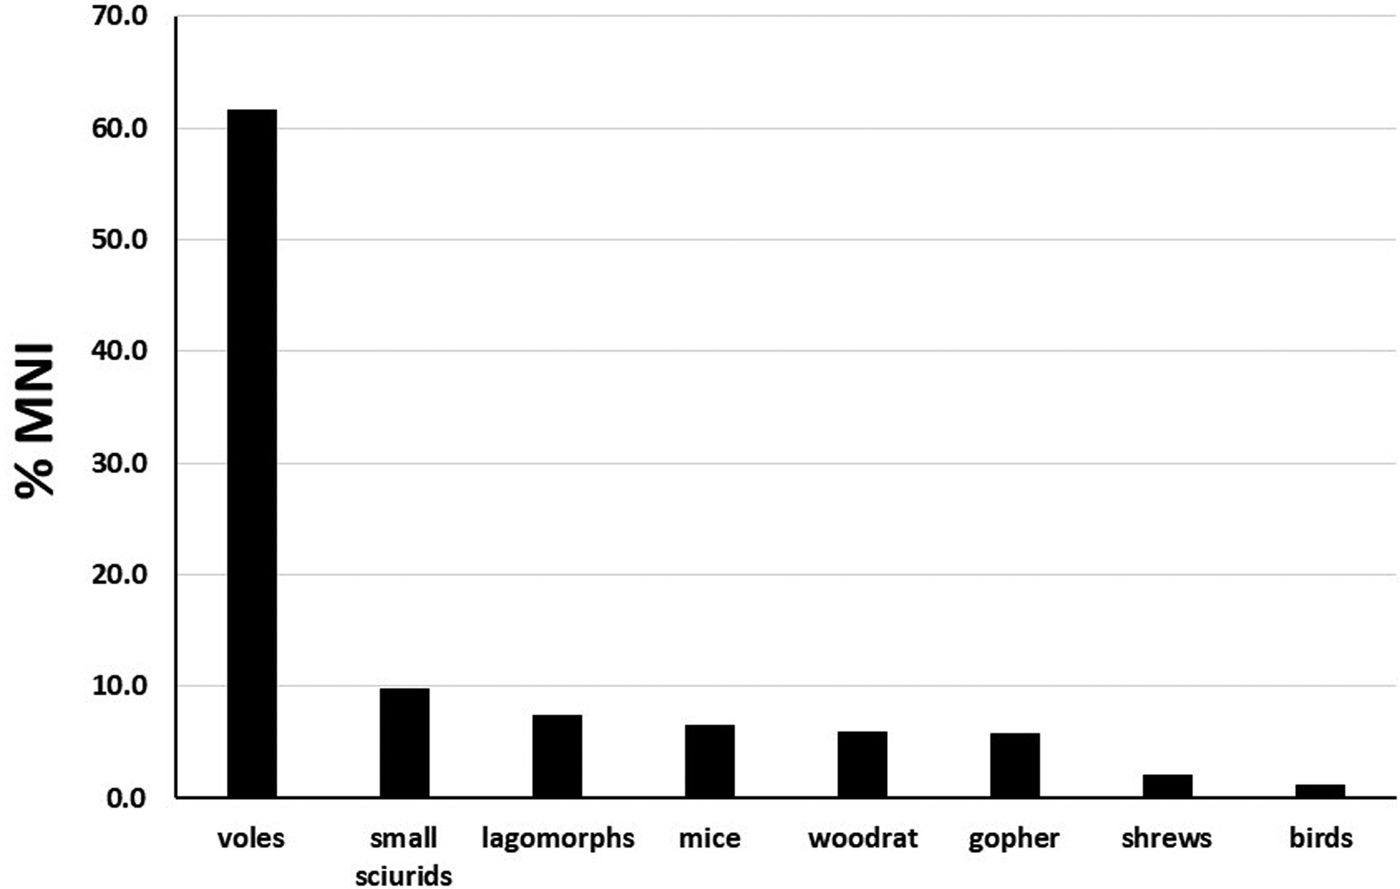
Weasels prey primarily on small rodents, especially voles but also mice (Cricetidae), squirrels (Sciuridae), gophers (Thomomys spp), lagomorphs, and shrews (Quick, Reference Quick1951; King and Powell, Reference King and Powell2006). Remains of all these taxa are prevalent in the deposits at Cement Creek Cave. In addition, weasels are known to kill their prey by biting and crushing the skull and then feeding on the carcass causing additional fragmentation of skeletal elements (Quick, Reference Quick1951). As mustelid remains also are fairly common in the deposits and have been identified from nearly every level with at least five species (including one extinct taxon) represented, it is likely that the cave was used by these species as a den or shelter and that many of the small mammal fossils in the cave are because of their activities. In the 13 levels subjected to complete analysis, the relative proportion of taxa is similar to published dietary preferences of weasels (Quick, Reference Quick1951). Voles (Microtus, Phenacomys, and Lemmiscus) comprise 61.63% of all individuals identified from these levels, whereas other taxa are much lower in representation from 1.12% (birds) to 9.73% (small sciurids including Neotamias, Urocitellus, Callospermophilus, and Tamiasciurus; Fig. 4). Quick (Reference Quick1951) found in his analysis of 77 scats of long-tailed weasels (Mustela frenata) from Gunnison County, Colorado, that voles had the highest percent occurrence (Microtus sp.; 52%), followed by small sciurids (23.4%), mice (Peromyscus sp.; 19.5%), gophers (3.9%), and pikas (Ochotona princeps; 1.3%). Given the vertebrate assemblage at Cement Creek Cave was likely accumulated by weasel and woodrat activities, it too should indicate species primarily from the cave's surrounding environment.
Percent MNIs (minimum number of individuals) for selected vertebrate taxa from all MNIs calculated from complete analysis of levels 5, 9–15, 20, 26, 30, 35, and 40 recovered from TP2 NE (test pit 2, northeast) at Cement Creek Cave. Voles (Microtus, Phenacomys, and Lemmiscus) far outnumber other small mammal and avian taxa in representation in the deposits, which may have been influenced by an accumulation of weasel (Mustela spp.) scat.

Signature Cave
Signature Cave (3055 m asl) is located in a small valley, Ute Gulch, that drains into Spring Creek in Gunnison National Forest. It is ~14 km east of Cement Creek Cave and also in Leadville limestone. This cave, and several others in Ute Gulch, were first reported in 1962 but only later explored and mapped by Medville (Reference Medville1995). We relocated these caves in summer 2007 to assess their potential for containing fossil deposits and/or ancient woodrat middens.
Of those, only Signature Cave appeared to have deposits that might contain fossil remains, with bones of large and small mammals on the surface. The cave is entered through a large opening approximately 2 m high and 1–1.5 m wide, allowing easy access to the interior for a wide range of mammals and other ground-dwelling species. We therefore anticipated that excavations here would provide a greater variety of high-elevation species, compared with the assemblage from Cement Creek Cave.
The environment surrounding the cave today is typical subalpine forest dominated by Engelmann spruce and aspen. Gooseberry (Ribes sp.) covers the slope immediately below the cave entrance, while willow (Salix sp.) is common along the stream banks. Many species of shrubs including sagebrush and cliffrose (Purshia sp.), miner's lettuce (Claytonia sp.), Indian paintbrush (Castilleja chromosa), and numerous grasses and other flowering plants also occur near the stream and on the slopes along and above the valley bottom.
Stratigraphy and age
The deposits at Signature Cave, exposed in two separate tests (TP1, 70 x 70 cm, and TP2, 80 x 100 cm), were deeper than expected, and no clear bottom to the cave sediments was found, except perhaps with the bucket auger in TP2 (see excavation details in Supplementary Materials). A total of 21 radiocarbon ages were obtained on vertebrate bones, and they range in age from 7866–713 cal yr BP (Table 4). The oldest age is from TP1 level 34, but bone from deeper levels and the auger sample produced younger ages indicating that bioturbation has mixed sediments and bone here, as at Haystack and Cement Creek Caves. Regardless, the deposits appear to date primarily to the Middle to Late Holocene. Only the lower clay deposits remain undated.
To better understand the cave's depositional history, sediment analysis on the 11 auger samples from TP2 was conducted. This analysis indicated that all samples had similar consistency in grain size, dominated largely by mud (clay and silt, 66.8–94.1%), but with coarser particles (sand) at the base, which decreased upward in the section (28.1–5.9%, from SC11 to SC1, respectively). The sediments were poorly sorted and had no sedimentary structure that would indicate long-term deposition or pooling of water in the cave (Benedetti, M., personal communication, 2012). These sediments contained few bones or organics. Overall, these results suggest relatively rapid infilling of sand and mud in the cave in the Early Holocene, followed by more gradual deposition of midden and fossil material after the cave became dry. These more recent deposits are more characteristic of cave fill, including uncompacted brown to dark-brown sediments with rock spalls, bone, and degraded midden. The deeper layers of sand and mud suggest the possibility that the valley in which the cave is located at some point flooded, perhaps owing to an obstruction below the cave where the valley bottlenecks, and water backed up into the cave. Regardless, the absence of Early Holocene remains in the cave suggests that it was too wet and/or inaccessible for animals to use until the Mid-Holocene.
Taphonomy
Because Signature Cave is accessible to a wider size range of species, it is possible that the remains in the cave could have been accumulated by carnivores as well as woodrats and other rodents. Evidence for this includes numerous coyote (Canis latrans) bones from the deposits, including those of juveniles, suggesting the cave may have been used occasionally as a den by this species. In addition, there are numerous bones of artiodactyls and juvenile deer (Odocoileus hemionus) that may have been brought into the cave by coyotes or other predators. Rodent burrows were evident in the back chamber of the cave and have disturbed the upper levels in that area. The burrows are large and likely resulted from yellow-bellied marmot activities; juvenile marmot bones also occurred in the deposits. Excavations of TP1 also produced a layer of artiodactyl fecal pellets of either bighorn sheep or deer just below the surface, indicating these animals sheltered in the cave during part of the year. Owing to the larger number of taxa that potentially contributed to the accumulation of faunal material in Signature Cave, its remains are not species that were likely as locally restricted as those in Haystack and Cement Creek Caves.
VERTEBRATE PALEONTOLOGY
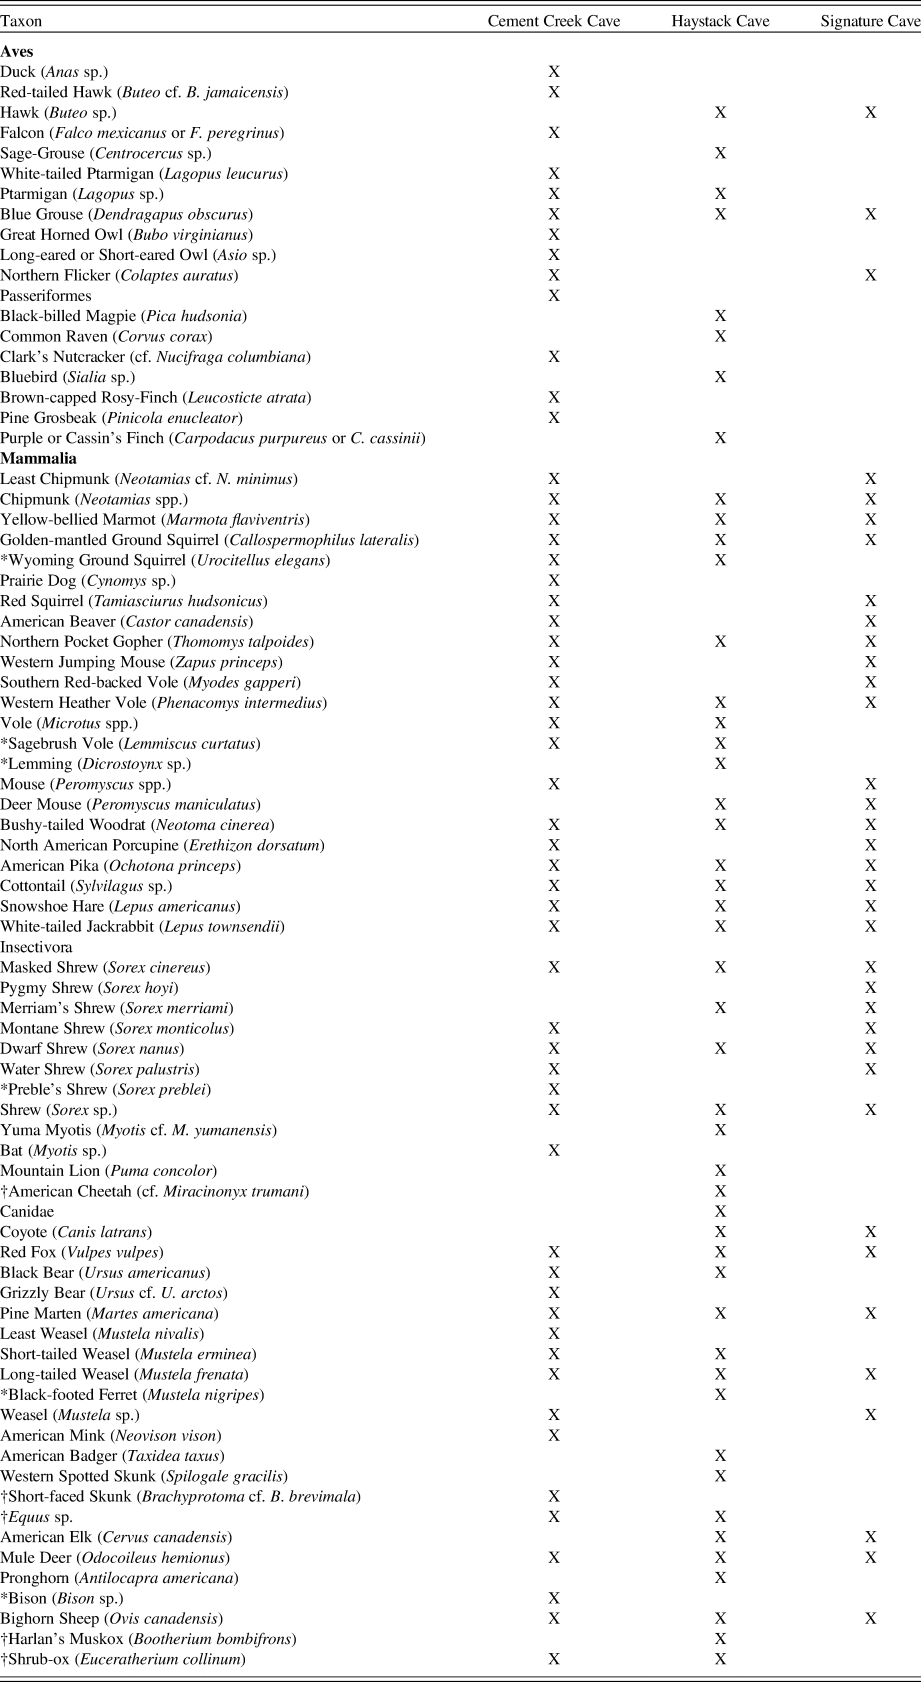
A summary list of all vertebrates from Haystack, Cement Creek, and Signature Caves is presented in Table 5. The assemblages are too extensive to list all elements recovered for each taxon, but much of those data are available elsewhere (Emslie, Reference Emslie1986, Reference Emslie2002; Nash, Reference Nash1987, Reference Nash2000; McLean and Emslie, Reference McLean and Emslie2012; McLean et al., Reference McLean, Ward, Polito and Emslie2014; Reynard et al., Reference Reynard, Meltzer, Emslie and Tuross2015). Accordingly, here only previously unreported taxa of birds and selected mammals (especially those that are rare, extralimital to the UGB, or extinct) are described in detail in the Supplementary Materials, along with systematic descriptions. The systematic order and taxonomic nomenclature follows that of Armstrong et al. (Reference Armstrong, Fitzgerald and Meaney2011) for mammals and the A.O.U. Checklist (American Ornithologists’ Union, 1998) for birds. Identifications and counts (number of identified specimens [NISP] and minimum number of individuals [MNI]) by level in the test pits excavated at Cement Creek (TP2 and TP2 NE) and Signature Cave are presented in Supplementary Tables 1–3; identifications by test pit and level of the large volume of fossil material from Haystack Cave was not possible because of multiple excavations by different investigators at this cave since 1978.
Tally of vertebrate taxa (Aves and Mammalia only) identified from Cement Creek, Haystack, and Signature Caves, Upper Gunnison Basin, Colorado. This list includes taxa reported here as well as by Emslie (Reference Emslie1986, Reference Emslie2002) and Nash (Reference Nash1987). Taxonomy follows A.O.U. Checklist (American Ornithologists’ Union, 1998) and Armstrong et al. (Reference Armstrong, Fitzgerald and Meaney2011). Extinct species indicated by a dagger (†); species extirpated from the basin are indicated with an asterisk (*). Only the Wyoming ground squirrel has reinvaded the UGB in the mid-twentieth century.

DISCUSSION
Collectively, the vertebrates from the three caves provide one of the richer, longer, and continuous records of high-elevation small mammal communities for the late Pleistocene to the Late Holocene of North America. Moreover, Cement Creek Cave is the only known high-elevation fauna in North America that dates to before and after the LGM. Two other high-elevation sites, Porcupine Cave, Colorado, and SAM Cave, New Mexico, date entirely within the early to middle Pleistocene, before the LGM (Rogers et al., Reference Rogers, Repenning, Luiszer and Benson2000; Barnosky, Reference Barnosky2004). The deposits at Porcupine Cave (1.0–0.6 Ma) also span at least two glacial-interglacial cycles and provide a model for comparison of faunal turnover with climate change in alpine communities (Barnosky, Reference Barnosky2004; Barnosky et al., Reference Barnosky, Bell, Emslie, Goodwin, Mead, Repenning, Scott and Shabel2004; Barnosky and Shabel, Reference Barnosky and Shabel2005). One other high-elevation site in Colorado at 2700 m, the Ziegler Reservoir site in Pitkin County, has produced a rich collection of fossil mammoths (Mammuthus columbi), mastodons (Mammut americanum), numerous other large and small vertebrates, and plant remains dating to ~130,000–70,000 yr BP (Sertich et al., Reference Sertich, Stucky, McDonald, Newton, Fisher, Scott, Demboski, Lucking, McHorse and Davis2014).
The late Pleistocene vertebrates from Haystack and Cement Creek Caves are dominated by open habitat animals from a steppe-tundra environment that included a mixture of both alpine (grasses and forbs) and subalpine plants (sagebrush, Artemisia spp.; Emslie, Reference Emslie1986, Reference Emslie2002). Assuming all or most of these species co-occurred in the UGB, an inference that requires additional, high-precision radiocarbon dating to confirm, it appears that in the late Pleistocene a mixed sagebrush and tundra habitat must have prevailed throughout the UGB at elevations above 2400 m. We refer to this habitat as sagebrush steppe-tundra, a nonanalog or disharmonius (Lundelius et al., Reference Lundelius, Graham, Anderson, Guilday, Holman, Steadman, Webb and Porter1983; Graham, Reference Graham, Diamond and Case1986; Stafford et al., Reference Stafford, Semken, Graham, Klippel, Markova, Smirnov and Southon1999; Semken et al., Reference Semken, Graham and Stafford2010) intermontane community that became fragmented and altered with warming trends at the end of the Pleistocene.
This sagebrush steppe-tundra community is represented by other late Pleistocene fossil sites in North America, and its existence in the UGB is supported by fossil pollen that indicates sagebrush was intermixed with alpine species during the late Pleistocene (Legg and Baker, Reference Legg and Baker1980). Fossil evidence also indicates this steppe-tundra was broadly continuous across the intermountain west (Spaulding et al., Reference Spaulding, Leopold, van Devender and S.C1983; Brasso and Emslie, Reference Brasso and Emslie2006) before becoming fragmented and reassembling into the sagebrush steppe, montane grasslands, and alpine tundra seen in the region today. This alteration occurred with late Pleistocene climate change, as well as the extinction of numerous large grazing and browsing megaherbivores, their extinction likely having changed the community dynamics and structure of many grassland and steppe habitats (Gill et al., Reference Gill, Williams, Jackson, Lininger and Robinson2009, Reference Gill, Williams, Jackson, Donnelly and Schellinger2012; Blois et al., Reference Blois, McGuire and Hadly2010; Blinnikov et al., Reference Blinnikov, Gaglioti, Walker, Wooller and Zazula2011). A broad expanse of sagebrush steppe-tundra extending from northern and northwestern North America may also help explain the reported disparity in insect fossils, in which some species restricted to the Pacific Northwest today occurred in the Rocky Mountain region during the late Pleistocene (Elias, Reference Elias2015). Currently, there is a mosaic of sagebrush steppe in the intermountain west, with at least eight species of Artemisia and a diversity of grasses that vary in relative composition across the region (West, Reference West, Barbour and Billings1988; Knight, Reference Knight1994). The distributional limits of these species have been referred to as an “ecological puzzle” (Knight, Reference Knight1994, p. 90) that likely derives from fragmentation of the former sagebrush steppe-tundra (Blinnikov et al., Reference Blinnikov, Busacca and Whitlock2002).
Marking the sagebrush steppe-tundra in the UGB is the presence of large open-habitat species in the Haystack Cave assemblage, which includes two extinct bovids, the musk ox (Bootherium bombifrons) and shrub-ox (Euceratherium collinum), horse (Equus sp.), and American cheetah (cf. Miracinonyx trumani). Pronghorn (Antilocapra americana) and bighorn sheep (Ovis canadensis) also are well represented in the site. Haystack Cave also is the only site in North America where Bootherium and Euceratherium co-occur and has the most southern record of Dicrostonyx in the western United States (Kurtén and Anderson, Reference Kurtén and Anderson1980; Lundelius et al., Reference Lundelius, Graham, Anderson, Guilday, Holman, Steadman, Webb and Porter1983; Mead and Mead, Reference Mead and Mead1989; Campos et al., Reference Campos, Sher, Mead, Tikhonov, Buckley, Collins, Willerslev and Gilbert2010). Bootherium is widely distributed in North America south to Texas, but in general has been associated with northern grassland, woodland, and alpine meadow habitats (Campos et al., Reference Campos, Sher, Mead, Tikhonov, Buckley, Collins, Willerslev and Gilbert2010). Based on preserved coprolites in Arizona, Euceratherium browsed largely on sagebrush (Artemisia tridentata), rabbit brush (Chrysothamnus sp.), acacia (Acacia sp.), and oak (Quercus sp.; Kropf et al., Reference Kropf, Mead and Anderson2007), plants that still occur in the UGB (Barrell, Reference Barrell1969). Radiocarbon ages on these two species from Haystack Cave (Table 2), however, do not resolve whether these two extinct oxen were contemporaneous in the UGB or alternately appeared and disappeared independently during episodes of climate change.
Cement Creek Cave has produced many of the same small mammals as Haystack Cave, but also a greater diversity of birds, shrews (Sorex spp.; Emslie, Reference Emslie2002), and one extinct mustelid (Brachyprotoma cf. B. brevimala). The avifauna includes open habitat and alpine taxa, notably the relatively abundant white-tailed ptarmigan (Lagopus leucurus). The Preble's shrew (S. preblei) no longer occurs in the UGB and is currently found in sagebrush steppe habitats in northern Colorado and Wyoming. Other mammals affiliated with open alpine and sagebrush habitat include abundant remains of Wyoming ground squirrel (Urocitellus elegans), sagebrush vole (Lemmiscus curtatus), pika, white-tailed jackrabbit (Lepus townsendii), bison (Bison sp.), and the extinct horse and shrub-ox. The similarities of this fauna with that of Haystack Cave (Table 5) suggest the sagebrush steppe-tundra habitat reflected by these species ranged from low to higher elevations within the UGB before, during, and after the LGM. It is somewhat surprising, then, that lemmings (Dicrostoynx sp.) were not identified among the abundant vole remains from Cement Creek Cave, and only two specimens occurred at Haystack Cave. It appears lemmings were able to extend their range southward into the UGB for only a brief period following the LGM, perhaps limited by the high-elevation and geographic barriers of the basin.
The fossil assemblage from Signature Cave, unlike those of Haystack and Cement Creek Caves, dates entirely within the Holocene. Small vertebrates recovered from this site reflect the current alpine-subalpine community in which it is situated today. This fossil assemblage also is notable for the absence of Preble's shrew, sagebrush vole, and Wyoming ground squirrel, supporting the hypothesis that these species were locally extirpated in the UGB by the Early to Middle Holocene. Only the Wyoming ground squirrel now occurs near the cave as part of its recent (post-1930s) range expansion into the UGB, where it thrives in open habitats (Hansen, Reference Hansen1962; Armstrong et al., Reference Armstrong, Fitzgerald and Meaney2011). Other species identified in this cave, but rare or absent in the Pleistocene records of Haystack and Cement Creek Caves, include Merriam's shrew (Sorex merriami) and red-backed vole (Myodes gapperi), species associated with subalpine forest. Thus, the fauna from Signature Cave represents a more typical subalpine coniferous forest and grassland/meadow community that is common at this elevation in the UGB today.
Community resilience
In ecology, resilience is defined at the ability of a community or ecosystem to withstand disturbances while maintaining its structure and processes (Holling, Reference Holling1973; Gunderson, Reference Gunderson2000). In the paleontological record it primarily refers to how well a faunal assemblage maintains its species richness over time. Ecological resilience in the UGB fossil record from Cement Creek and Haystack Caves was previously addressed for two rodent species, the yellow-bellied marmot (Marmota flaviventris) and bushy-tailed woodrat (Neotoma cinerea), using stable isotope analyses of tooth enamel (δ18O and δ13C; McLean and Emslie, Reference McLean and Emslie2012; McLean et al., Reference McLean, Ward, Polito and Emslie2014) and bone (δ18O, δD, δ15N, and δ13C; Reynard et al., Reference Reynard, Meltzer, Emslie and Tuross2015). These species were ideal for these investigations as their remains are common throughout most levels of the caves, thus spanning the last ~40,000 yr. In addition, while the marmot hibernates each winter, the woodrat is active year-round, thus providing a comparison of two species with differing habits, diet, and phenology. Results of these studies found no significant changes in the dietary ecology of these species across three time bins, indicating biotic continuity and strong resilience. We examine this issue in more detail here in relation to the entire vertebrate community represented in the deposits at Haystack, Cement Creek, and Signature Caves.
The data from these three caves indicate that five species of small mammals disappeared from the UGB by the Early to Middle Holocene: Sorex preblei, Lemmiscus curtatus, Dicrostonyx sp., Urocitellus elegans, and Brachyprotoma cf. B. brevimala. None of the five species is present in the vertebrate assemblage at Signature Cave. The short-faced skunk (Brachyprotoma cf. B. brevimala) went extinct (Kurtén and Anderson, Reference Kurtén and Anderson1980; Heaton, Reference Heaton1985; Anderson, Reference Anderson, Stewart and Seymour1996), perhaps from a specialized diet or habitat requirements that were affected by environmental changes at the end of the Pleistocene, but too little is known of this fossil species to be more definitive.
The other four species are still extant outside the UGB, having been extirpated within the UGB in either the Early (S. preblei, Dicrostonyx sp., and U. elegans) or Middle (L. curtatus) Holocene (Table 3). We infer these four species were affected by loss of open habitats and the increased forestation of the UGB that followed Early Holocene warming (a pattern evident in the vegetation record from the region; Briles et al., Reference Briles, Whitlock and Meltzer2012), as well as a possible keystone effect (Gill et al., Reference Gill, Williams, Jackson, Lininger and Robinson2009, Reference Gill, Williams, Jackson, Donnelly and Schellinger2012).
At least five taxa of megafauna have a known fossil record in the UGB, including Mammuthus, Equus sp., Bootherium, Euceratherium, and Bison. Removal of these large herbivores, with the exception of Bison (for which there are historic records in the UGB), would have had immediate effects on the sagebrush steppe-tundra, allowing increased growth of shrubs and trees resulting in a restructuring of the plant communities (Gill et al., Reference Gill, Williams, Jackson, Lininger and Robinson2009, Reference Gill, Williams, Jackson, Donnelly and Schellinger2012). Given the diet and habitat requirements of the Wyoming ground squirrel (mostly grasses and forbs in arid grassland; Armstrong et al., Reference Armstrong, Fitzgerald and Meaney2011), lemmings (grasses, moss in Arctic tundra), and the Preble's shrew (insects, sagebrush and bunchgrass [Pooideae] steppe; Armstrong et al., Reference Armstrong, Fitzgerald and Meaney2011), this community restructuring may have been a significant contributing factor to their extirpation from the basin.
The later disappearance of the sagebrush vole, which feeds primarily on grasses, forbs, and some woody plants (Armstrong et al., Reference Armstrong, Fitzgerald and Meaney2011), is timed with Early to Middle Holocene climate warming that caused forested habitats to expand to higher elevations (Fall, Reference Fall1997b), reducing the open sagebrush communities preferred by this vole. Unlike the Wyoming ground squirrel, it has not been able to reinvade the UGB since that time. Also of interest is the continuous presence of the heather vole (Phenacomys intermedius), which fluctuates from moderate to low abundance throughout all levels of the cave (Supplementary Table 4). This species today occupies a variety of habitats including alpine tundra, grassy meadows, shrub, and montane and subalpine forests in Colorado (Armstrong et al., Reference Armstrong, Fitzgerald and Meaney2011). It is perhaps this generalist behavior that has allowed it to persist in the UGB despite major episodes of climate change.
Late Pleistocene community restructuring has been documented in lower elevations of northern California, where local extirpations by the Early Holocene also occurred (Blois et al., Reference Blois, McGuire and Hadly2010). However, although these authors found a large increase in deer mice (Peromyscus spp.) in the late Pleistocene in deposits at Samwel Cave (460 m), leading to their Early Holocene dominance of the small mammal community, we observed no such increase in this group. Instead, our data indicate that the UGB was characterized more by increasing numbers of voles (Microtus spp., Myodes gapperi, and Phenacomys intermedius). As with deer mice, voles have a broad geographic distribution in North America today. This difference in our data suggests that high-elevation communities respond differently to climate change and habitat restructuring than those in lower elevations and/or other geographic regions. Part of this difference is likely because of the topographic isolation that characterizes the UGB and that would have inhibited recolonization by many species extirpated after major climatic events, including the Preble's shrew and sagebrush vole.
Richness and evenness
To further resolve these patterns in community restructuring and resilience, we examined the richness and evenness of small mammals (rodents, shrews, and rabbits) over time, using the data from the 13 levels analyzed in detail in Cement Creek Cave, TP2 NE (Supplementary Table 4). Although these levels represent the full span of deposition in the cave, we recognize that the temporal trend underpinning the stratigraphy is far from perfect. Mixing is evident in the radiocarbon chronology (Fig. 3), especially in the upper levels (see Supplementary Materials), though short-term fluctuations in this community would average out over long periods of deposition (Rowe and Terry, Reference Rowe and Terry2014).
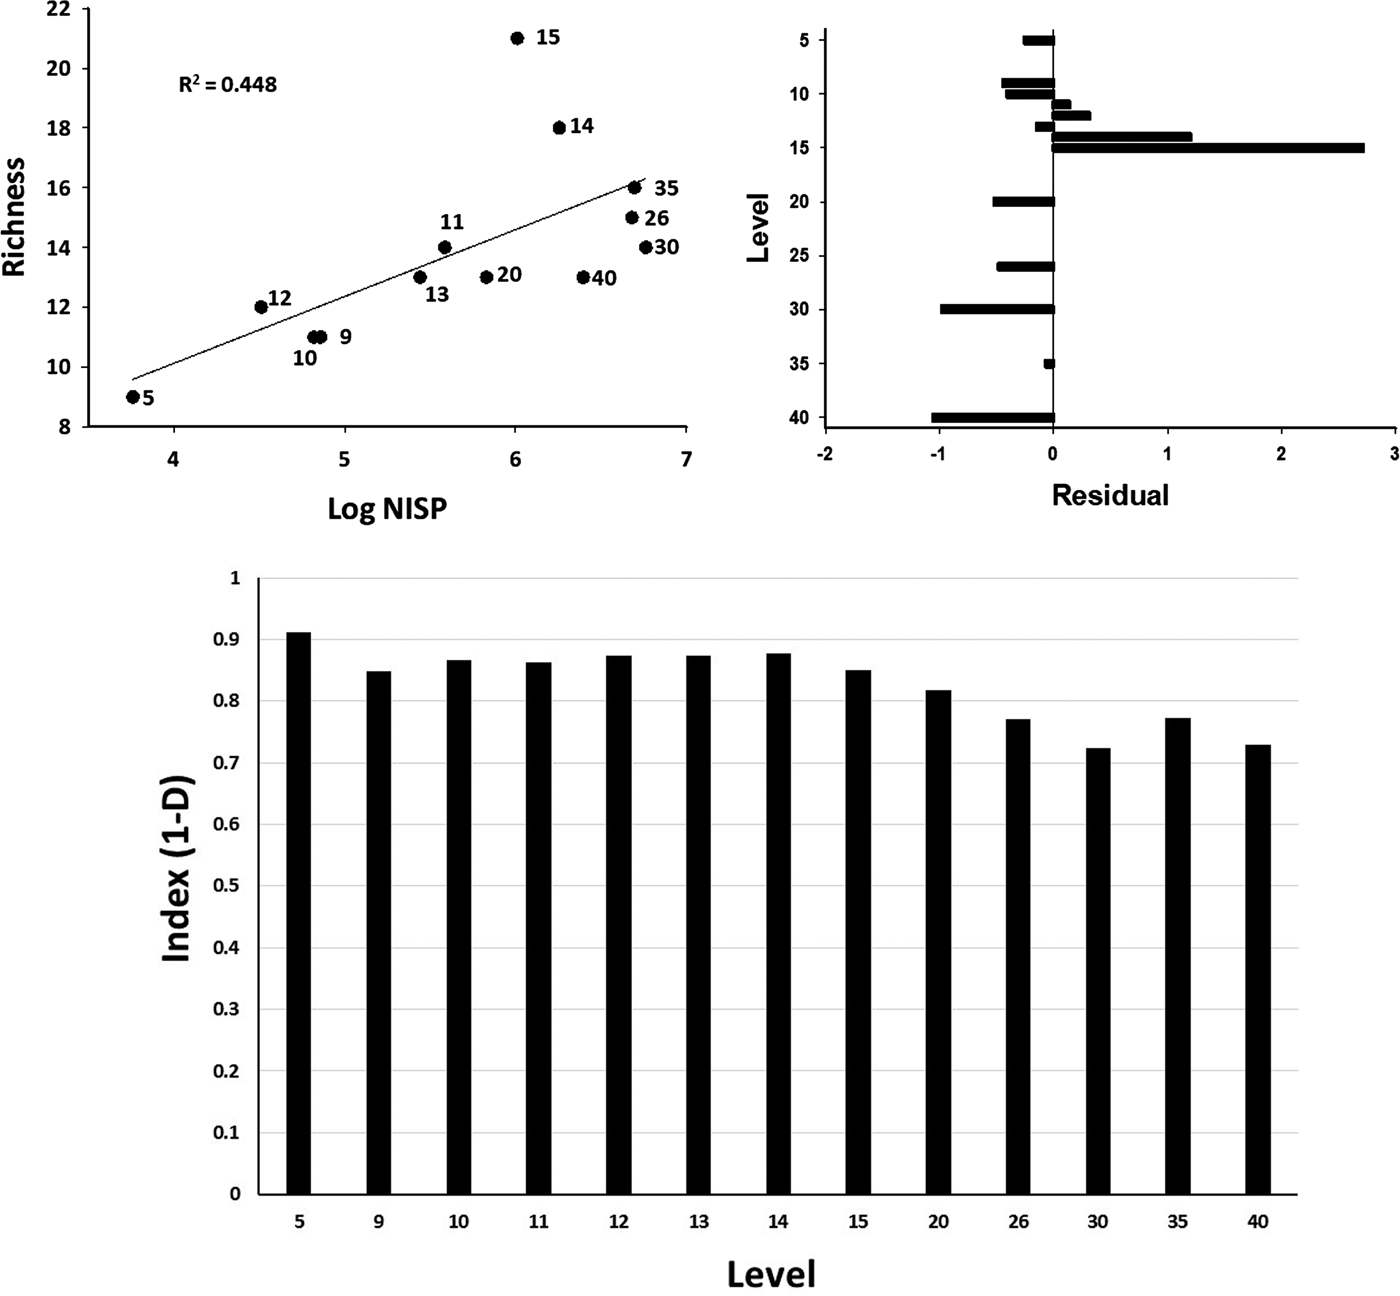
For all identified rodent, shrew, and rabbit fossils from these levels, we calculated taxonomic richness (the number of taxa) and evenness (the degree to which they are evenly represented) following Grayson (Reference Grayson1998, Reference Grayson2000), Faith and Du (Reference Faith and Du2017), and Faith and Lyman (Reference Faith and Lyman2019; see Supplementary Table 5). We first assessed the effects of sample size on richness by plotting the number of taxa (richness) against the number of identified specimens (LogN NISP), and found there is a relatively weak (r 2 = 0.448, P = .012; Fig. 5, top) but nonetheless significant relationship between the two. We note, however, that the general decrease in the number of taxa in the higher (Holocene) levels is associated with the local extirpation of species that coincided with Early Holocene warming and reduction of sagebrush steppe-tundra (a similar pattern is reported by Rowe and Terry [Reference Rowe and Terry2014]). There are also significantly more taxa in levels 14 and 15, and significantly fewer in levels 5, 9, and 10, than would be expected by sample size, as determined by analysis of residuals (Fig. 5, top). The higher richness in levels 14 and 15 compared with upper levels may be attributable in part to a change in the stratigraphy from the upper levels of degraded packrat (Neotoma cinerea) midden to the lower levels of light-brown fossiliferous sediments, the transition approximately marked by a thin travertine layer encountered in both TP2 (level 15) and TP2 NE (level 18; see Supplementary Materials). By level 10, in particular, there was a large drop in both the NISP and the MNI of sagebrush voles and Wyoming ground squirrels; the latter species was absent in level 5.
Taxonomic richness (top left) and evenness (bottom) by excavation level at Cement Creek Cave, TP2 NE (test pit 2, northeast). The richness calculations are based on numbers of shrews, rodents, and rabbits only, with level number provided by each plotted point. As noted in the text, although there is a relationship between richness and NISP (number of identified specimens), there are also significantly more taxa in levels 14 and 15, and significantly fewer in levels 5, 9, and 10, than would be expected by sample size, as determined by analysis of residuals (top right). Likewise, there is a relationship between evenness and sample size, except in the case of levels 13 and 14 (higher evenness values than expected by sample size) and level 40 (lower values than expected).

Evenness values were calculated using the Simpson's diversity index for the same levels and taxa as discussed previously (Supplementary Table 5). This index is less sensitive to fluctuations in richness than are other diversity indices (Faith and Du, Reference Faith and Du2017). A value of 1 represents a situation in which the level is dominated by a single taxon and the resulting values here ranged from 0.723 (level 30) to 0.912 (level 5; Fig. 5, bottom). The lowest values are associated with the deeper deposits in the cave (levels 26 and lower), with higher values from level 15 to level 5. This trend in part reflects the loss in species richness in the upper levels, to the extent that mixing has not obscured the ecological signals, where the frequencies of Wyoming ground squirrel and sagebrush vole drop to very low values. This loss in richness is tempered in part, though, by other vole species (Microtus spp., Myodes gapperi, and Phenacomys intermedius) that remain present at low to high numbers in the upper levels (Supplementary Table 4). By this time, community reorganization following late Pleistocene extinctions had stabilized.
CONCLUSIONS
The vertebrate faunas from Haystack, Cement Creek, and Signature Caves in the UGB provide the richest fossil record of late Pleistocene to Holocene vertebrates from a high-elevation montane region in North America and a rare opportunity to investigate small mammal community change since before the LGM to the present. Surprisingly, these faunas show strong resilience in a community thought to be quite sensitive to climate change, as indicated by an analysis of richness and evenness of small mammals from Cement Creek Cave and as seen in previous studies of fossil marmots and woodrats using stable isotopes. Although there was considerable turnover and extinction in the large mammal (megafauna) community by the Early Holocene, small mammals in the UGB experienced only four extirpations and one extinction. Part of this resilience is undoubtedly attributable in part to the ability of small mammals (more so than large ones; McCain and King, Reference McCain and King2014) to rapidly evolve and adapt to changing environmental conditions, as they appear to have done so in the UGB over the past 40,000+ yr. The extirpation of only three species of rodents and one shrew from the UGB at the end of the Pleistocene also was probably related to fragmentation of the steppe-tundra environment with climate change and the loss of grazing/browsing megafaunal species. The expansion of forests to higher elevations further reduced open grassland and sagebrush habitat preferred by the Wyoming ground squirrel and the sagebrush vole. Finally, the unusual physiography and topographic isolation of the basin that limits immigration primarily to high-elevation plant and animal taxa also was likely a factor influencing community dynamics and preventing reinvasion of conspecifics of extirpated species into the UGB, including the sagebrush vole and Preble's shrew. Recovery of additional fossil vertebrates from this montane region will continue to test these hypotheses.
ACKNOWLEDGMENTS
Research at Haystack Cave in 1997/1998 was completed with funding from the Colorado Historical Society (#98-01-105) and National Geographic Society (NGS 5995-97) under a collecting permit from the Bureau of Land Management (BLM). Excavations were completed with the assistance of undergraduate students from Western State College, Colorado, and Autumn Hyser, University of North Carolina Wilmington. Tom Verry and Tom McGinnis helped construct the wooden support walls and repair the gate to the cave with funds from the BLM. We thank Julie Coleman, formerly with Gunnison BLM, for her support in these operations. D. Nash kindly provided access to his data from this cave and permission to use his figure of the cave map in this paper.
Initial work at Cement Creek Cave (1998) was supported by a grant from the National Geographic Society (NGS 5995-97) under a collecting permit from the U.S. Forest Service. Excavations in 2007–2011 at Cement Creek and Signature Caves were conducted under Special Use Permits FS-2700-4 and GUN766 from the U.S. Forest Service. We thank C. Mask for her support for these permits and M. Benedetti for a sediment analysis of this cave. Funding was provided by National Science Foundation Grant EAR 0819678 and the Quest Archaeological Research Program at Southern Methodist University. We thank J. Barlow, A. Boehm, C. Doyle, M. Eren, E. Gruber, B. McLean, L. Reeder, J. Smykla, H. Sprinkle, L. Willis, and D. Yeager for assistance in the field and/or lab. A. Boehm and D. Grayson provided useful comments on an earlier version of this paper. I. Jorgeson kindly calibrated in one fell swoop the nearly 100 radiocarbon ages, using his considerable wizardry with R and OxCal. M. Stiger provided laboratory space at Western State College (now Western State University, Gunnison) for screen washing and sorting sediments. Uranium series ages were provided by Xianfeng Wang of the Department of Geology and Geophysics, University of Minnesota, Minneapolis. K. Brugger provided important information on the glacial history of the region. Radiocarbon ages were completed by Beta Analytic Inc., the University of Georgia Center for Applied Isotope Studies, and the University of California, Irvine, Keck Carbon Cycle AMS Facility. We thank D. Fox, T. Faith, and one anonymous reviewer for helpful comments to improve this manuscript.
SUPPLEMENTARY MATERIAL
The supplementary material for this article can be found at https://doi.org/10.1017/qua.2019.26.