Introduction
Population heights vary across the world and through time. The heritable trait of individual stature is known to be influenced by multiple environmental factors, especially during childhood. Efforts have been made to attribute the variance in population heights to variables such as pathogen exposure, income, nutrition, education attainment and general standard of living (Steckel, Reference Steckel1991; Padez & Johnston, Reference Padez and Johnston1999; Beard & Blaser, Reference Beard and Blaser2002). Despite correlations between height and environmental factors, environment alone cannot explain the observed global variance in height (Akachi & Canning, Reference Akachi and Canning2007; Webb et al., Reference Webb, Kuh, Pajak, Kubinova, Malyutina and Bobak2008). A meta-review of modern Western populations found that while variations in height mirrored environmental conditions, particularly nutritional deficiencies and pathogen exposure, they only accounted for around 20% of the variance in population height (Silventoinen, Reference Silventoinen2003). While factors such as childhood health and income are good predictors of adult height in wealthier populations they are inconsistent and unreliable when applied globally. For example, multiple African nations with insufficient nutritional supply and elevated pathogen exposure are considerably taller than populations with adequate nutrition and diminished pathogen exposure (Deaton, Reference Deaton2007).
Comparisons of variance in body height between humans and other species indicate that strong selection pressures have reduced variation within populations while increasing it across populations (McKellar & Hendry, Reference McKellar and Hendry2009). However, there are a host of physical and behavioural traits that are under sexual selection pressure, including height; there is also incredible variance in gender equality and social limitations on the expression of female mate selection. Prior cross-cultural examinations of the relationship between gender equality and the expression of sexual selection preferences have found that population gender equality increases sexual dimorphism in personality traits (Schmitt et al., Reference Schmitt, Realo, Voracek and Allik2008) and the values placed on traits (Schwartz & Rubel-Lifschitz, Reference Schwartz and Rubel-Lifschitz2009). The aim of this paper is to investigate how much, if any, of the variance in human height is attributable to gender inequality and the socially imposed inability to freely participate in natural mate selection processes.
Consistent mating and reproductive preferences for male height have been observed across a range of cultures (Pawlowski, Reference Pawlowski2003; Swami, et al., Reference Swami, Furnham, Balakumar, Williams, Canaway and Stanistreets2008; Prokop & Fedor, Reference Prokop and Fedor2011). While attempts to measure the strength of sexual selection pressures are difficult there is clear variance in mating and reproductive success associated with human height providing evidence of directional selection pressure for height (Mueller & Mazur, Reference Mueller and Mazur2001). Specific attempts at quantifying the strength of selection for stature (Courtiol et al., Reference Courtiol, Picq, Godelle, Raymond and Ferdy2010), as well as meta-reviews of selection pressures (Stearns et al., Reference Stearns, Byars, Govindaraju and Ewbank2010), have shown that, while height does have physiological limitations, especially for females (Nettle, Reference Nettle2002a), there exists a population preference for stature that is skewed in favour of taller individuals, especially males. Height is a preferred and actual characteristic in female selection (Courtiol et al., Reference Courtiol, Picq, Godelle, Raymond and Ferdy2010) with taller men having more offspring (Pawlowski et al., Reference Pawlowski, Dunbar and Lipowicz2000) and more long- and short-term mating partners than shorter men (Nettle, Reference Nettle2002b; Rhodes et al., Reference Rhodes, Simmons and Peters2005). Furthermore, taller men tend to have sex at earlier ages and later into life (Buss & Schmitt, Reference Buss and Schmitt1993). Incidentally, female preferences for taller mates also increase during the follicular phase of the menstrual cycle, when the probability of conception is greatest (Gangestad et al., Reference Gangestad, Simpson, Cousins, Garver-Apgar and Christensen2004; Pawlowski & Jasienska, Reference Pawlowski and Jasienska2005). Finally, infidelity studies have found that when a woman cheats she is more likely to do so with a mate who is taller than her current partner (Gangestad & Thornhill, Reference Gangestad and Thornhill1997).
In every adult population observed males are taller than females (Eveleth, Reference Eveleth1975). Sexual selection preferences for height are dimorphic with women preferring men who are taller in relationship to themselves and men preferring women who are shorter than themselves (Pawlowski, Reference Pawlowski2003; Fink et al., Reference Fink, Neave, Brewer and Pawlowski2007). Meta-analysis of the dichotomy of sexual selection preferences for height has found that height is significantly more important for female mate selection than for male (Pierce, Reference Pierce1996).
Global variance in gender equality
Despite global advances in the status of women, variance remains in social, political and economic inequality (Hausmann et al., Reference Hausmann, Tyson and Zahidi2011). Societal practices of gender inequality such as genital mutilation (Toubia & Sharief, Reference Toubia and Sharief2003), domestic violence (Watts & Zimmerman, Reference Watts and Zimmerman2002) and the sex trade (Roby, Reference Roby2005), as well as less subversive inequality in education (Brown, Reference Brown2004) and income (Blau & Kahn, Reference Blau and Kahn2003), remain (Dorius & Firebaugh, Reference Dorius and Firebaugh2010). Gender inequality and male preferences have repercussions in population dynamics around the world, the most dire exemplification being the presence of ‘missing women’. Given the female survival advantage (Christensen, et al., Reference Christensen, Ørstavik and Vaupel2006), females typically outnumber males, however; multiple nations, as a result of male preferences, have significantly fewer females (Sen, Reference Sen1992). For example, the cultural practice of female infanticide and male preferences in food and medical care has resulted in 50 million females being absent from India alone (Allahbadia, Reference Allahbadia2002). The extreme nature of this preference has resulted in upwards of 100 million missing females around the world (Klasen & Wink, Reference Klasen and Wink2004).
Evolutionary theories purposed to explain this phenomenon have primarily focused on differential returns in parental investment or male–male competition (Hamilton, Reference Hamilton1967; Trivers, Reference Trivers and Campbell1972; Trivers & Willard, Reference Trivers and Willard1973). Parental investment in offspring should theoretically be equal, and thus sex ratios would be in equilibrium unless parents allocated resources towards offspring with the greatest potential to survive and in turn be reproductively viable (Fischer, Reference Fischer and Bennett1958). Differential paybacks in offspring investment related to within-population social variations in marriage arrangements and land inheritance have been shown to affect gender ratios in Nepal (Strickland & Tuffrey, Reference Strickland and Tuffrey1997).
Multiple indexes have been created in an effort to empirically measure gender equality across cultures and demographic regions (Apodaca, Reference Apodaca1998). Some nations, such as Sweden, Finland and Denmark, consistently rank high on measures of gender equality, while other nations, such as Yemen, Afghanistan and Lesotho, consistently rank low on measures of gender equality (Dijkstra, Reference Dijkstra2002; United Nations, 2008, 2010).
The Gender Inequality Index (GII) is a composite index measuring the inequality between genders in three dimensions: reproductive health, empowerment and labour market participation (United Nations, 2010). The reproductive health dimension is an indexed value of maternal mortality ratios and adolescent fertility rates. The empowerment and labour market dimensions utilize the ratios of male to female parliament members, ratios of male to female population with at least a secondary education, and the ratio of male to female labour force participation. Index values range from 0 to 1 with lower values representing near-perfect gender equality and greater values representing greater levels of gender inequality.
Methods
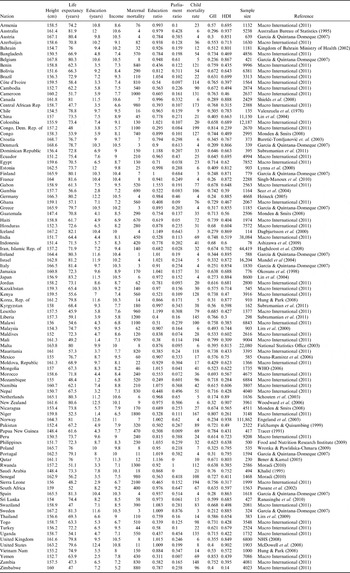
Mean female population heights for 96 nations were obtained from previously published sources and public access databases (see Appendix Table A1). Variables of education obtainment rates, life expectancy, income, maternal mortality, ratios of female to male education obtainment and parliamentary participation, childhood mortality, human development and gender inequality, come from the United Nations country profiles in the Human Development Report (http://hdr.undp.org/en/countries/).
Education values are the mean number of years of schooling achieved by the adult population.
Life expectancy values are the life expectancy in years at birth.
Income is the natural log of gross national per capita income as measured in 2008 price purchasing power in US dollars.
Maternal mortality is the number of maternal deaths per 100,000 live births.
Maternal death is defined as the death of a woman while pregnant or within 42 days after terminating a pregnancy.
Education ratio is the ratio of females to males, 25 years and older, that have attained a secondary education.
Parliament ratio is the ratio of female to male seats held in a lower or single house or an upper house or senate, where relevant by nation.
Childhood mortality rate is the probability per 1000 births that a child will die before reaching their 5th birthday.
Gender Inequality Index (GII) values are from the 2010 report. Values range from 0 to 1, with greater values representing greater gender inequality in a population.
Human Development Index (HDI) is an index measuring three dimensions of human development including: life expectancy, knowledge and a decent standard of living. The HDI is the mean of each normalized indices of life expectancy, education and the Gross National Income Index and all values are from the 2010 report.
Results
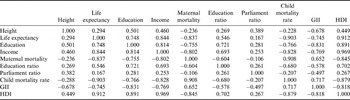
A list of the 96 nations, along with the mean values for all variables, is provided in Appendix Table A1. The mean female population height of the 96 populations is 158.62 cm (SD=4.96) (Table 1). The tallest females were located in Croatia (168.71 cm) and the shortest in Guatemala (147.4 cm). The GII values ranged from as low as 0.174 (Netherlands) to as high as 0.853 (Yemen) with a mean value of 0.561 (SD=0.19). Correlations between height and explanatory variables are provided in Table 2. The highest correlation with height was GII (−0.678), not income (0.460), HDI (0.449), life expectancy (0.294) nor childhood mortality (−0.228). The GII is correlated with several of the explanatory variables. The correlations greater than 0.7 include: life expectancy (−0.745), education (−0.831), income (−0.769), childhood mortality (0.717) and the HDI (−0.818) (Table 2).
Minimum, maximum, mean and standard deviations for variables for 96 countries

Correlations between variables

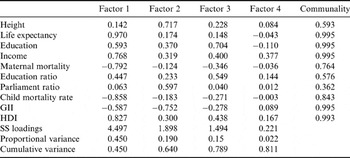
Factor analysis with Varimax rotation and Kaiser normalization was performed using R statistical software. Examination of the scree plot confirmed four factors. The four factors accounted for 81.1% of the observed variance (Table 3). The first factor accounted for 45% of the variance and had high loadings for variables related to life expectancy (0.970), income (0.768), maternal mortality (−0.792), child mortality rate (−0.858) and the Human Development Index (0.827), representing overall standard of living and population health. The second factor explained 19% of the variance and had high loadings in height (0.717), parliamentary participation ratios (0.597) and GII (−0.752), representing a measure of gender equality and height. The third factor explained 15% of the variance and was related to population education obtainment with strong loadings for education (0.704) and ratio of education obtainment (0.549). The final factor accounted for 2% of the variance and represented variance in income not attributable to the other factors and had a loading of 0.377.
Factor loadings, proportional and cumulative variance and communalities

Discussion
The greater part of the variance in the data is attributable to the first factor, or overall population health and well-being (45%). However, examination of the relationship and loadings between height and each factor indicates that the variance in height is best defined by the second factor, which is dominated by the loading for gender inequality (0.717), rather than population health, Factor 1 (0.142) or education, Factor 3 (0.228). Human stature is a quantitative trait and these results indicate that the most significant factor contributing to population height is gender inequality and the restriction of the expression of sexual selection pressures. Similar research that utilized smaller and less diverse samples of nations also found correlations between gender equality and height and that gender equality was a significant predictor of male and female height (Lippa, Reference Lippa2006). For this paper only female population heights were used, but sexual dimorphism of stature ratios are consistent cross-culturally (Gaulin & Boster, Reference Gaulin and Boster1985), and while female height alone does not represent total population height it does serve as a proxy for total population height.
It is worth noting that the variable of gender education ratio, unlike the ratio of share of parliament, loaded into the education factor rather than the gender inequality factor, indicating that political participation and representation may be a more accurate predictor of a population's gender equality than education rates. The GII loaded in both the first and second factors (−0.587 and −0.752), which is not surprising given that general well-being of the population would be directly influenced by the fact that females represent roughly half of any population. A theoretical population's HDI index would be impaired if that population's GII was high, and indeed inter-correlations between the HDI and the GII were observed (−0.818) (see Table 2). These finding lend credence to the assertion that measures of gender inequality should be taken into consideration when addressing indexes such as the HDI.
A potential caveat of this research is that cultural trends in gender equality are not static. The gender equality observed in a population in a particular year is not the level of gender equality of the prior generation, and the female heights measured for this data set are the product of the prior generation's environment, social behaviour and mate selection. It has been proposed that ecological constraints, marriage systems, coalitions and relative wealth can alter mating patterns and variance in mating behaviour (Low, Reference Low2005). Moreover, rapid fluctuations in sexual selection pressures as a result of societal changes in mating behaviours have been observed (Moorad et al., Reference Moorad, Promislow, Smith and Wade2011). However, despite the tendency for generational changes in gender equality, this study utilizes a large cross-section of the global population (96 nations) and nearly half a million observations (N=491,636) that include disparate geographies, socioeconomic development levels and racial make-ups. As such it would not be expected that extensive changes would have occurred such that general relationships between population heights and cultural practices would not still emerge. Great efforts were taken to ensure homogeneity among selected samples. When available, only the heights of females between the ages of 25 and 35, or corresponding birth years, were used.
Despite evidence of strong sexual selection pressures for stature in modern populations, conflicting data exist pertaining to the presence of a height preference in less developed societies (Sear & Marlowe, Reference Sear and Marlowe2009; Sorokowski, et al., Reference Sorokowski, Sorokowska, Fink and Mberira2011). For example, in Namibia, taller men of the !Kung tend to have more surviving offspring than their shorter counterparts (Kirchengast, Reference Kirchengast2000); however, studies of rural and urban Namibian males around Rundu found that taller males in rural areas have more offspring but that taller males from urban areas have fewer offspring (Kirchengast & Winkler, Reference Kirchengast and Winkler1995). Questions about the universality of male height preferences have been raised in light of findings that taller men were not found to have higher reproductive success in Gambia (Sear, Reference Sear2006a). In the light of the findings of this article it is worth noting that GII values for Gambia were excessively high (0.742), indicating that females suffer from extreme inequality and impaired mate selection. Given the tendency for girls to be betrothed by their parents at early ages, and the near complete lack of expression of sexual selection preferences, it is not surprising that both the male–taller norm and the increased reproductive success of taller males was not observed (Sear, Reference Sear2006b). Furthermore, the lack of expression of sexual selection for height may be related to the shorter stature of the Gambian population (157 cm).
It has become common practice for economists and historians to use stature as a measure of population well-being at historical epochs (Tanner, Reference Tanner1962; Fogel et al., Reference Fogel, Engerman and Trussel1982; Sandberg, & Steckel, Reference Sandberg, Steckel, Richard, Steckel and Floud1997; Steckel, Reference Steckel2009). While environmental conditions play a critical role in a population's mean height, variations in cultural practices, such as gender equality and equitable mate selection, need to be taken into account to better represent current and historical anthropological trends. Cultural practices that inhibited mate selection preferences may contribute to fluctuations in population height. In conclusion, the findings of this research demonstrate that equitable mate selection, like income and health, need to be taken into account to fully understand variances in population heights and historical trends in population heights.
Acknowledgments
The author wishes to acknowledge the United Nations Human Development Report, as well as the Demographic and Health Survey, for variable data. As always, special thanks go to my wonderful wife Jessica. The author reports no declarations of interest.
Global data on heights, life expectancy, education, income, GII and HDI