The past decade has seen an increase in the popularity of “survey key driver analysis” (SKDA) to help decision makers focus their efforts on the most critical organizational issues (Colquitt & Macey, Reference Colquitt and Macey2005; Kraut, Reference Kraut and Kraut2006; Rasch, Kowske, & Herman, Reference Rasch, Kowske and Herman2009). This analysis attempts to identify a set of survey items (i.e., drivers) that have the greatest impact on a specified organizational outcome (e.g., overall job satisfaction). Typically, scores on a single, global item (e.g., overall job satisfaction) are correlated with or regressed onto the scores for the remaining items within a survey. However, it is also possible to use an index score, which is a scale score formed from multiple items, as the criterion. The items with the strongest relationship are labeled as “key drivers” of the construct measured by the global item, and organizational leaders are encouraged to focus their efforts and resources on the “key drivers.” The use of criteria internal to the same survey as the items used as predictors distinguishes SDKA from linkage analysis (Wiley, Reference Wiley and Kraut1996; Wiley & Campbell, Reference Wiley, Campbell and Kraut2006) with which some industrial–organizational (I-O) psychologists are familiar.
Increasingly, SKDA has become part of mainstream practice. A manual search of advertisers in The Industrial Psychologist yielded 10 vendors who are now offering key SKDA as one of their services, with statements that this methodology is “a traditional approach” and a “best practice.” Despite the recent prevalence of SKDA, there is a dearth of empirical literature on the topic. Only a handful of presentations, articles, and chapters discuss SKDA. We view this as potentially problematic in that a practice is being implemented about which we know very little from a research and theoretical perspective. Contrast this with the wide body of research and theory that exists for psychometrics and test development.
SKDA Defined
Work by Kraut (Reference Kraut and Kraut2006), Lundby and Johnson (Reference Lundby, Johnson and Kraut2006), Rasch et al. (Reference Rasch, Kowske and Herman2009), and Leonard and Lieberman (Reference Leonard and Lieberman2006) provides the framework and reasoning behind SKDA. For the purposes of our review, we are focused on these authors’ operationalization of SKDA. This analysis identifies a set of survey items that has the greatest impact on either a single outcome item or an index score (computed from several outcome items). The criterion score represents a key indicator of organizational effectiveness such as overall job satisfaction or turnover intention. The set of items is seen as “driving” the results for the outcome measure and is meant to provide organizational stakeholders a means of focusing limited resources on issues that will yield the greatest improvements in organizational effectiveness. Survey key driver items are identified through analyses based on the general linear model, such as correlation coefficients (including zero-order, partial, or semipartial correlation coefficients) and regression analyses (including stepwise and multiple regression or relative weights analysis). Individual employees’ responses are used as the cases, or unit of analysis. A unique set of survey key driver items is computed for each organizational entity, with the implicit assumption that drivers are specific to each entity. Although SKDA could be conducted using scale scores as predictors, we focus our focal article on the use of item scores as predictors as this approach is more prevalent. We also focus on the use of a single criterion item, as it is what we have observed most frequently in practice.
Our Position: Methodological Issues Limit Usefulness of SKDA
In this focal article, we take the stance that methodological issues limit the usefulness of SKDA in applied settings. We base our position, in part, on the psychometric literature. We begin with a short justification for the viewpoint that surveys are psychometric instruments and an overview of the methodological issues.
Surveys as Psychometric Instruments
Some readers might question whether organizational surveys can be viewed psychometrically. We would counter that many organizational surveys aim to measure job satisfaction and employee engagementFootnote 1 (Macey & Schneider, Reference Macey and Schneider2008), which are psychological constructs. Even those not developed with the explicit aim of measuring psychological constructs have psychometric properties. Indeed, Gast (Reference Gast2008, Reference Gast2010) has shown how psychometric theory can be applied to the development of organizational surveys just as it has traditionally been applied to personnel selection. Both processes begin with the operational definition of constructs and employ judicious item-writing procedures. During implementation, both require knowledge of research design and rely on random sampling for creating psychometric norms. Finally, in the data analysis and reporting phases, both rely on similar descriptive and inferential statistics for scale development and scoring. Several established psychometric concepts appear relevant to SKDA (e.g., item variance, range restriction, latent variables, and factor analysis).
Methodological Issues
We outline several methodological issues with SKDA. The issues cover topics such as the standard deviation (SD) of survey items, capitalization on chance, empirical versus rational item selection, the factor structure of organizational surveys, situational and temporal specificity of SKDA, multivariate analysis requirements, and finally the classic issue of correlation and causation. These issues are largely based on psychometric theory; however, we provide empirical support for many of these issues using a publicly available dataset from a survey used by the U.S. federal government. We do this to provide evidence that the issues are not merely conceptual or hypothetical but rather truly impact the interpretation of SKDA results. Information on the survey data we used is provided in Appendix A.
Issue 1: SKDA Results Are Impacted by Item SDs
According to psychometric theory, an item's SD affects the magnitude of its item-total correlation. Very easy or difficult items (i.e., those with very low or high p-values or means) have low SDs and cannot have a high item-total correlation. Items with moderate p-values or means have the largest SDs and highest correlations with the total score (assuming that they measure the same construct as the total score). Similarly, range restriction on a predictor reduces its correlation with a criterion. In SKDA, the items serve as predictors, and psychometric theory predicts that items with lower SDs will correlate less with the criterion. If this is true, then there will be a positive correlation between item SDs and survey key driver metrics.
Indeed, using the federal survey dataset described in Appendix A, we found a strong positive correlation (r=.62) between the SD of an item and the bivariate correlation of that item with the criterion item. To illustrate, item 54 (“Employees use information technology [for example, intranet, shared networks] to perform work”) had the lowest SD (.79) and a correlation of .33 with the criterion item. In contrast, item 37 (“I have a high level of respect for my organization's senior leaders”) had the highest SD (1.22) and a correlation of .70 (about twice as strong) with the criterion item. As mentioned earlier, it is possible to conduct SKDA using an index score as the criterion. We created an index score using three criterion items (as described in Appendix A) and again found a strong positive correlation (r=.59) between the SD of an item and the bivariate correlation of that item with the criterion index.
The .62 value was obtained using the entire dataset. Most SKDA statistics are obtained separately for organizations and suborganizations. However, when we analyzed the data within organizations and suborganizations, we obtained similar results (r=.64 and .68, respectively). Scherbaum, Putka, Naidoo, and Youssefnia (Reference Scherbaum, Putka, Naidoo, Youssefnia and Albrecht2010) have suggested using relative weights analysis (RWA), a more modern technique that was originally developed for other applications (Johnson, Reference Johnson2000; Johnson & LeBreton, Reference Johnson and LeBreton2004) but aims to address limitations of the bivariate and regression-based approaches. Using RWA, we again found a “high” (as defined by Cohen's, Reference Cohen1992, cutoffs) correlation between item SDs and the SKDA metrics: r=.51 using the entire dataset. Overall, when examined at the bivariate level, SKDA metrics are highly correlated with item SDs. A 1 SD increase in the SD is associated with an increase in the SKDA metrics of .51 to .68, depending on the metric used and the data analyzed.
We did find that using multivariate regression analysis reduces the correlation between SKDA statistics and item SDs. For example, when all of the items are entered into a multiple regression equation, the correlation between the β-weights and item SDs was .26. When the items were entered into a stepwise regression procedure that selected five or 10 items, the Nagelkerke correlations between each item's status as a driver (coded as 0 or 1) and item SDs were .27 (in both instances). These correlations are better than those from the bivariate analysis, although they come with the caveat that multicollinearity and capitalization on chance negatively impact the interpretability of these β-weights. Additionally, the factor structure underlying an organizational survey might explain the reduced correlation for the SKDA metrics obtained using multivariate analyses. Controlling for other items (via multiple regression) partials out common factors that underlie item responses. These factors may be the underlying dimension that correlates with item SDs. Interestingly, partial and semipartial correlations are not used in SKDA but are well grounded in psychometric theory (Nunnally & Bernstein, Reference Nunnally and Bernstein1994). These statistics have a similar intent to RWA but have reduced correlations with item SDs to .24 in both cases.
An anonymous reviewer suggested another approach to SKDA, in which scale scores might be used as the predictors rather than individual items. The best fitting factor structure we found suggests that six scales can be formed using the data we studied. Studying the effects of SDs of the seven scales on SKDA metrics is problematic with such a small sample size (n=7 scales). Thus, it remains to be seen if SDs impact SKDA when scale scores are used (we also note the concomitant issue of SDs increasing by virtue of composite variance increasing as items are added, which is problematic when the scale lengths are different). Additionally, scales are by definition broader in nature in terms of topic and construct than individual items, which might make it more difficult for action planning to be conducted. In other words, it is likely more difficult to create an action plan for a group of approximately 10 items (measuring a collection of related but distinct topics) than for a single item. Although the impact of SDs on SKDA and scale score usage needs further investigation, the likely intervention development tactic, action planning, could very likely be undermined due to an inability to properly target the appropriate issues within the organization.
In our view, the correlation of SKDA metrics and item SDs exposes a major conceptual flaw with SKDA: Items that most employees identify as problem areas for the organization are less likely to be identified as drivers. Consider an organizational unit in which all respondents strongly disagree with a positively worded item. For the sake of argument, let us assume that in reality this item causes the criterion. Responses to this item have zero variance and, therefore, mathematically cannot covary or correlate with any criterion items. Thus, this item, despite its organizational relevance, can never be identified as a driver.
Issue 2: SKDA Capitalizes on Chance
SKDA examines the relationship between multiple items with a criterion item and then selects those items that best predict the criterion item. Essentially SKDA resorts to dustbowl empiricism. In our experience, a priori hypotheses are not made before the SKDA is conducted. Furthermore, sometimes SKDA uses stepwise regression, a practice that is strongly criticized in psychometrics literature because its true Type I error rate grossly exceeds its nominal Type I error rate (Cureton, Reference Cureton1950; Nunnally & Bernstein, Reference Nunnally and Bernstein1994). Psychometricians emphasize the importance of cross-validation whenever stepwise regression is conducted; yet, SKDA rarely takes this into account. Using the federal dataset, we found that shrinkage occurs when stepwise regression is used to select groups of five or 10 items, mainly when the data come from small organizations (defined as those organizations whose sample sizes were in the bottom third). After triple cross-validation, the validity coefficients for the predicted criterion scores dropped slightly from .81 to .74 when five items were selected and from .83 to .74 when 10 items were selected. The median sample size for the small organizations was 31; we suspect that shrinkage would be even higher at the work-unit level.
Issue 3: Rational and Even Random Item Selection Performs as Well as SKDA
Even when stepwise regression is not used, SKDA relies on a dustbowl empirical approach to selecting item as drivers; no a priori hypotheses are made concerning which items will or will not predict the criterion items. In contrast, psychometric theorists often recommend a rational approach to item development, taking into account past research on constructs measured by the items and the criterion. Even in instances where empirical methods are used in psychometrics and personnel selection, the importance of a priori and rational hypotheses regarding items is paramount. Church and Waclawski (Reference Church and Waclawski1998) made similar arguments in the context of linkage analysis (which is similar to SKDA except that an external criterion, such as turnover or profit, is used). They reinforce the importance of “logically” linking survey items to the criterion and recommend “a thorough review of the relevant literature regarding the variables to be linked and a solid research design” (p. 269). These arguments suggest that a rational approach to identifying survey key driver items is best.
We compared the validity of empirical and rational SKDA using the federal survey dataset. Three of the authors rationally rated each item with respect to its relationship with the criterion item and whether change can be actionable at the suborganization, organizational, or governmentwide level. The consistency of the ratings was measured using the intraclass correlation (3, k); a value of .611 (95% CI: .517 to .689) was obtained. We chose the five and 10 best items based on the rational key and compared it with the five and 10 item sets from the stepwise regression analysis. The five-item stepwise regression empirical method yielded a triple cross-validity of .83, which was only slightly higher than that from the rational approach (r=.79). When 10 items were selected, stepwise regression yielded a triple cross-validity of .82, compared with a validity of .81 from the rational key. Thus, rational ratings reasonably approximated the results of SKDA using stepwise regression.
In the spirit of Cureton's (Reference Cureton1950) classic article “Validity, Reliability, and Baloney,” we also came up with a rather bold idea for an analysis that yielded a shocking result. We selected five and 10 items from the federal survey using a random number generator and computed the validities. Selecting five and 10 items at random yielded validities (.74, in both cases) that were only slightly lower than empirical SKDA and that were similar to rational SKDA.
The success of empirical item selection is dependent on sample size, and many practitioners are in a position to conduct SKDA for small organizational units. Thus, we replicated this analysis using data from small organizational units, which were defined in the section covering Issue 2. After cross-validation, randomly selected items had the same validity as empirically selected ones when data from small organizational units were used. Thus, when stepwise regression is used, SKDA is little more effective than pulling the items out of a hat, especially for smaller samples. The same can be said for the correlational SKDA methodology. When we selected the items with the top five and 10 correlations with the criterion, the resulting criterion-related validities of the unit-weighted sum of these items were only slightly higher (the largest difference was .10 correlational units) than randomly chosen items.
Issue 4: A Survey's Latent Factor Structure Underlies SKDA Results
Considerations of the possible factor structure of an organizational survey are often missing from SKDA practice. Factor analysis has an important role in psychometrics, especially in examining the internal structure of an instrument. Psychometric theory posits that latent variables (or factors) underlie responses to items in an inventory (e.g., a test or employee survey). Confirmatory factor analysis (CFA) provides a method for testing the degree to which a given model specifying the underlying or latent variables for item responses explains the pattern of intercorrelations among items. Because employee surveys measure attitudinal constructs, it seems likely that they capture variance attributable to latent variables and that those latent variables should explain correlations between items. As mentioned earlier, SKDA involves correlating a set of predictor items with a criterion item. Psychometric theory predicts that at least some of the correlation between each predictor and the criterion item can be explained by a latent variable underlying the two items.
We found empirical evidence that the latent factor structure underlies SKDA results. We conducted a CFA on the governmentwide data based on the factor model validated by Cucina, Credé, Curtin, Walmsley, and Martin (Reference Cucina, Credé, Curtin, Walmsley and Martin2014), with the addition of a new factor covering 11 employee benefit items not studied by Cucina et al. (Reference Cucina, Credé, Curtin, Walmsley and Martin2014). This model yielded acceptable fit statistics (normed fit index=.989; χ2=1,327,518; df=2,387), suggesting that seven oblique factors underlie responses to the survey. We then examined the CFA model-implied correlations between each item and the criterion and the observed correlations. The correlations were strikingly similar; the difference between the correlations was small (mean difference <.01, median <.01, SD=.03, minimum=−.06, maximum=.06). Overall, the latent factor structure underlying the survey provides an alternative explanation for the correlations obtained using SKDA. An item may be identified as a driver not because it is driving responses to the criterion item but instead because it measures the same factor(s) as the criterion item.
Earlier we noted that SKDA metrics are biased by the SD of each item. This effect appears to have independence from that of the factor structure. We found that the factor structure and each item's SD independently predicted each item's observed correlation with the criterion. This was done by conducting a multiple regression analysis using the items as cases, each item's SD and factor loading as predictors, and each item's observed correlation with the criterion item as the criterion. For the bivariate SKDA, both the item's SD and its factor loading had significant β-weights, and the regression equation had a large effect size (R=.80, p<.01; β loading =.64, p <.01; β SD =.24, p=.01). This implies that the correlations between predictor items and the criterion item can involve two sources of variance: the SD of the predictor item and the factor loading. Thus, whether or not an item is identified as a driver (using the correlational SKDA methodology) depends on the item's SD and the item's factor loading.
As suggested by an anonymous reviewer, the underlying factor structure of a survey can lead to illusory evidence that addressing a driver item increases job satisfaction/engagement. Recall that the criterion item and the predictor items measure the same latent variable(s)/factor(s). Suppose that an organization identifies an item as a driver, conducts action planning to address that driver, and then observes an increase in job satisfaction/engagement with the next survey administration. It is possible that a third variable, a statistical effect such as regression to the mean, or an organizational behavior phenomenon such as the Hawthorne effect led to an increase in the underlying latent variable(s)/factor(s), which in turn caused observed scores on the predictor and criterion items to increase together. Regardless, one cannot infer that an increase in job satisfaction/engagement has been caused by an intervention designed to address a driver item (as we discuss later in this article).
Issue 5: SKDA Assumes Nonexistent Situational Specificity
SKDA is often performed for each organization that administers a survey; this analysis is performed even when identical item content is used across the different organizations. Many survey vendors now include SKDA as part of their default analysis packages for surveys, conducting them for each organization that completes the survey. This practice implies that the analysis is situationally specific, and that survey key driver items would be expected to vary across organizations. In essence, differences among sets of survey key driver items could be attributed to organizational variables, necessitating the use of SKDA for each organization that takes a survey.
This practice seems at odds with what we have learned from the psychometrics literature. A psychometric approach would posit that the survey items represent universal constructs, such as job satisfaction, and that the relationships between potential driver items and the criterion item should be generalizable across organizations. Although the scores on the survey items may vary across organizations, the construct measured by the items should be constant. Our argument parallels Schmidt and Hunter's (Reference Schmidt and Hunter1977) validity generalization (VG), whereby the validity of a test is not situationally specific and differences in validity coefficients are due to sampling error or established moderators. Note also that under VG, the validity of a test can be invariant across different situations; however, the mean test and criterion scores may differ significantly.
Indeed, when we examined the federal survey data, we found a lack of situational specificity. We compared the adjusted R and cross-validities of predicted values from suborganization, organization, and governmentwide regression equations. These results indicated that survey key driver items created at the governmentwide level have very similar validity (r=.84) to those created at the organization (r=.85) and suborganization levels (r=.85). Similar results were obtained when we computed the triple cross-validities for the stepwise regression SKDAs. The results for the five-item stepwise regressions were .83, .83, and .82 for the governmentwide, organization, and suborganization analyses. For the 10-item stepwise regressions, the triple cross-validities were .82, .82, and .81, respectively.
Further analyses indicated that some items are frequently identified as drivers almost regardless of the type and method of analysis used. Examples of the common driver items include “My work gives me a feeling of personal accomplishment,” “How satisfied are you with your involvement in decisions that affect your work?” and “Considering everything, how satisfied are you with your pay?” Overall, we found that the practice of conducting SKDA for different organizations is not empirically supported. Instead, it appears to be a waste of resources both on the side of those conducting the analysis and the side of those sponsoring the analysis (in terms of cost and time spent interpreting the results). If a survey vendor or provider wishes to use SKDA, the best approach would be to conduct the analysis one time using all available data, rather than for each client organization's administration. Although there were differences in the mean scores on the survey items across different organizations and suborganizations, the SKDA results tended to be quite similar. That said, a potential caveat to our findings is the use of data from only the U.S. federal government. Data from a more diverse database (e.g., survey responses from multiple countries and public and private sector organizations) might yield different findings.
Issue 6: SKDA Assumes Nonexistent Temporal Specificity
An SKDA is often performed each time a survey is administered to a single organization, suggesting that survey key driver items are temporally specific (i.e., not stable across time). Temporal specificity of survey key driver items is essentially an extension of the situational specificity issue described above; however, years are used as situations, whereas organizations were used as situations in the previous question. There is an intuitive appeal to temporal specificity as employee surveys measures attitudes and opinions, which may change over time.
Looking at the federal survey data, we did not find evidence of temporal specificity. We obtained survey responses for four years of survey administrations and conducted SKDA for each year. We then placed the key driver metrics into a new dataset and examined the interrelationships among the survey key drivers from year to year. At the governmentwide level, the bivariate and β-weight regression survey key driver metrics correlated across years at values approaching unity (rs=.99 and .98, respectively). In addition, we computed correlation coefficients between the dichotomous status (0, 1) of each item with respect to the top five and 10 items, and we conducted χ2 tests. Our results suggest strong correlations and evidence of contingency, especially for the governmentwide analyses. For the five-item stepwise regression, the correlation coefficient was 1.00 and χ2 was 65 (df=1, p <.01). For the 10-item stepwise regression, the correlation coefficient was r=.82 and χ2 was 39 (df=1, p <.01). In general, the survey key driver items were significantly correlated across years, indicating a degree of temporal generalizability. Thus, there is little empirical evidence to support the practice of conducting SKDA each year that a survey is administered. However, we recognize that follow-up research looking at longer time periods or at nonfederal organizations might yield slightly different results.
Issue 7: Multivariate Analyses Are Suspect When Variables Outnumber Observations
So far we have discussed the use of SKDA for data from large groups of employees. Additional problems can arise when the analysis is conducted for smaller groups, such as teams of workers. A recent article on SKDA suggested that one best practice proposed by SKDA users is to conduct the analysis at the lowest levels within an organization (i.e., the “team” level, Alonso & Wang, Reference Alonso and Wang2013, p. 93). In our view, organizations that conduct SKDA at the team level will likely have too few data points to obtain meaningful results. In our experience, most work units have at most 10–15 employees reporting to one supervisor. Consider the 71-item federal survey used in our examples; when completing this survey, the 10–15 employees would respond to a total of 71 predictor items and the criterion. The ratio of respondents to variables (i.e., 10–15 to 71) presents five additional psychometric issues for SKDA.
First, traditional parametric statistics (e.g., Pearson's r) cannot be used effectively with fewer than 30 cases; instead, nonparametric statistics (e.g., Spearman's ρ) should be used. A second issue is statistical power. Even if a work unit was sufficiently large (e.g., at least 30 survey respondents) for parametric statistics, the power for detecting a significant correlation is low; one would need 50 survey respondents in order to detect a significant correlation of .48 (the mean observed correlation in our results) with 95% power. An even greater number of cases are required for sufficient power for determining whether one survey driver correlation is significantly different than another. Using the average interitem correlation from the 2008 dataset (.40) and the average correlation with the criterion (.48), to achieve 95% power, totals of (a) 1,824, (b) 200, and (c) 72 survey respondents would be required to detect (a) small (q=.10), (b) medium (q=.30), and (c) large (q=.50) effect sizes for the differences between the two correlation coefficients (using q as described in Cohen, Reference Cohen1992). (We note that nonparametric statistics further exacerbate the issues with low power since they have less power than parametric statistics.)
Third, in small samples the confidence intervals around a point estimate of a correlation are quite large. With 30 cases and a true correlation of .48, the values within the 95% confidence interval would range from .15 to .72. Fourth, regression-based analyses are problematic when there are more variables (i.e., the 71 items) than cases (i.e., the 10–30 survey respondents per work unit). Both least squares multiple regression and RWA require the inversion of the correlation matrix between the item variables (i.e., the matrix algebra equivalent to taking the reciprocal of a number). Consequently, the correlation matrix in this situation (i.e., 71 variables and 10–30 cases) would be a singular matrix (i.e., the matrix algebra equivalent to zero) and could not be inverted (i.e., the matrix algebra equivalent of dividing by zero). Fifth, even if the number of items was reduced (e.g., to 12) at the work unit level, the ratio of group sample size to survey items entered as predictors (n:k) would yield uninterpretable regression coefficients, if any are estimated (Cohen & Cohen, Reference Cohen and Cohen1983). In fact, a regression analysis conducted on a set of randomly generated data with n cases, one criterion, and n − 2 predictors (which is just barely enough to avoid singularity) will yield a nonsignificant R 2 ≈ 1.0.
Issue 8: Correlation ≠ Causation
The ultimate aim of SKDA is to identify areas (represented by items) in which an organization can focus action-planning efforts to improve overall job satisfaction or employee engagement. Essentially, SKDA identifies items that are driving job satisfaction or employee engagement up or down within an organization. This interpretation is also consistent with the use of the word “driver,” which is defined as “something that makes other things progress, develop, or grow stronger” in the Cambridge Dictionary (Cambridge University Press, 2016). Although we realize that not all practitioners who use SKDA believe that the driver items reflect underlying causal issues, the word “drive” and the emphasis on addressing driver items in action planning might imply causation to stakeholders.
No doubt, the vast majority of I-O psychologists are familiar with the tenet “correlation is not causation,” yet the practice of conducting a SKDA and assuming that the driver items are causing job satisfaction or employee engagement seems to contradict this tenet. Unfortunately, causation cannot be established using the observational and correlational approaches inherent in SKDA. If a survey vendor decides to use SKDA, despite the issues we identified above, they should always caveat the findings with a disclaimer that the results are correlational not causational. If we as a field want to provide organizational leaders with the causes of job satisfaction or employee engagement, then we need to conduct experiments (with random assignment) and employ the scientific method to establish causation. Such applied research could prove fruitful for I-O psychologists, who could partner with organizations to conduct the experiments or summarize existing experiments using meta-analysis.
Should I-O Psychologists Conduct SKDA?
SKDA is seductive because it provides the illusion of an easy answer to questions about the causes of an organization's overall level of job satisfaction or employee engagement. In our discussion, we identified eight issues concerning the use of SKDA. Many of these issues incorporate fundamental findings in the psychometrics literature. It remains to be seen whether these issues can be addressed to make SKDA a more issue-free practice. We hope that our discussion will raise the awareness of those using SKDA of the issues stemming from its use. Many may decide to halt use of SKDA, as we have done ourselves. Those who continue to use SKDA should consider its serious limitations and accordingly frame their presentations of survey results to organizational leaders.
Over the course of history, new analysis techniques have evolved. Consider the emergence of item response theory and CFA. Ordinarily when new analyses are developed, they undergo rigorous testing (e.g., Monte Carlo simulations, formulaic derivations) before being used. Ideally, published empirical, theoretical, and simulation papers will appear in the peer-reviewed literature before a new analytic tool is put into practice. In conducting our literature searches for this focal article, we found surprisingly few examples of this work. The review article by Scherbaum et al. (Reference Scherbaum, Putka, Naidoo, Youssefnia and Albrecht2010) stands out as an exception. Despite the relatively small and insufficient research base to support SKDA, I-O psychologists have been putting SKDA into practice. In our opinion, SKDA is an example of practice moving ahead of—and beyond—science. Also, as suggested by an anonymous reviewer, SKDA may tempt organizational leaders to accept quick and easy answers rather than having to dig deeper and engage in discussions with their employees about the underlying issues impacting them.
What Other Approaches Exist?
Given the issues with SKDA, practitioners likely will need to turn to other approaches for guiding the development of action plans. Several existing approaches have been described in the literature and have enjoyed extensive use. The Office of Personnel Management (Berry, Reference Berry2012) has prepared a public-domain document that provides concise guidance on interpreting survey results, conducting follow-up analyses (including the use of focus groups and open-ended surveys), and performing action planning. Though geared toward executives, this document has much to offer I-O practitioners. Other approaches include holding strategic meetings with senior leaders (Church & Oliver, Reference Church, Oliver and Kraut2006; Wiley, Reference Wiley2010) and asking employees to rate the importance of different issues on their job satisfaction (Church & Waclawski, Reference Church and Waclawski1998; Society for Human Resource Management, 2012). These approaches can be used in addition to, or as a replacement for, SKDA.
Our Proposed New Approach
As an alternative to SKDA, we propose that by following the steps of the scientific method, which implies the adoption of the belief that surveys are themselves psychometric instruments similar to selection assessments, I-O psychologists can implement a more sound approach to identifying the root causes of job satisfaction or employee engagement.
Step 1: Identify targets for intervention
As a first step once a survey has been conducted, scientist–practitioners could examine the survey results to identify those organizations (or suborganizations) that would benefit most from action planning (i.e., identify the population to research). The target organization's responses on individual items and on scales would be compared with those of other organizations (e.g., using a normative database). After partialling out any factor-related variance and examining the statistical significance and effect sizes of any differences between the target organization and the normative comparison group, practitioners could identify “red flags” or areas in which the target organization scored substantially lower than comparison groups.
Step 2: Develop hypotheses to explain the survey results
Assuming that the target organization has areas in need of improvement, the next step would be to develop hypotheses about reasons for low scores on items or scales. Existing findings from the organizational psychology research literature provide one source for hypothesis generation. A second source of hypotheses, contextual and local information from the organization, can be gained through structured qualitative research techniques such as free-response survey questions, facilitator-led focus groups, verbal protocols/cognitive interviews with survey respondents (Barber & Roehling, Reference Barber and Roehling1993; Ericsson & Simon, Reference Ericsson and Simon1993; Robie, Brown, & Beaty, Reference Robie, Brown and Beaty2007; Trickett & Trafton, Reference Trickett, Trafton, Schmorrow, Cohn and Nicholson2009), and interviews with organizational members. For example, in gaining information about organizational communications, one might include the following questions:
70% of employees indicated that they do not have enough information to their jobs well. What information are you lacking in order to do your job well? Why do you think you are not receiving the information? What do you think management should do to better inform employees?
Ideally, a survey researcher would collect information from employees at all levels of the organization (e.g., nonsupervisory employees, supervisors/managers, executives). Hypotheses can also be generated by benchmarking the organization's policies and practices against those of similar organizations.
Step 3: Design organizational interventions
Once hypotheses have been generated, organizational interventions can be designed. As is the case for laboratory experiments, some of the interventions may not be feasible or practical to implement. For example, in an organization undergoing bankruptcy proceedings it might not be feasible to increase employee monetary awards. Instead, an intervention that involves informing and educating employees on the realities facing the organization might have to be used.
Step 4: Implement the intervention
Once designed, the intervention can be implemented using Cook and Campbell's (Reference Cook and Campbell1979) work on quasi-experimental design as a guide. From a scientific perspective, to establish causality, employees should be randomly assigned to either receive the intervention or be in a control group. After a sufficient period has elapsed, the survey would be readministered, and the resulting data for the two groups would be compared using a t test and a measure of effect size. If the hypothesized improvement in survey results fails to emerge, the scientist–practitioner must look to an alternate explanation for poor survey results and develop new hypotheses.
Cook and Campbell (Reference Cook and Campbell1979) aptly describe the difficulties of conducting true experiments in field settings. Their guidance suggests the need to extend an organizational intervention to all employees. However, they warn that improvements in the outcome variable (job satisfaction or engagement results in our case) cannot be attributed to the intervention. The client organization would consider this to be a moot point, if the original problem (i.e., low employee job satisfaction or engagement results) no longer exists. Likewise, if employee job satisfaction or engagement remains low, new hypotheses must be generated. However, it would be impossible to rule out the possibility that the intervention was successful but its effects were offset by another variable.
Toward a theory of the causes of job satisfaction or employee engagement
We recognize that our scientific approach is more laborious than conducting a SKDA and could result in organizational spend levels that exceed feasibility. Our approach is perhaps best considered to be an ideal state. At a minimum, an improvement on the current SKDA methodology that is rooted in scientific study and the use of at least some of the steps serves to enhance the potential for meaningful outcomes and interventions. This scientific approach is consistent with methodology used in other applied settings, such as the use of randomized control trials in the pharmaceutical industry. Further, if I-O psychology as a field can identify interventions that have a causal effect on job satisfaction or employee engagement, there will be less of a need for further experimental work on this topic (i.e., the additional work to identify causes could be a temporary effort). Ideally, the field should aim to develop scientific theories that describe the interventions that cause changes in job satisfaction or employee engagement. This needs to be accomplished via primary studies, replications, and finally meta-analysis. Without experimental work establishing true scientific theories of the causes of job satisfaction or employee engagement, we as a field cannot provide organizations with effective and empirically based guidance.
Conclusion
In summary, we outlined eight issues concerning the use of SKDA that appear neglected in the literature and in practice. Most notably, we established that the identification of an item as a key driver largely depends on the SD of responses to that item and its loading on the factors underlying the survey responses. Furthermore, the results of SKDA tended to be stable across different organizations and different survey administrations, suggesting that organizations should not conduct SKDA driver items with each administration. Perhaps most problematic, randomly chosen items predicted the criterion about as well as the driver items! We suggest that practitioners think deeply about conducting SKDA and that the field move to establishing causational inferences about the “drivers” of job satisfaction or employee engagement rather using correlational designs and analyses.
Of course, our article is not intended to be the final word on SKDA. Instead we view it as the beginning of a discussion about the appropriateness of SKDA and more overarching issues concerning the use of organizational survey results to improve organizational functioning. There are a number of questions and topics that I-O psychologists can consider and debate on concerning SKDA, including the following:
-
• What should I-O practitioners conduct instead of SKDA to answer client's questions about where to focus action-planning efforts?
-
• Why have I-O academics not studied SKDA extensively?
-
• What scientific evidence exists that SKDA is effective?
-
• Why are we using statistical analyses when other more direct approaches are available?
-
• As a common practice, why is the development of organizational surveys not guided by psychometric theory more often?
In closing, we hope that our article will increase awareness of the issues concerning SKDA and prompt the field to think more deeply about the analysis and its alternatives.
Appendix A: Methodology
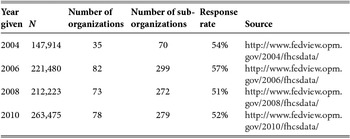
We used an archival dataset of 212,223 civilian, full-time, permanent, U.S. federal government employees who participated in a federal governmentwide survey in 2008 for most of the analyses. Seventy-three federal government organizations participated in the survey. The dataset was further broken down into 272 suborganizations. The organizations represented have diverse workforces and missions, ranging from law enforcement agencies to scientific organizations and to quasi-public organizations such as the Pension Benefit Guaranty Corporation. One analysis also used datasets for the 2004, 2006, and 2010 administration of the survey. Table A1 provides background information on the four administrations of the survey.
Administration Information for Each Survey

The survey items are provided in Appendix B, Table B1. All items used polytomous 5-point Likert scale response formats. Several of the items are used in a consortium of employee survey administrators. The criterion item was “considering everything, how satisfied are you with your organization?” Cucina, Credé, Curtin, Walmsley, and Martin (Reference Cucina, Credé, Curtin, Walmsley and Martin2014, Study 3) have studied the correlation between responses to the 2012 administration of the survey items and suborganizational level turnover rates. Using their data, the criterion item had a correlation of −.21 (p<.01) with turnover rates. Using data from Rodriguez, Usala, and Shoun (Reference Rodriguez, Usala and Shoun1995), Cucina et al. (Reference Cucina, Credé, Curtin, Walmsley and Martin2014, Study 4) studied the correlation between responses to another federal employee survey and supervisory ratings of job performance (using a research-based administration of the Descriptive Rating Scale; U.S. Department of Labor, 1974). A differently worded version of this criterion item (“Considering everything, how would you rate your overall satisfaction in the organization?”) had an average correlation of .13 (p<.01) with the seven performance-related questions in the scale. Two other possible criterion items, “Considering everything, how satisfied are you with your job?” (which correlated −.28, p<.01, with turnover rates and had an average correlation of .18, p<.01, with the seven performance-related questions) and “I recommend my organization as a good place to work” (which correlated −.32, p<.01, with turnover rates and was not included in the study with performance data) were not included as predictors. Using these two items as the criterion for SKDA did not change the conclusions reported in the focal article. Additionally, an index was created by summing the three criterion items. This index had a coefficient alpha of .89. When aggregated to the suborganization level, it had a coefficient alpha of .96 and correlated −.27 (p<.01) with turnover rates.
Survey key driver items were identified using multiple approaches. Many analyses used individual employees as cases. In these analyses, correlation coefficients between each item and the criterion item were obtained separately for (a) each suborganization, (b) each organization, and (c) across the entire federal government. Second, standardized regression coefficients were obtained when all items were entered into regression equations using the criterion item; the R2 and adjusted R2 values were recorded. Third, two stepwise regression analyses (one identifying five items, the other 10 items) were conducted. Fourth, three of the authors rationally rated each item with respect to its relationship with the criterion item and whether change can be actionable at the suborganization, organizational, or governmentwide level. The consistency of the ratings was measured using the intraclass correlation (3, k); a value of .611 (95% CI: .517 to .689) was obtained. Fifth, partial, semipartial, and RWA coefficients were obtained. According to Johnson and LeBreton (Reference Johnson and LeBreton2004), two types of RWA statistics are available (raw and rescaled); because the rescaled weights are a linear transformation of the raw weights, we only report results for the raw weights. In additional analyses, the item responses for employees in an organization or suborganization were aggregated to create organizational and suborganizational level data. In these analyses, each case consisted of the average scores (across all employees) for each organization or suborganization on the items.
Other analyses incorporated results of a CFA of the survey by Cucina et al. (Reference Cucina, Credé, Curtin, Walmsley and Martin2014, Scheme A). Cucina and his colleagues found that a six factor grouping of the items (My Work Experience, My Work Unit, My Agency, My Supervisor/Team Leader, Leadership, and My Satisfaction) yielded the best fit in the 2010 and 2011 dataset. We applied this model to the 2008 dataset, which included 14 additional items not studied by Cucina et al. Three of these additional items were rationally assigned to factors by the first author, and a set of 11 items covering satisfaction with federal employee benefits were assigned to a seventh factor. An oblique model that allowed all seven factors to intercorrelate and included a path from each factor to the criterion was used. Using the unweighted least squares (ULS) estimation procedure in AMOS (Brown, Reference Brown2006), we tested this model at the individual, suborganizational, and organizational levels. Polychoric correlations were used for the individual-level analyses (see Wirth & Edwards, Reference Wirth and Edwards2007), and Pearson correlations were used for the suborganization and organization-level analyses.
Appendix B
Survey Items for 2004, 2006, 2008, and 2010 FHCS Datasets