



1 Introduction
In world’s languages, stop consonants produced at the same place of articulation are often differentiated by a phonological contrast traditionally known as ‘voicing contrast’. In this tradition, the contrasting segments are classified as either voiced or voiceless. Acoustic correlates of this contrast include voice onset time (VOT), percent voicing (voicing ratio, VR), fundamental frequency (f0), frequencies of the first (F1) and second (F2) formant, constriction duration, or the length of the neighboring vowel. Among these, VOT (Lisker & Abramson Reference Lisker and Abramson1964) is mainly considered the primary acoustic correlate of the voicing contrast in stop consonants in word-initial position. Laryngeal realism (LR) theory (Iverson & Salmons Reference Iverson and Salmons1995, Honeybone Reference Honeybone, van Oostendorp and van de Weijer2005, Beckman et al. Reference Beckman, Helgason, McMurray and Ringen2011, Beckman, Jessen & Ringen Reference Beckman, Jessen and Ringen2013) closely reflects VOT typology and directly maps privative phonological features [voice] or [spread glottis] on the VOT categories, such as voicing lead (prevoicing) or long voicing lag.
The mapping between a VOT category and the corresponding phonological feature is direct and straightforward in word-initial position, but it becomes less obvious in other prosodic positions. For example, aspiration in voiceless stops is often reduced in intervocalic position (Lisker Reference Lisker1986) or even lost after [s] in English (Iverson & Salmons Reference Iverson and Salmons1995). Thus, for word medial position, other acoustic correlates, such as duration and percent of closure voicing (Slis Reference Slis1986, Beckman et al. Reference Beckman, Jessen and Ringen2013, Schwarz, Sonderegger & Goad Reference Schwarz, Sonderegger and Goad2019) or duration of the adjacent vowel (Lisker Reference Lisker1986), become more important to differentiate between voiced and voiceless stops in English.
To support direct mapping of the phonetic realization of the voiced and voiceless sounds onto phonological features, LR employs several diagnostics of speakers’ ‘control’ (Schwarz et al. Reference Schwarz, Sonderegger and Goad2019), which include the effect of speech rate manipulation on VOT measurements. According to the literature (Solé Reference Solé1992, Pind Reference Pind1995, Kessinger & Blumstein Reference Kessinger Rachel and Blumstein1997, Allen & Miller Reference Sean and Miller1999) the duration of the phonetic correlates for the specified features increases as the rate of speech slows down. For the voicing contrast across languages, this typically results in asymmetric changes in VOT duration, when VOT increases only in a phonologically specified voiced or aspirated category, but not in an unspecified category (Beckman et al. Reference Beckman, Helgason, McMurray and Ringen2011).
While studying the effects of rate manipulation on VOT in initial stops is a well-established procedure within the framework of LR, very few studies looked into voicing of word-medial stops, where acoustic correlates such as percent closure voicing or duration of a preceding vowel can be more salient than VOT (Lisker Reference Lisker1986). A recent study of voicing in Nepali (Schwarz et al. Reference Schwarz, Sonderegger and Goad2019) demonstrates that closure voicing in intervocalic stops also changes in response to rate manipulation in line with VOT patterns in initial stops. Therefore, a comprehensive study of a laryngeal contrast in a language in the framework of LR must include not only investigation of VOT categories but also the degree of voicing in intervocalic stops.
Although VOT is traditionally viewed as the main cue to voicing across languages, recent studies suggest it can signal other phonological contrasts as well. In some vernacular Arabic dialects, e.g. Qatari Arabic (Kulikov Reference Kulikov2020, Reference Kulikov2022), voicing lead and long lag VOT are used in an over-specified laryngeal contrast similar to Swedish, but short lag VOT is consistently found in production of voiceless emphatic stop [tˁ]. This distribution of VOT categories makes short lag VOT a cue not to voicing but to a contrast in emphasis, or pharyngealization (Kulikov Reference Kulikov2022). To the best of our knowledge, there are no studies that investigated this case in depth.
It is of note, that some other Arabic dialects, e.g. Khuzestani Arabic (KhA; Bahrani Reference Bahrani2022), also reveal a similar pattern. KhA is a Mesopotamian Arabic variety spoken in the southwest of Iran. The consonantal system of this language contains three voiced stops /b d ɡ/ with voiceless counterparts /p t k/, and two guttural plosives /tˁ q/ which have no voiced counterparts (Bahrani & Modarresi Ghavami Reference Bahrani and Modarresi Ghavami2021, Leitner & Bahrani, forthcoming). Although in this variety the voicing contrast is between prevoicing and long lag VOT, the short lag pattern also exists as it is employed in the realization of /tˁ q/ (Bahrani Reference Bahrani2022). Hence, this language is a convenient case to study the mapping of VOT on more than one phonological contrast in a language. In this paper, we are looking into the laryngeal feature specification in KhA based on LR and provide new evidence in support of a tight correspondence between the phonological features and their phonetic realization.
2 Background
2.1 Acoustic correlates of laryngeal contrast
As mentioned earlier, voice onset time (VOT) has the greatest acceptance as the primary phonetic attribute to voicing in utterance-initial plosives (Lisker & Abramson Reference Lisker and Abramson1964). It is a temporal correlate referring to the time interval between the stop release and the start of quasi-periodicity which indicates the presence of laryngeal vibration. If voicing onset occurs before the release, VOT is negative; when phonation happens after the release phase, VOT is positive; and if both vocal fold vibration and the stop release are simultaneous, VOT is considered zero. In utterance-initial position, languages use contrastive stops from these VOT categories: truly voiced stops with voicing lead/prevoicing; voiceless unaspirated stops with short lag VOT, and voiceless aspirated stops with long lag VOT.
Languages show variation in how the three categories of VOT correlate with phonological categories of voiced and voiceless stops, as indicated in Table 1. In languages with a two-way laryngeal contrast, the contrast is often either between voicing lead and short lag, or between short lag and long lag, or between voicing lead and long lag. Languages employing the former contrast are referred to as true voice languages, for example French (Tranel Reference Tranel1998: 131), Fenno-Swedish (Ringen & Suomi Reference Ringen and Suomi2012), or Russian (Ringen & Kulikov Reference Ringen and Kulikov2012). Languages utilizing the second type are known as aspirating languages, e.g. English (Lisker & Abramson Reference Lisker and Abramson1964), German (Jessen & Ringen Reference Jessen and Ringen2002), or Persian (Bijankhan & Nourbakhsh Reference Bijankhan and Nourbakhsh2009). Finally, some languages utilize the two opposite ends of the VOT continuum, i.e., voicing lead and long voicing lag. Until recently, the existence of such a contrast was considered implausible (Iverson & Salmons Reference Iverson and Salmons1995) or rare (Beckman et al. Reference Beckman, Helgason, McMurray and Ringen2011) because it would require an over-specified representation with both phonological features [voice] and [sg]. However, a growing number of studies reveal that this type of contrast is not uncommon across languages. Among languages exhibiting the contrast between prevoiced stops and stops with long lag VOT, Swedish (Helgason & Ringen Reference Helgason and Ringen2008), Southern American English (Hunnicutt & Morris Reference Hunnicutt and Morris2016), Najdi Arabic (AL-Gamdi, Al-Tamimi & Khattab Reference AL-Gamdi, Al-Tamimi and Khattab2019), and Qatari Arabic (Kulikov Reference Kulikov2020) have been investigated within LR. Studies of stop voicing also suggest that this type of contrast may exist in Turkish (Öğüt et al. Reference Öğüt, Akif Kiliç, Zeki Engin and Midilli2006), Ilami Kurdish (Abbaasian & Nourbakhsh Reference Abbaasian and Nourbakhsh2015), and Sorani Kurdish (Ahmed Reference Ahmed2019).
Mapping of VOT on phonological categories across laryngeal contrasts in stops.

In addition, languages can possess either a three-way or a four-way laryngeal contrast. Languages with a three-way contrast, e.g. Eastern Armenian (Amirian Reference Amirian2017, Seyfarth & Garellek Reference Seyfarth and Garellek2018), Hakha Chin (Lee & Harper Berkson 2019), Thai (Kessinger & Blumstein Reference Kessinger Rachel and Blumstein1997), or Kurmanji Kurdish in Khorasan (Zirak Reference Zirak2014), utilize all three VOT categories. Languages with a four-way contrast, e.g. Hindi, Marathi (Lisker & Abramson Reference Lisker and Abramson1964), Urdu (Hussain Reference Hussain2018), or Nepali (Schwarz et al. Reference Schwarz, Sonderegger and Goad2019) also utilize all three VOT categories, but the voiced aspirated series is articulated both with prevoicing and superimposed aspiration after stop release (Schwarz et al. Reference Schwarz, Sonderegger and Goad2019).
As a temporal cue, VOT has been shown to be sensitive to prosodic context. It tends to be more prominent in word-initial position than word-medially (e.g. Lisker & Abramson Reference Lisker and Abramson1964, for English, but see Ringen & Kulikov Reference Ringen and Kulikov2012, who did not find difference in VOT between the two positions in Russian). Speech rate also affects realization of VOT so that duration of prevoicing and long lag VOT is increased in slow speech and decreased in fast speech (Kessinger & Blumstein Reference Kessinger Rachel and Blumstein1997). Recent studies have shown that VOT (aspiration) in word-medial stops responds to changes in speech rate in the same fashion as in initial position (Schwarz et al. Reference Schwarz, Sonderegger and Goad2019).
The voiced–voiceless distinction in word-medial stops has additional acoustic correlates: duration of glottal pulsing during closure (Lisker & Abramson Reference Lisker and Abramson1964, Docherty Reference Docherty1992), percent closure voicing (Lisker Reference Lisker1986) and duration of an adjacent vowel (Chen Reference Chen1970). Voiced stops are typically articulated with glottal pulsing during closure, although it is not uncommon for them to be voiced only for part of closure duration (Docherty Reference Docherty1992, Beckman et al. Reference Beckman, Jessen and Ringen2013). Although closure voicing in intervocalic stops is often viewed as a functional equivalent to voicing lead (prevoicing) in initial stops, their phonetic realization is not always identical. While onset of prevoicing typically occurs before the release so that glottal pulsing continues into the vowel, glottal pulsing in intervocalic stops can continue from the preceding vowel and cease in the middle of closure (Davidson Reference Davidson2016). As a result, a voiced stop can occasionally have a partially voiced closure and a voiceless release. It is of note that incomplete closure voicing is often found in voiced stops in aspirating languages (Docherty Reference Docherty1992).
Voiceless stops can also have a short voicing tail into the closure that continues from a preceding vowel, but they are typically voiceless for the most part of closure duration. The ratio of duration of glottal pulsing to closure duration (also voicing ratio, VR) is often used to evaluate the degree of closure voicing in intervocalic stops. Stops that are voiced for more than 50
 $\%$
of their duration are typically interpreted as voiced, and shorter voicing ratio is characteristic of voiceless stops (Slis Reference Slis1986). A recent study of voicing in intervocalic stops in Nepali (Schwarz et al. Reference Schwarz, Sonderegger and Goad2019) reveals that closure voicing is also sensitive to speech rate manipulation. Glottal pulsing in phonologically voiced stops becomes longer in slow speech and shorter in fast speech to ensure that voicing continues during the entire closure.
There are several acoustic correlates whose role in the voiced–voiceless distinction is generally considered secondary. F0 (Haggard, Ambler & Callow Reference Haggard, Ambler and Callow1970) and F1 (Liberman, Delattre & Cooper Reference Liberman, Delattre and Cooper1958) at the onset of the following vowel are two much discussed secondary correlates at this word position. Generally, voiced stops are typically associated with lower values of f0 (e.g. House & Fairbanks Reference House and Fairbanks1953, Ohde Reference Ohde1984) and F1 (e.g. Liberman et al. Reference Liberman, Delattre and Cooper1958, Summerfield & Haggard Reference Summerfield and Haggard1977) compared to the voiceless category. Although lower F1 is usually associated with voicing, the reasons behind this differ in true voice and aspirating languages. F1 lowering after phonologically voiced stops is usually attributed to the expansion of the vocal tract due to larynx lowering (Westbury Reference Westbury1983) or advancement of the tongue root (Westbury Reference Westbury1983, Kingston et al. Reference Kingston, Macmillan, Walsh Dickey, Thorburn and Bartels1997) aimed at creating rarefaction in the expanded supraglottal cavity in order to maintain effective glottal pulsing (Westbury & Keating Reference Westbury and Keating1986). Higher F1 after voiceless aspirated stops is a result of a delay in F1 transition (F1 cutback) after longer VOT (Stevens & Klatt Reference Stevens and Klatt1974, Summerfield & Haggard Reference Summerfield and Haggard1977).
Researchers provided different phonetic explanations for f0 and F1 variation in voiced and voiceless stops. According to some (e.g. Ladefoged Reference Ladefoged1973, Hombert, Ohala & Ewan Reference Hombert, Ohala and Ewan1979, Löfqvist et al. Reference Löfqvist, Baer and McGarr1989, Stevens Reference Stevens1998), the effect of voicing on f0 and F1 is an automatic consequence of the articulatory and/or aerodynamic conditions involved in voicing production, such as the tenseness of the vocal folds, the height of the larynx, or cutback of formant transition. Therefore, this variation is not directly controlled by the speakers. Other researchers have claimed in favor of an intentional and phonologically determined relationship between f0/F1 variations and VOT (Ohde Reference Ohde1984, Kingston & Diehl Reference Kingston and Diehl1994, Dmitrieva et al. Reference Dmitrieva, Liano, Shultz and Francis2015). Furthermore, it was shown that the onset f0 and F1 enhance the perception of voicing in voiced stops (e.g. Liberman et al. Reference Liberman, Delattre and Cooper1958, Summerfield & Haggard Reference Summerfield and Haggard1977, Benkí Reference Benkí2001).
F2 transition is not often mentioned as a phonetic correlate of voicing, but some sources indicate that higher F2 is yet another acoustic aftermath of expansion of supraglottal cavity and advancement of the tongue root in voiced stops (Westbury Reference Westbury1983, Ahn Reference Ahn2018). This cue can be most noticeable in coronal stops, when voiced [d] is articulated closer to the dental area as the tongue is pushed forward as a result of expansion in the pharyngeal area (Bolla Reference Bolla1981, Ahn Reference Ahn2018). In a language that contrasts voiced or voiceless stops to their emphatic, or pharyngealized counterparts, F2 may become an important cue as it was shown to be lower in Arabic pharyngealized stops due to retraction of the tongue root (Ghazeli Reference Ghazeli1977, among others).
2.2 Traditional approach vs. laryngeal realism
Phonemic representation of laryngeal features among obstruents has been a topic of debate in phonological literature. Based on the physiological settings involved, Chomsky and Halle (Reference Chomsky and Halle1968, 328) defined four binary features to represent laryngeal contrasts in world’s languages: [±tense], [±voice], [±heightened subglottal pressure], and [± glottal constriction]. Halle & Stevens (Reference Halle and Stevens1971) proposed a different set of four binary features, namely [±spread glottis], [±constricted glottis], [±stiff vocal folds], and [±slack vocal folds]. While the two proposals could explain cross-linguistic differences in voicing and aspiration, they clearly lacked ‘simplicity’, one of the fundamental principles in the generative phonology. Later scholars mainly employed [±voice] (Keating Reference Keating1984, Kingston & Diehl Reference Kingston and Diehl1994) to explain voicing patterns across languages. The approach used in all these models is known as the ‘traditional approach’ (TA) (Honeybone Reference Honeybone, van Oostendorp and van de Weijer2005).
In TA, voicing contrast is displayed with the help of binary phonological features denoting the presence or absence of a feature with two values which have equal status. The phonetic realization of laryngeal contrast in terms of VOT (prevoicing or aspiration) is a function of language-specific rules of phonetic implementation. In Keating’s (1984: 291) model, for instance, the binary feature [±voice] is phonetically implemented with three phonetic categories: {voiced} meaning fully voiced, {voiceless aspirated}, and {voiceless unaspirated}. As a result, voiced series is specified by [+voice] both in true voice and aspirating languages despite the fact that they are implemented by different VOT categories. In other words, VOT in TA is a phonetic detail not specified phonologically.
An alternative view to laryngeal representation which has recently received some significant attention is known as laryngeal realism (LR) (Honeybone Reference Honeybone, van Oostendorp and van de Weijer2005, Beckman et al. Reference Beckman, Helgason, McMurray and Ringen2011, Beckman et al. Reference Beckman, Jessen and Ringen2013). Three types of evidence are usually considered to justify feature specification in LR: the phonetic realization of the segments in word initial position in terms of VOT patterns, diagnostics of speakers’ control observed as effects of speech rate on VOT duration and the degree of intervocalic voicing, and phonological markedness and patterning of the segments (Schwarz et al. Reference Schwarz, Sonderegger and Goad2019).
LR is considered a phonetically-informed framework that employs privative laryngeal feature [voice] for voicing lead and [sg] for long lag VOT. The most common VOT pattern, short lag category, is claimed to be unmarked, or phonologically unspecified (Iverson & Salmons Reference Iverson and Salmons1995).Footnote 1 This set of features directly encodes VOT typology in the word-initial position, where phonetic correlates are maximally contrastive (Schwarz et al. Reference Schwarz, Sonderegger and Goad2019), and it is assumed to account for most common VOT patterns among languages,Footnote 2 as shown in Table 2.
Cross-linguistically, it has been shown that temporal phonetic correlates mirroring phonological specifications tend to have longer duration in slower speech, while the unspecified categories remain unchanged. This behavior was found for oral and nasal vowels (Solé Reference Solé1992), long and short vowels (Pind Reference Pind1995), pre- and (post)aspiration (Pind Reference Pind1995, Kessinger & Blumstein Reference Kessinger Rachel and Blumstein1997, Allen & Miller Reference Sean and Miller1999), and voicing (Kessinger & Blumstein Reference Kessinger Rachel and Blumstein1997, Beckman et al. Reference Beckman, Helgason, McMurray and Ringen2011, Schwarz et al. Reference Schwarz, Sonderegger and Goad2019), among others. LR argues that speech rate manipulation only influences segments specified with [voice] and [sg], but not phonologically unspecified segments (Beckman et al. Reference Beckman, Helgason, McMurray and Ringen2011, Morris Reference Morris2018, Schwarz et al. Reference Schwarz, Sonderegger and Goad2019, Kulikov Reference Kulikov2020). This effect was first found both in languages with two-way and three-way laryngeal systems. But recently, Schwarz et al. (Reference Schwarz, Sonderegger and Goad2019) demonstrated that in the production of voiced aspirated stops in Nepali, a language with a four-way voicing contrast, both voicing lead and long lag become longer when lowering speech rate.
Laryngeal representation of four types of stops according to laryngeal realism.
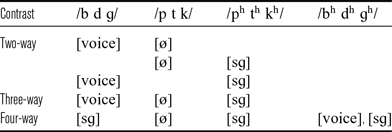
The degree of voicing in intervocalic stops is another diagnostic of speakers’ control over realization of laryngeal features (Beckman et al. Reference Beckman, Jessen and Ringen2013). The [voice]-specified voiced stops in true voice languages typically show active intervocalic voicing being produced with a fully voiced closure (Jansen Reference Jansen2004, Ringen & Kulikov Reference Ringen and Kulikov2012). The requirement to actively maintain glottal pulsing in [voice]-specified stops may explain the fact that speakers tend to produce them with fully voiced closure both in slow and fast speech. But phonologically unspecified voiced stops in aspirating languages display passive voicing next to a sonorant segment (Jansen Reference Jansen2004). As a result, unspecified stops in these languages show variable or incomplete glottal pulsing being voiced only 62
 $\%$
of the time (Beckman et al. Reference Beckman, Jessen and Ringen2013).
In contrast, both [sg]-specified and unspecified voiceless stops block intervocalic voicing by displaying voicing only in 10–30
 $\%$
of the closure. As production of the intervocalic aspirated voiceless stops requires the significant opening in the glottis, the blocking of voicing from the preceding vowel is indeed expected. But the absence of passive voicing in unspecified voiceless stops in true voice languages is still an unanswered question in LR. Several explanations have been suggested. In line with generative formalism of Chomsky & Halle (Reference Chomsky and Halle1968), Beckman et al. (Reference Beckman, Jessen and Ringen2013) argue that passive voicing in unspecified voiceless stops is blocked as a result of a language-specific rule that turns a privative feature value into a numerical value in phonetics. Thus, [voice]-specified stops become [㤀voice], but unspecified voiceless stops become [voice], which ensures their active devoicing (Jansen Reference Jansen2004). Voiced stops in aspirating languages lack specification for [voice], therefore they do not get a numerical value for this feature and can be passively and variably voiced in phonetics. Alternatively, in line with Kessinger & Blumstein (Reference Kessinger Rachel and Blumstein1997), Schwarz et al. (Reference Schwarz, Sonderegger and Goad2019) argue that passive voicing in unspecified voiceless stops is avoided for perceptual reasons.
While LR adequately explains the typology of laryngeal contrasts in languages on the basis of VOT categories, it cannot fully account for the f0 patterns in voiceless stops in different laryngeal contrasts. In a recent study of f0 in French and Italian, true voice languages, Kirby & Ladd (Reference Kirby and Robert Ladd2018) argue that f0 is raised after voiceless stops in these languages in the same fashion as it is raised in American English, an aspirating language. They claim that this situation is somewhat problematic for LR because different phonological specification of voiceless stops in true voice and aspirating languages should correlate with different and clear-cut acoustic realization. It is possible, however, that similar realization of f0 is the result of mere absence of glottal pulsing in the voiceless category in each of these languages. In a situation when the contrast is predominantly ensured by VOT as a primary cue to voicing, the role of f0 as a secondary cue becomes less important (e.g. van Alphen & Smits Reference van Alphen and Smits2004). Speakers may variably use f0 to enhance the contrast in voiceless stops rather than target specific contrastive values. But should a language have more than one voiceless category, the difference in f0 might emerge. Studies of voicing in Khmer, Vietnamese and Thai reveal that voiceless unaspirated stops are often produced with slightly lower f0 than voiceless aspirated stops, signaling the contrast between the two otherwise voiceless categories (Kirby Reference Kirby2018).
2.3 Voicing contrast in Arabic varieties
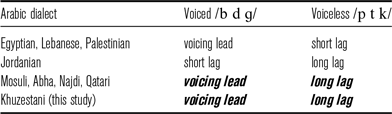
Arabic dialects have a two-way contrast between voiced and voiceless stops; however, its realization varies from one dialect to another (Table 3). Lebanese, Egyptian, and Palestinian Arabic are examples of true voice languages (Yeni-Komshian, Caramazza & Preston Reference Yeni-Komshian, Caramazza and Preston1977, Rifaat Reference Rifaat2003, Tamim Reference Tamim2017). Jordanian Arabic (Khattab, Al-Tamimi & Heselwood Reference Khattab, Al-Tamimi, Heselwood and Boudelaa2006), in contrast, reveals a pattern typical for aspirating languages. In addition, it appears that the supposedly rare laryngeal contrast between voicing lead and long lag VOT is not uncommon among Arabic varieties. Based on the existing literature, five varieties spoken in the eastern part of the Arab world (and probably more dialects in this region) possess this type of contrast (shown as bold italics in Table 3): Mosuli Arabic (Rahim & Kasim Reference Rahim and Rakan Kasim2009), Abha Arabic (Al Malwi Reference Al Malwi2017), Najdi Arabic (AL-Gamdi et al. Reference AL-Gamdi, Al-Tamimi and Khattab2019), Qatari Arabic (Kulikov Reference Kulikov2020, Kulikov, Mohsenzadeh & Syam, published online 2 November 2021), and Khuzestani Arabic (KhA) (Bahrani Reference Bahrani2022). Kulikov (Reference Kulikov2020) showed that similar to Swedish (Beckman et al. Reference Beckman, Helgason, McMurray and Ringen2011), the duration of prevoicing and long lag in Qatari Arabic increases when speech rate is lowered.
Word-initial VOT patterns in some Arabic varieties. Bold italics indicate the contrast between voicing lead and long lag VOT.
In addition to voiced and voiceless stops /b d t k/, most Arabic dialects have voiced and voiceless ‘emphatic’, or pharyngealized, plosives /dˁ/ and /tˁ/, produced with secondary construction in the posterior area, and the uvular stop /q/, which has primary constriction in the same posterior area (Ghazeli Reference Ghazeli1977). It is of note that these stops have different or irregular VOT patterns in many Arabic dialects and are often excluded from the analysis of the voicing contrast in these languages (e.g. Olson & Hayes-Harb Reference Eve and Hayes-Harb2019). For example, VOT in emphatic /tˁ/ is typically shorter than in plain /t/ (Khattab et al. Reference Khattab, Al-Tamimi, Heselwood and Boudelaa2006, Alzoubi Reference Alzoubi2016), and uvular /q/ does not have a voiced counterpart or it merged to a glottal stop /ʔ/ in many dialects of Levant or changed to /ɡ/ in most of the Arabic words in eastern varieties. In many Gulf and Mesopotamian dialects, /dˁ/ is missing due to a merger with /ðˁ/, making /tˁ/ the only voiceless stop category with short lag VOT. Kulikov et al. (published online 2 November 2021) argue that the short lag VOT of /tˁ/ in Qatari Arabic is not just a mechanical consequence of pharyngealization because the latter does not spread to the adjacent long lag VOT. Rather, short lag is a phonological requirement necessary to distinguish the voiceless emphatic stop /tˁ/ from its plain counterpart /t/.
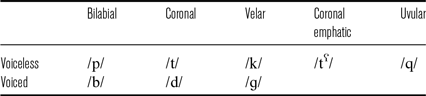
Similar to Qatari Arabic, KhA has voiced and voiceless plain stops /b d ɡ t k/ and voiceless emphatic /tˁ/. In addition, it also has voiceless /p/ in non-Arabic words, and voiceless /q/ in both Arabic and non-Arabic words (Bahrani & Modarresi Ghavami Reference Bahrani and Modarresi Ghavami2021). KhA stop system is shown in Table 4. Voiced stops are consistently produced with voicing lead; plain voiceless stops are aspirated, and both emphatic /tˁ/ and uvular /q/ are voiceless unaspirated and do not have voiced counterparts. It is of note that coronal emphatics and uvulars are often reported to share some phonological specifications, e.g. feature [pharyngeal] (McCarthy Reference McCarthy and Keating1994: 202) or [guttural] (Watson Reference Watson2002: 38). To capture this generalization, we will refer to this group of stops with a post-velar constriction as guttural in line with Watson.
Stop consonants in Khuzestani Arabic.
Therefore, KhA provides a convenient case to examine the behavior of three VOT categories in the same language in a situation when short lag VOT is associated with another phonological contrast in a language. To the best of our knowledge, no study investigated these guttural stops in relation to speech rate manipulation and the degree of intervocalic voicing. LR predicts that guttural /tˁ/ and /q/ in KhA are unspecified for the laryngeal feature in phonology and should not respond to speech rate manipulation. VOT in voiced and voiceless stops should show such response and increase as speech rate slows. In addition, we analyze and test the predictions of LR for word-medial stops. Intervocalic voiced stops should have fully voiced closure, but both groups of voiceless stops in intervocalic position are expected to have voiceless closure.
3 Voicing in initial and medial stops
3.1 Method
3.1.1 Participants
Seven female and five male speakers participated in the study. They were born to middle class families and raised either in Abadan or Khorramshahr. They had either non-existent or insufficient knowledge of any other language excluding Persian, which is the lingua franca language of the Iranian community. Their age was between 20 years and 39 years (M = 29). They did not report any speech or hearing impairment and were not informed about the purpose of the experiment.
3.1.2 Materials
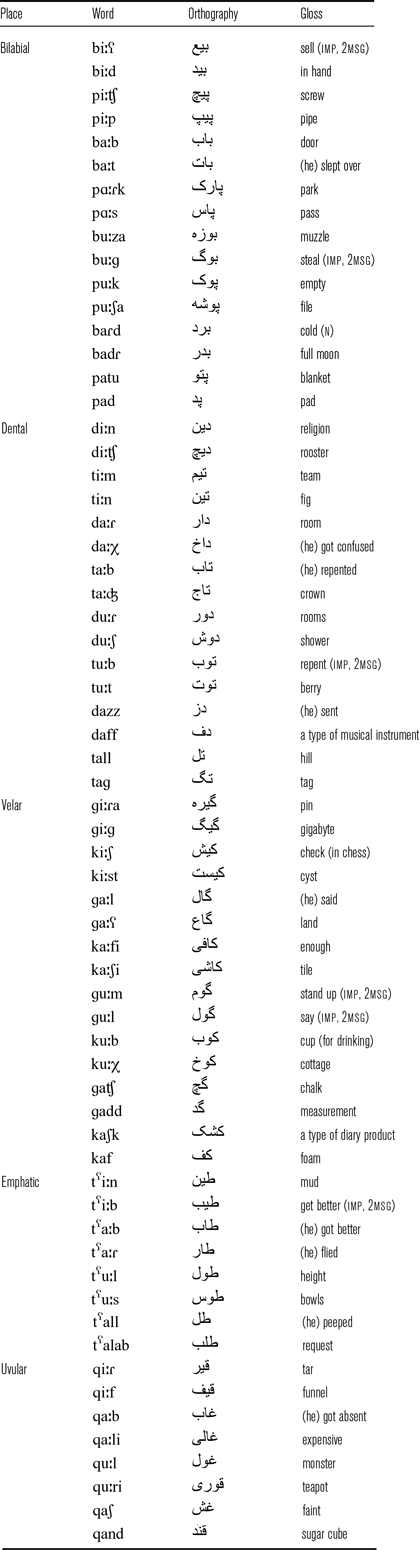
We evaluated laryngeal state in stops in word initial and word medial positions. For the word-initial position, the stimuli were 62 short Arabic words and two non-words with initial voiced and voiceless stops (n = 8) at four places of articulation: bilabial, coronal (alveolar/dental), velar, and uvular. Voiceless coronal stops were either plain /t/ or emphatic /tˁ/, which was articulated with a secondary constriction in the posterior area. This yielded to five contrasts in place of articulation, but only three of them were possible in voiced stops. Each stop was produced before four vowels: /a/, /aː/, /iː/, or /uː/. The complete list of target words is shown in the appendix Table A1. Table 5 exemplifies stimuli before long /aː/.
Examples of the stimuli in word initial position.
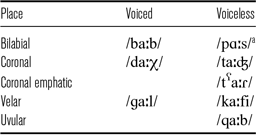
a The vowel was more retracted in loan words [pɑːs] and [pɑːɾk].
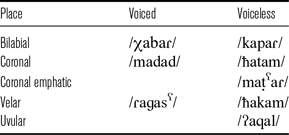
For the word-medial position, the stimuli were disyllabic Arabic words (n = 16) with intervocalic voiced and voiceless stops (n = 8) at five contrastive places of articulation. Each stop was produced between low vowels /a/ or /aː/. The complete list of target words is shown in the appendix Table A2. Table 6 exemplifies stimuli before short /a/. The vowel following the target stop was invariably unstressed.
Examples of the stimuli in word medial intervocalic position.
3.1.3 Procedure
The recordings were made in a quiet room using a Sony ICD-PX440 recorder (320 kbps, 44,100 Hz). Target words were presented to the participants in Arabic orthography. The participants pronounced (read) each target word in a carrier phrase [ɡaːl faːɾes … mɑɾteːn] ‘Fares said … two times’ at two speaking rates, slow and fast, which is an adopted practice in studies of rate effects on VOT (e.g. Kessinger & Blumstein Reference Kessinger Rachel and Blumstein1997, Beckman et al. Reference Beckman, Helgason, McMurray and Ringen2011). In the slow rate condition, the participants were instructed to pronounce the phrase at a comfortable tempo. In the fast rate condition, the participants were asked to pronounce the phrase as fast as they could but not at the expense of clarity. They were instructed to speak as if they were going to say something important to a person who is about to leave the room.
3.1.4 Acoustic analysis
The recorded materials were evaluated for naturalness by one of the authors, a native speaker of Arabic. Ninety tokens (3.2
 $\%$
of the recorded items) were discarded due to mispronunciation (n = 41) or non-plosive realization of uvular stops (n = 49), as /q/ is optionally realized as a voiced fricative in KhA (Bahrani & Modarresi Ghavami Reference Bahrani and Modarresi Ghavami2021). A total of 3030 word-initial tokens and 730 word-medial tokens were submitted to acoustic analysis.
The segment boundaries were set manually in PRAAT (Boersma & Weenink Reference Boersma and Weenink2021). The segment preceding word initial target stop was voiceless [s] to ensure there is no carry-over of glottal pulsing from a preceding segment. VOT was measured as timing between the stop release and the onset of voicing. Both waveforms and spectrograms were used to identify the beginning of glottal pulses. F0, F1 and F2 were measured from LPC spectra obtained with a 25 ms Hamming window at vowel onset. The amount of stop closure voicing was evaluated using absolute values of voicing duration and relative proportion of voicing during closure (hence, VR, or voicing ratio). The onset of stop closure was marked at the point of cessation of F2 and significant drop of periodic energy. The offset of voicing was marked at the point of cessation of glottal pulsing. The landmarks for acoustic measurements are summarized in Figure 1.
Examples of acoustic measurements: (A) negative VOT (voicing lead) in [baːt] ‘slept’, (B) long lag positive VOT in [tʰaːb] ‘repented’, (C) short lag positive VOT in [tˁaːɾ] ‘flew’. F0, F1 and F2 were measured at vowel onset.

3.1.5 Data analysis
The acoustic data were submitted to several linear mixed effects models using the lmer package (Bates et al. Reference Bates, Maechler, Bolker and Walker2015) in R (R Core Team 2021). Each acoustic cue was used as a dependent variable in a separate mixed-effects model. Fixed effects in the model were independent variables whose effect is investigated (e.g. stop class or place of articulation). When a fixed effect had more than two levels, it was first evaluated using a Log Likelihood (chi-square) test by comparing the model fit with and without the factor. Random effects in the model were sources of variance due to random selection of a subset of population (e.g. speakers or words).
Following Barr et al. (Reference Barr, Levy, Scheepers and Tily2013), we started selecting the optimal model with the most saturated one that included both random intercept and random slopes. Random intercept is a mean difference between each speaker or word; random slope explains additional variation in a fixed effect in relation to a given random effect. For example, the effect of place of articulation may vary from one speaker to another due to individual differences. Similarly, the effect of speech rate may vary from one word to another due to number of segments in a word. When adding some effects did not improve the model’s performance, the simpler model was selected for the benefit of better convergence (Matuschek et al. Reference Matuschek, Kliegl, Vasishth, Baayen and Bates2017). The p-values for factor levels were calculated using the lmerTest package (Kuznetsova, Brockhoff & Christensen Reference Kuznetsova, Brockhoff and Christensen2017).
3.2 Results I: Initial stops
3.2.1 Phonetic context
Before analysing acoustic properties of stops and effect of speech rate, we looked into acoustics of vowels. Since KhA is predominantly a vernacular dialect, we wanted to make sure speakers produced vowels in the reading tasks as intended. The summary of the vocalic cues is given in Table 7.
Means and standard deviations (in parentheses) for major vocalic cues in KhA vowels.
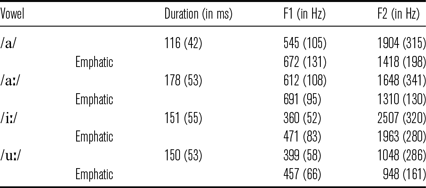
The results showed that the vowels were produced as intended. Formant values were consistent with vowel qualities reported in Bahrani & Modarresi Ghavami (Reference Bahrani and Modarresi Ghavami2021). Duration of long high vowels /iː/ and /uː/ was shorter than that of low /aː/, following cross-linguistic tendencies (e.g. Peterson & Lehiste Reference Peterson and Lehiste1962). Duration of short /a/ was 65
 $\%$
shorter compared to long /aː/.
The four vowels were also distinct in formant frequencies. As expected, long /aː/ was realized as a low central vowel, long /iː/ – as high front vowel, long /uː/ as a high back vowel, and short /a/ as a mid front vowel. All vowels were considerably lowered and retracted next to emphatic coronal and uvular stops revealing higher F1 and lower F2.
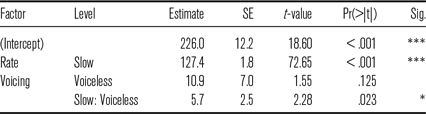
Summary of fixed effects in a linear model examining word duration.
* = p < .05; * * * = p < .001
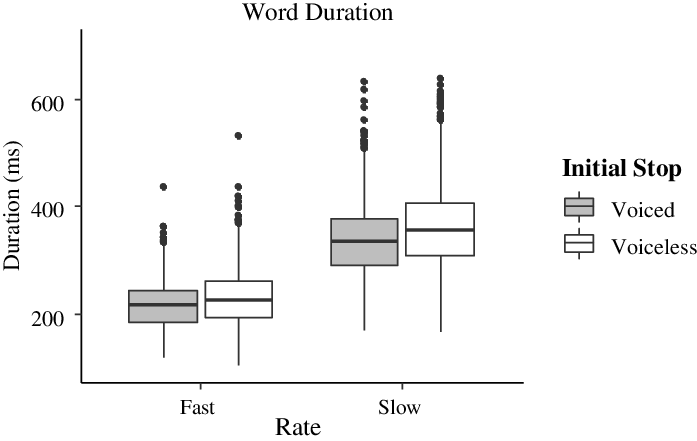
Boxplots of word durations as a function of initial stop voicing and rate condition.
3.2.2 Word duration
Next, we analyzed duration of words to make sure speakers produced the desired difference in the two speech rate conditions. We used total word duration as a proxy of speech rate. It was analyzed in a linear mixed effects model with the following equation:
 \begin{align*} & {\rm{Word\_duration}}\sim 1 + {\rm{Voicing}}\, + {\rm{SpRate}}\, + \left( {{\rm{Voicing}} \times {\rm{SpRate}}} \right) + \left( {{\rm{1}}\, + {\rm{Voicing}}}\, +\right.\\[4pt] & \quad\qquad \left. {\rm{SpRate|Speaker}} \right)\end{align*}
Adding gender as a between-subject fixed effect did not improve the model (p = .794). The results are summarized in Table 8, and effects are plotted in Figure 2.
The model revealed the effect of rate condition. Words in the slow condition were on average 127 ms longer than in the fast condition. The effect of voicing was not obtained, but the interaction with rate revealed that words with initial voiceless stops were 6 ms longer than words with initial voiced stops in the slow rate condition.
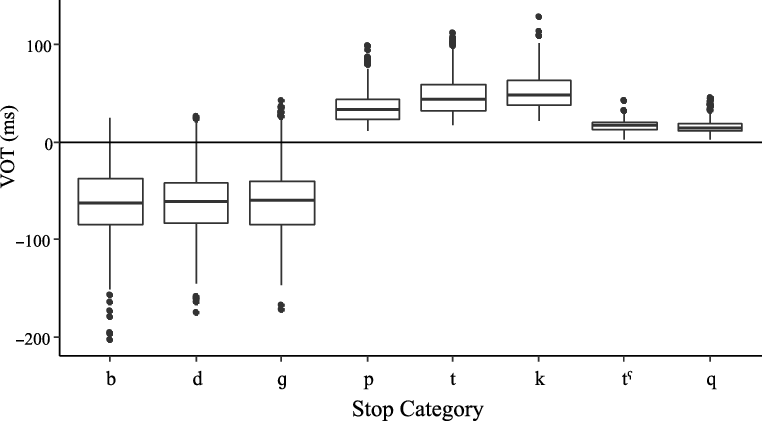
Boxplots of VOT in initial position across stop classes and speech rates.
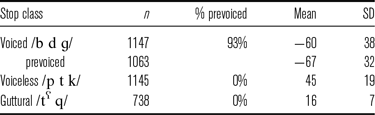
Summary of VOT durations in initial stops (in ms).
3.2.3 VOT
Next, we examined and analyzed VOT in initial stops. Observation of VOT distributions in each stop category (see Figure 3) revealed three types of VOT in the data that corresponded to three types of VOT commonly found in world’s languages (Lisker & Abramson Reference Lisker and Abramson1964). The majority of phonologically voiced stops /b d ɡ/ were produced with negative VOT, or voicing lead, ranging from −200 ms to 0 ms. However, 7
 $\%$
of voiced stops (n = 42) were produced without prevoicing and had short lag positive VOT ranging from 5 ms to 35 ms. Voiceless stops /p t k/ were largely produced with positive VOT ranging from 11 ms to 128 ms, which we define as long lag, and guttural stops /tˁ q/ were produced with positive VOT ranging from 2 ms to 40 ms, which we define as short lag.Footnote 3 Table 9 summarizes the means and standard deviations for the three types of VOT. Therefore, for subsequent analysis we divided all stops into three stop classes: (i) voiced /b d ɡ/, (ii) voiceless /p t k/, and (iii) guttural /tˁ q/.
These observations were confirmed in a liner mixed effects model with the following equation:
 \begin{align*} & {\rm{VOT}}\sim 1 + {\rm{StopClass}}\, + {\rm{SpRate}}\, + \left( {{\rm{StopClass}} \times {\rm{SpRate}}} \right) + \left( {\rm{1}}\, + {\rm{StopClass}}+ \right.\\[4pt]& \qquad \left. {\rm{SpRate|Speaker}} \right) + \left( {{\rm{1|Word}}} \right)\end{align*}
Stop class levels were coded as contrasts using Helmert coding (Davis Reference Davis2010), in which voiced stops (coded 2/3) were compared to all phonetically voiceless stops (each class coded −1/3) at level 1, and guttural stops /tˁ q/ (coded −0.5) were compared to voiceless stops /p t k/ (coded 0.5) at level 2. The model is summarized in Table 10.
Summary of fixed effects in a lme model examining VOT in initial stops.

* * = p < .01; * * * = p < .001
We found an effect of stop class: each class was different from each other. The coefficient for voiced stops was negative indicating prevoicing, and positive VOT in the voiceless stops was significantly longer than in guttural stops. Importantly, stop class interacted with speech rate, revealing that each type of VOT reacted to speech rate manipulation differently. The slope was steeper for voiced stops (β = 39 ms, p < .001) than for all voiceless stops, and it was also steeper for voiceless stops (β = 15 ms, p < .001) as compared to guttural stops.
In order to explore the stop class-by-rate interaction in depth, we ran separate lme models for each stop class with the follow formula:
 \begin{equation*}{\rm{VOT\sim 1 + Place + SpRate + }}\left( {{\rm{1 + Place + SpRate|Speaker}}} \right){\rm{ + }}\left( {{\rm{1|Word}}} \right)\end{equation*}
The model included the effect of place of articulation (bilabial, coronal, velar, for voiced and voiceless stops; coronal, uvular, for guttural stops). Places of articulation were compared using backward difference coding (Davis Reference Davis2010), in which coronal place was compared to bilabial place at level 1, and velar place were compared to coronal place at level 2. Tables 11–13 summarize the models. The effects are plotted in Figure 4.
For voiced stops, only a strong effect of rate was found (Table 11). Prevoicing (negative VOT) was on average 31 ms longer in the slow rate condition. No significant difference was found between places of articulation.
Summary of fixed effects in a lme model examining VOT in voiced stops.

* * * = p < .001
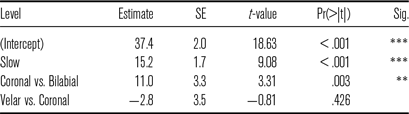
Summary of fixed effects in a lme model examining VOT in voiceless stops.
* * = p < .01; * * * = p < .001
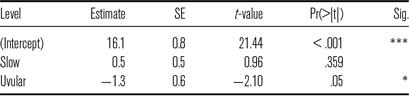
Summary of fixed effects in a lme model examining VOT in guttural stops.
* = p < .05; * * * = p < .001
VOT in voiced, voiceless and guttural initial stops in slow and fast rate conditions broken down by place of articulation.

For voiceless stops, the effect of speech rate was also significant, but its magnitude was smaller (Table 12). Long lag positive VOT was on average 15 ms longer in the slow rate condition. Effect of place of articulation was also obtained, revealing that long lag VOT was 11 mm longer in coronal stops and velar stops than in bilabial stops.
For guttural stops, no effect of speech rate was found (Table 13). Short lag positive VOT in emphatic coronal and uvular stops did not change in response to rate manipulation. The effect of place of articulation was significant but very small, with a negligible differences of 1.3 ms.
3.2.4 VOT and speech rate
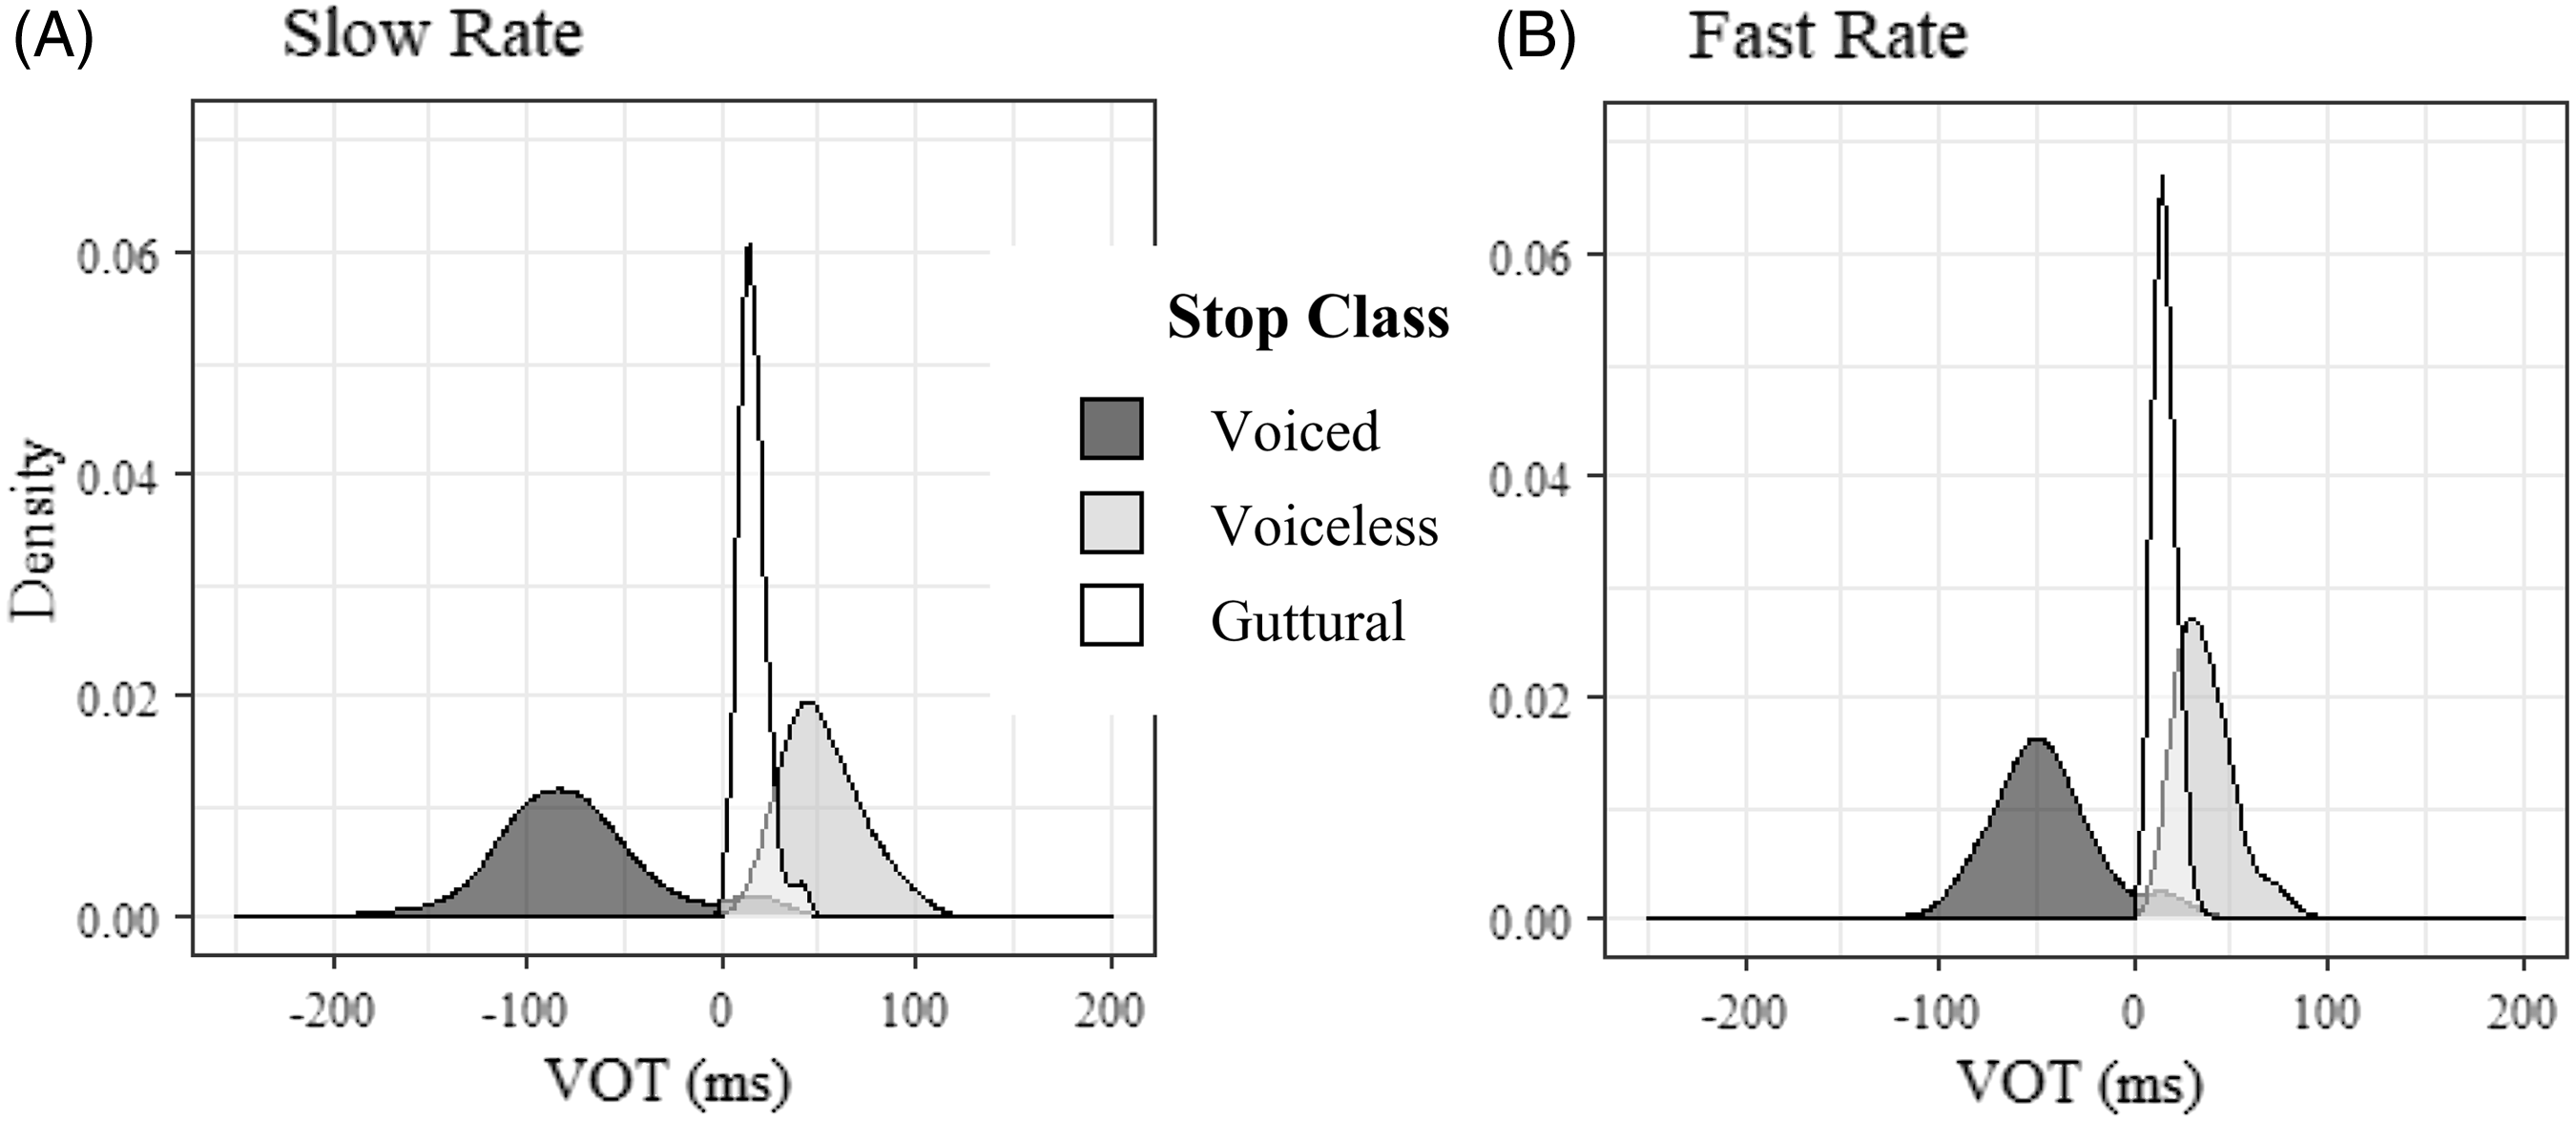
The analysis revealed that the three types of VOT react to manipulation with speech rate differently. In line with previous studies of rate effects on VOT across languages (e.g. Kessinger & Blumstein Reference Kessinger Rachel and Blumstein1997, Beckman et al. Reference Beckman, Helgason, McMurray and Ringen2011, Schwarz et al. Reference Schwarz, Sonderegger and Goad2019, Kulikov Reference Kulikov2020), we found a decrease in duration of negative VOTs and long lag VOTs in fast rate condition. Importantly, the decrease in duration of prevoicing and aspiration was not driven by changes of VOT values in outliers but rather it affected the whole distributions, as shown in Figure 5. The mode of negative VOTs shifted from −80 ms in slow speech to −50 ms in fast speech; the mode of long lag positive VOTs shifted from 45 ms in slow speech to 30 ms in fast speech. In contrast, no change in the range or modal values was found for the distribution of short lag positive VOTs. They were virtually unaffected by speech rate manipulation.
Shift in VOT distributions of voiced and voiceless initial stops in response to speech rate manipulation. No shift occurred in guttural stops.
Our next analysis looked into a continuous relationship between VOT and speech rate. Recall that the relationship between VOT and speech rate is diagnostic to phonological features of contrast in a language. When word duration decreases in fast speech rate, speakers also decrease VOT values in initial stops, as shown in Figure 6. However, according to Beckman et al. (Reference Beckman, Helgason, McMurray and Ringen2011), this decrease affects only temporal cues that are correlates of contrastive phonological features. Under Laryngeal Realism, prevoicing manifests [voice] and long lag positive VOT manifests [spread glottis]. Short lag positive VOT is assumed to have no corresponding laryngeal feature.
Effect of speech rate on VOT for stops in initial position.
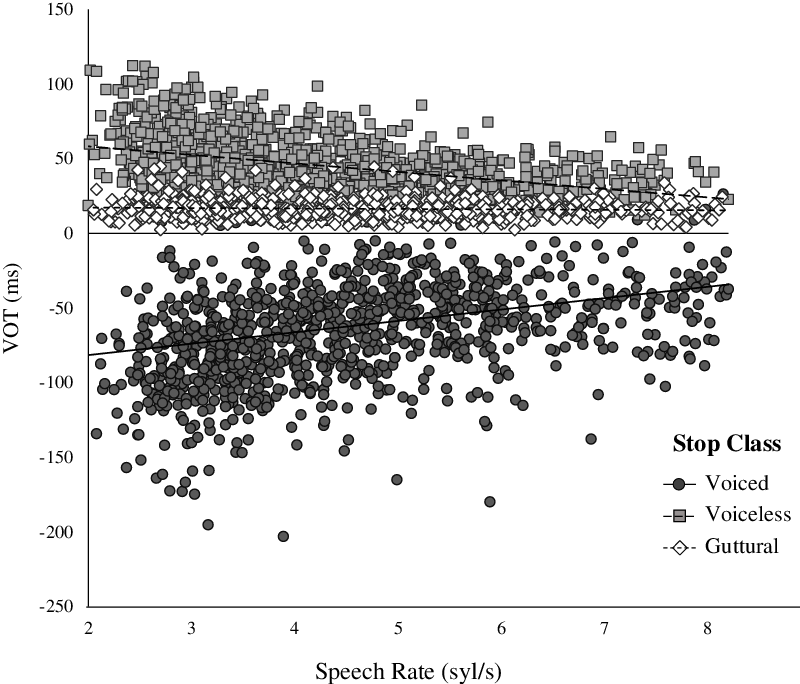
To confirm empirical observations about VOT and continuous speech rate, a linear mixed effects model with the following formula was fitted to the data:
 \begin{align*} & {\rm{VOT\sim 1 + StopClass + SylRate\, + }}\left( {{\rm{StopClass }} \times {\rm{ SylRate}}} \right){\rm{ + }}\left( \rm{1 + StopClass}+\right.\\[4pt] & \qquad \left. \rm{SylRate|Speaker} \right){\rm{ + }}\left( {{\rm{1|Word}}} \right)\end{align*}
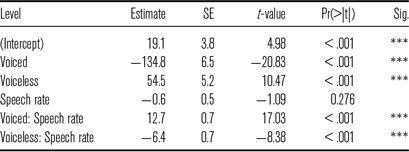
It used number of syllables per second as a proxi to continuous speech rate. Stop classes were coded to compare contrasts between short lag VOTs in guttural stops (reference category, 0) to negative VOTs in voiced stops (−1) and to long lag positive VOTs in voiceless stops (1). Speaker and word were used as random intercepts; stop class was added as a random slope for speaker. The results of the model are summarized in Table 14.
Summary of fixed effects in a linear model examining relationship between VOT and speech rate.
* * * = p < .001
The effect of speech rate was not obtained (p = .276), indicating that short lag VOTs in guttural stops did not decrease as speech became faster. The effect of stop class was significant (p < .001) indicating that duration of VOT was longer in voiced and voiceless stops than in guttural stops. The positive coefficient for voiceless stops indicated that they were produced with long lag VOT. The negative coefficient for voiced stops indicated that they were produced with robust prevoicing. Absolute duration of VOT was longer in voiced stops than in voiceless stops. Significant interactions between speech rate and stop class (p < .001) revealed that the effects of speech rate were present in voiced stops and voiceless stops. Voicing duration in voiced stops had a steeper slope than duration of positive VOT in voiceless stops.
3.2.5 Spectral cues (f0, F1, F2)
Finally, we analyzed secondary, spectral cues to voicing in initial stops: f0, F1 and F2. This was performed to evaluate the glottal state for each category of VOT in a series of linear mixed effects models with the formula:
 \begin{align*}& {\rm{Cue \sim 1 + StopClass + SpRate + Gender + }}\left( {{\rm{StopClass}} \times {\rm{SpRate}}} \right){\rm{ + }}\left( \rm{1 + StopClass}\right.\\[4pt] & \qquad \left. +\, \rm{SpRate|Speaker} \right){\rm{ + }}\left( {{\rm{1|Word}}} \right)\end{align*}
The models examining F1 and F2 also included vowel as a fixed factor, but the differences in formant frequencies between vowels were predicted and are not reported here. All models also included gender as a fixed between-subject effect. It was predictably significant (p < .001) for all spectral cues indicating lower frequencies in men. Importantly, it did not interact with other factors suggesting that both genders performed in a unified fashion; therefore, we do not discuss it in this paper. The results are summarized in Tables 15–17. The effects are plotted in Figure 7.
Summary of fixed effects in a linear model examining f0.

* = p < .05; * * * = p < .001
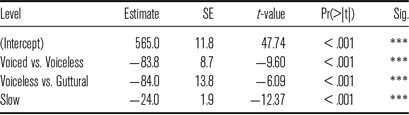
Summary of fixed effects in a linear model examining F1.
* * * = p < .001
Summary of fixed effects in a linear model examining F2.
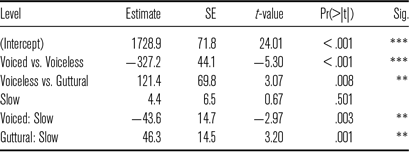
* * = p < .01; * * * = p < .001
Effects of stop class and speech rate on spectral cues (f0, F1, F2) in initial stops.
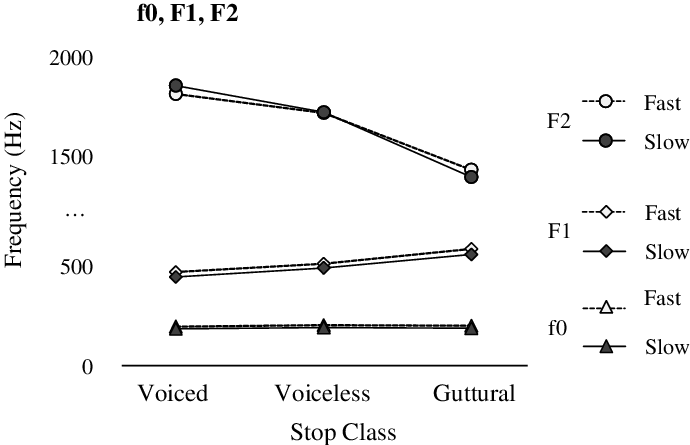
For f0 (Table 15), we found a significant effect of stop class. F0 was 6 Hz lower after voiced stops than after voiceless stops, and 3 Hz higher after voiceless stops than after guttural stops. The effect of speech rate was also significant revealing that pitch was lower by 12 Hz in slow rate condition.
For F1 (Table 16), the effect of stop class was significant. F1 was 84 Hz lower after voiced stops than after voiceless stops, and 84 Hz lower after voiceless stops compared to guttural stops.
For F2 (Table 17), the effect of stop class was also significant. F2 was 327 Hz lower after voiceless stops than after voiced stops, and 121 Hz higher after voiceless stops compared to guttural stops. The effect of speech rate was not significant, but interaction with stop class revealed that F2 significantly increased by 44 Hz in slow speech after voiced stops, but it decreased by 46 Hz in slow speech after guttural stops.
Summary of fixed effects in a linear model examining word duration.

* * * = p < .001
Mean word duration as a function of medial stop voicing and rate condition.

3.2.6 Interim summary
The results showed that phonologically voiced stops /b d ɡ/ were produced with phonetic voicing. The analysis of VOT revealed that these stops were predominantly prevoiced in initial position. The analysis of spectral cues showed that the glottal state was consistent with voicing: both f0 and F1 were lower suggesting the larynx was lowered to facilitate vibration of the vocal folds. Phonologically voiceless stops /p t k/ were produced as voiceless aspirated. They had long-lag positive VOT and higher f0 and F1. The guttural stops /tˁ q/ were produced as voiceless unaspirated. They had short-lag positive VOT and a glottal state consistent with phonetic voicelessness (higher f0 and F1). It is of interest that F2 also correlated with voicing in KhA stops. Not only lower F2 predictably indicated emphatic phonation, but higher F2 was consistent with voicing.
The results suggest that the three types of VOT responded differently to speech rate manipulation. Prevoicing in voiced stops and aspiration in voiceless stops gradually increased as speech became slower. But short-lag VOT in guttural stops was not affected by rate and remained stable across rate conditions.
3.3 Results II: Medial stops
Using the routine established in the analysis of initial stops, we first examined whether speech rate manipulation produced a desired effect on duration of target words. The results are summarized in Table 18, and effects are plotted in Figure 8. The data were fitted into a linear mixed effects model with rate condition (fast, slow) and phonetic stop voicing (voiceless, voiced) as fixed effect, speaker and word as random intercepts, and speech rate and stop voicing as random slopes for speaker.
The model revealed the effect of rate condition. Words in the slow condition were on average 109 ms longer than in the fast condition. The effect of voicing was not obtained. Words with medial voiceless stops were slightly longer than words with voiced stops, but this difference did not reach significance level.
3.3.1 VOT and closure voicing
Next, we examined distributions of VOTs in voiceless stops. We found the same types of VOT as in initial stops (Table 19A, Figure 9A). Voiceless /p t k/ were produced with long lag positive VOT averaging at 41 ms, which was very similar to what we found in initial stops (M = 45 ms). Guttural stops /tˁ q/ were produced with short-lag positive VOT averaging at 16 ms, which was also virtually identical to the type of VOT in guttural stops in initial position (M = 16 ms).
Summary of VOT and closure voicing durations in medial stops (in ms).
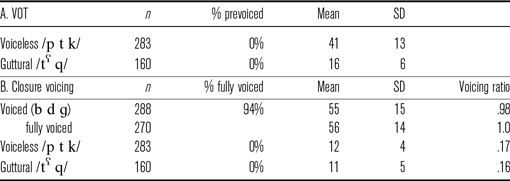
Boxplots of (A) VOT and (B) closure voicing in medial stops.

It was not possible to identify VOT for voiced stops due to the continuous nature of stop voicing in intervocalic position. Although the majority (94
 $\%$
) of voiced /b d ɡ/ were fully voiced, the glottal pulsing started in the preceding vowel and could not be measured in the same way as prevoicing in initial stops. We found that glottal pulsing in voiced stops continued throughout the entire closure averaging at 56 ms (Table 19B), and only in rare occasions (6
 $\%$
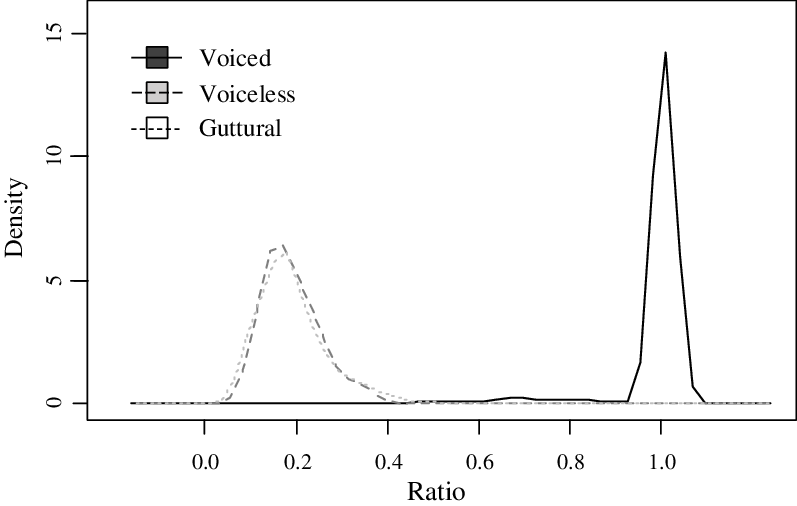
of cases) it ceased before the release. The ratio of voicing duration to the duration of closure (voicing ratio, VR) in voiced stops was 98
 $\%$
. Phonetically voiceless stops (both plain and guttural), in contrast, were articulated with closure that was essentially voiceless. It was voiced only for a small part, with a very short voicing tail that ended 12 ms after the onset of stop closure (Table 19B, Figure 9B). VR was 17
 $\%$
in voiceless stops and 16
 $\%$
in guttural stops. Figure 10 exemplifies the differences in closure voicing between voiced and voiceless stops.
Proportion of closure voicing in three classes of medial stops.
3.3.2 Effect of speech rate
Next, we compared distribution of VOT and closure voicing of medial stops in the two speech rates. We found the same tendency as in initial stops. Longer duration in slow speech was found only for long lag VOT of voiceless stops but not for short lag VOT of guttural stops (Figure 11). The change affected the whole distribution, shifting the maximal and modal values from 60 ms and 35 ms in fast speech to 78 ms and 40 ms in slow speech. Similarly, duration of closure voicing in voiced stops was longer at slow rate in order to maintain it throughout the entire closure, but duration of a short voicing tail in all phonetically voiceless (both plain and guttural) stops remained stable across rates (Figure 12). Again, this change in voicing duration in voiced stops affected the whole distribution. The maximal and modal values changed from 96 ms and 60 ms in fast speech to 119 ms and 50 ms in slow speech.
Shift in distributions of VOT in voiceless medial stops in response to speech rate manipulation. No shift occurred in the guttural stops.
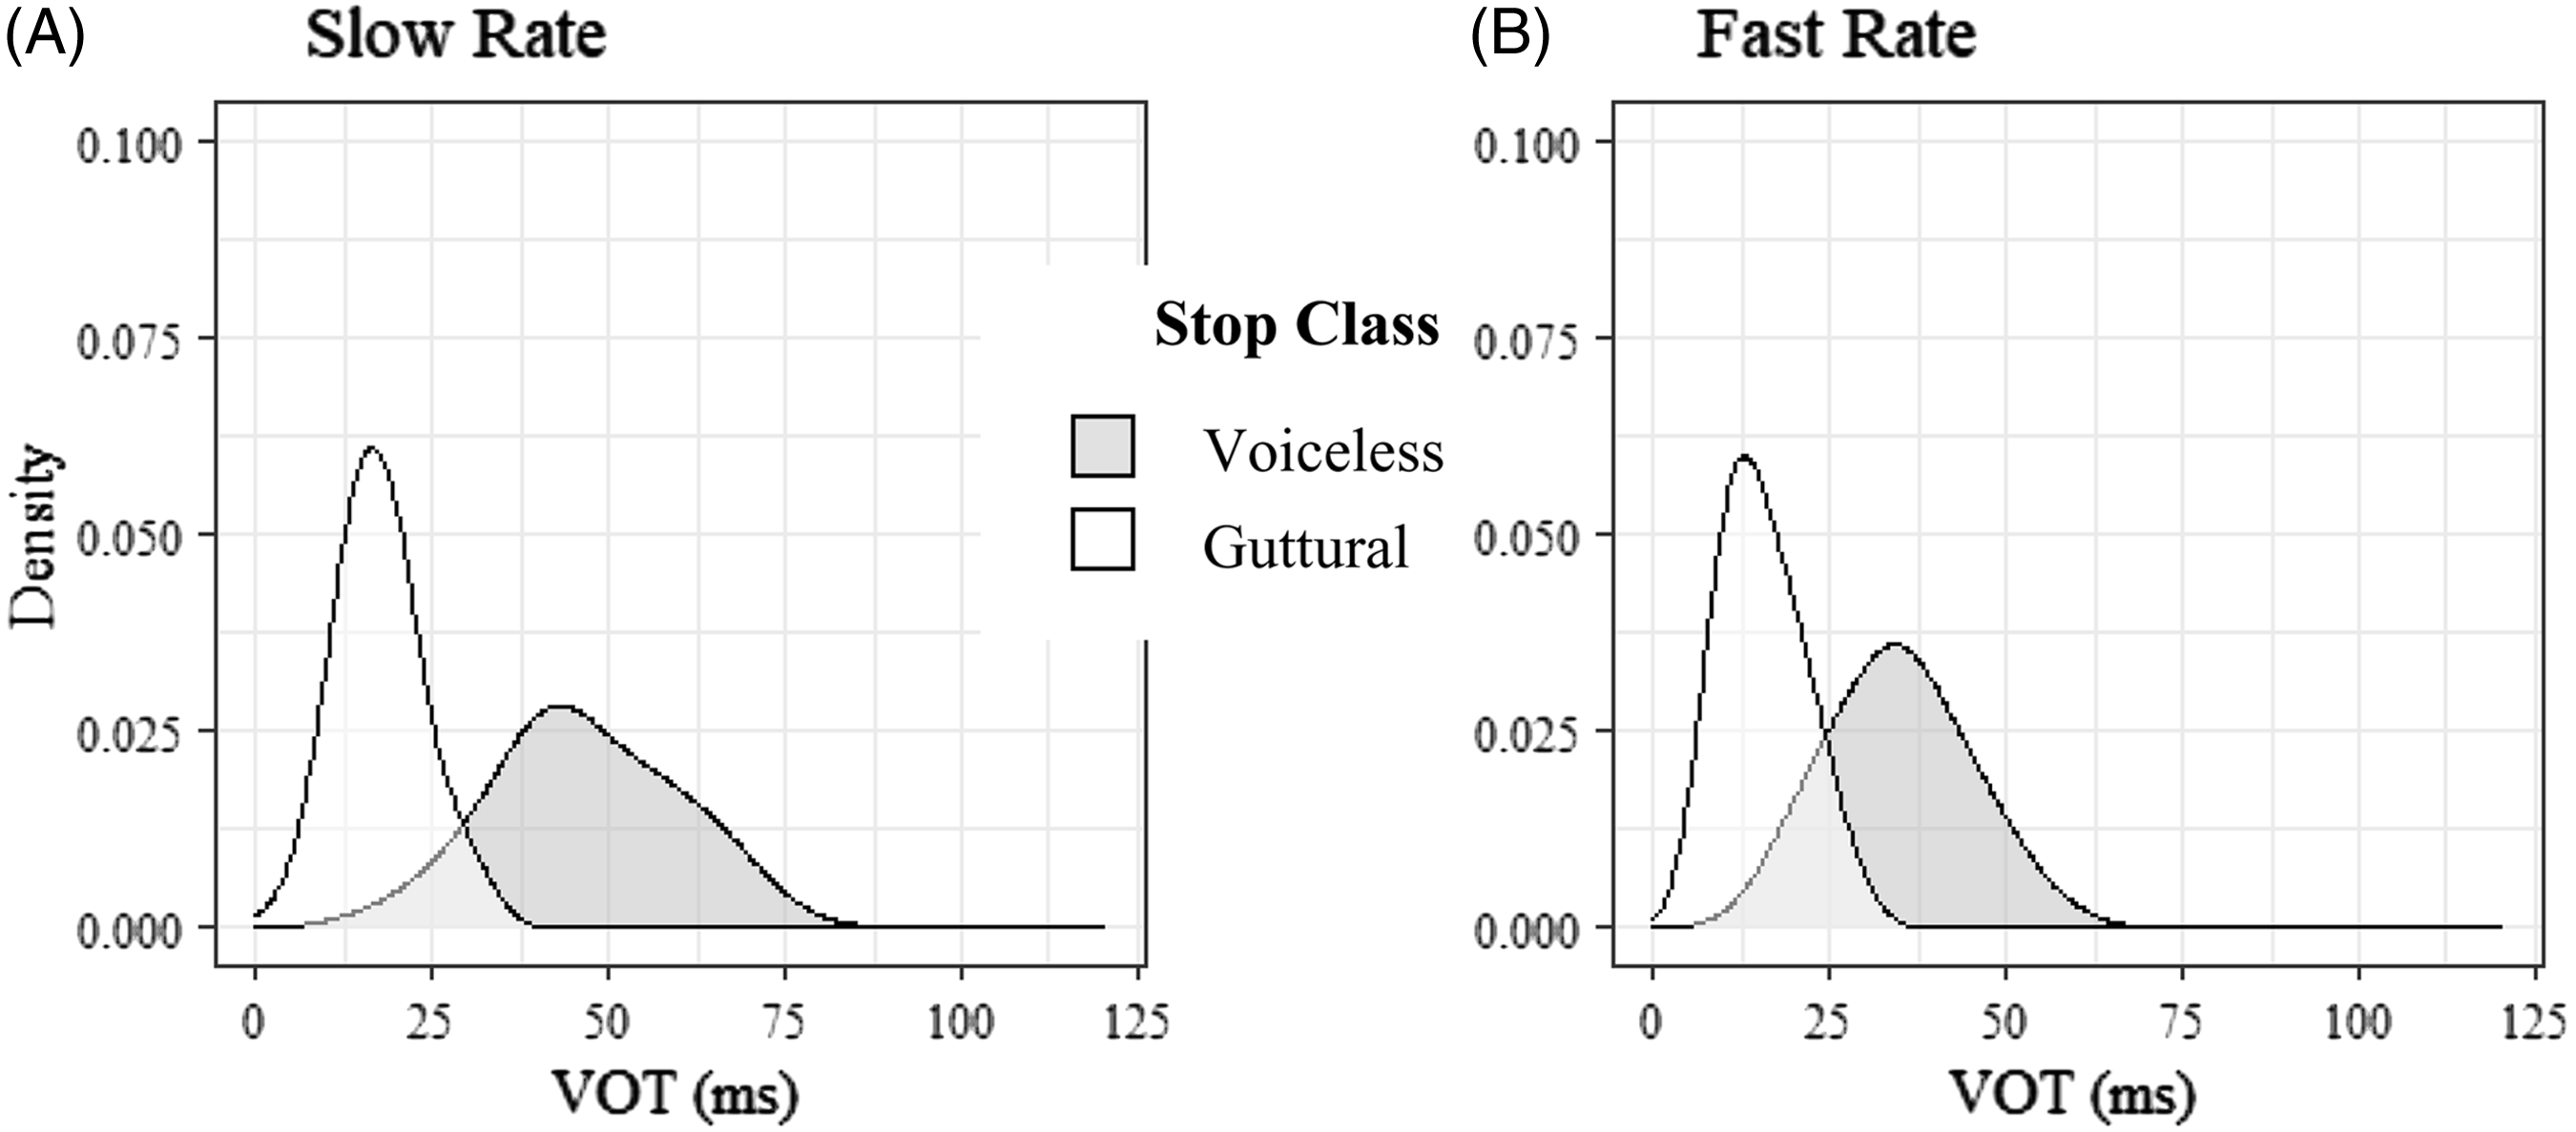
Shift in distributions of closure voicing in voiced medial stops in response to speech rate manipulation. No shift occurred in the voiceless and guttural stops.

We evaluated these observations in a series of linear mixed effects models with the formula:
 \begin{align*} & {\rm{Cue \sim 1 + StopClass + SpRate\, + }}\left( {{\rm{StopClass}} \times {\rm{SpRate}}} \right){\rm{ + }}\left( \rm{1 + StopClass}\, + \right.\\[4pt]& \qquad \left. \rm{SpRate|Speaker} \right){\rm{ + }}\left( {{\rm{1|Word}}} \right){\rm{.}}\end{align*}
Stop classes were coded using Helmert coding (Davis Reference Davis2010) for contrasts between voiced stops (reference category) and all voiceless stops at level 1, and between voiceless and guttural stops at level 2. Separate models were fitted to evaluate VOT in voiceless stops, and absolute duration of closure voicing in all medial stops.
For VOT (Table 20), we found significant effects of stop class and speech rate and interaction. VOT was 14 ms shorter in guttural stops that in voiceless stops. VOT increased by 7 ms in slow rate condition, but interaction revealed that this change was found only in voiceless stop. There was no increase in VOT guttural stops.
For closure voicing, we also found significant effects of stop class and speech rate, and interaction (Table 21). Duration of voicing in voiceless stop closure was by 37 ms shorter than in voiced closure, but there was no difference between duration of closure voicing in voiceless and in guttural stops. Speakers produced longer closure voicing in slow speech, but the interaction revealed the change affected only voiced stops. The negative coefficient indicated that increase in voicing duration did not occur in voiceless or guttural stops.
Similar to initial stops, the relationship between VOT/closure voicing in medial stops and speech rate was continuous as it appeared to be driven by duration of a word (Figure 13).
To confirm this observation, two separate linear mixed effects models were fitted to the data using the following formula:
 \begin{align*} & {\rm{Cue \sim 1 + StopClass + SylRate\, + }}\left( {{\rm{StopClass}} \times {\rm{SylRate}}} \right){\rm{ + }}\left( \rm{1 + StopClass}\, + \right.\\[4pt]& \qquad \left. \rm{SylRate|Speaker} \right){\rm{ + }}\left( {{\rm{1|Word}}} \right)\end{align*}
The model used speech rate (number of syllables per second) as a continuous fixed effect (covariate). A smaller number of syllables per second indicated slower speech; a higher number was indicative of faster speech. Stop classes were coded by reverse Helmert coding (Davis Reference Davis2010) to compare contrasts between short voicing tails in guttural stops and in voiceless stops at level 1 and to fully voiced closure in voiced stops at level 2. The model evaluating VOT was run on a subset of data that included only voiceless stops. The results of the models are summarized in Table 22.
Summary of fixed effects in a lme model examining VOT in medial stops.

* * * = p < .001
Summary of fixed effects in a lme model examining duration of closure voicing in medial stops.

* * * = p < .001
Effects of stop class and speech rate on spectral cues (f0, F1, F2) in medial stops.

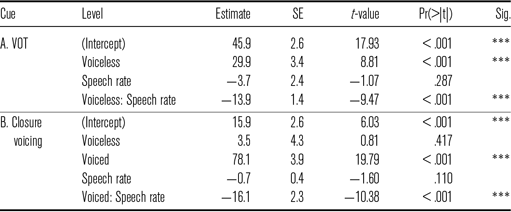
Summary of fixed effects in a linear model examining relationship between closure voicing and speech rate in medial stops.
* * * = p < .001
For VOT (Table 22A), the effect of stop class was significant (p < .0001) indicating that VOT was significantly longer in voiceless stops. The effect of speech rate was not obtained (p = .287), indicating that short lag VOTs in guttural stops did not increase significantly as speech became slower. But a significant interaction between speech rate and stop class (p < .001) revealed that the effect of speech rate was present in voiceless stops. The coefficient was negative indicating that VOT increased as speech rate became slower.
For closure voicing (Table 22B), the effect of stop class was also significant (p < .001). Duration of closure voicing in voiceless stops was no different than in guttural stops, but it was significantly longer in voiced stops. The effect of speech rate was not obtained (p = .110), indicating that short voicing tails in guttural and voiceless stops did not increase significantly as speech became slower. But a significant interaction between speech rate and stop class (p < .001) revealed that the effect of speech rate was present in voiced stops. The coefficient was negative indicating that voicing duration increased as speech rate became lower.
3.3.3 Spectral cues (f0, F1, F2)
Finally, we analyzed secondary, spectral cues to voicing (f0, F1 and F2) in medial stops in order to evaluate the glottal state for each stop class in a series of linear mixed effects models using the formula:
 \begin{align*} & {\rm{Cue \sim 1 + StopClass + SpRate\, + }}\left( {{\rm{StopClass}} \times {\rm{SpRate}}} \right){\rm{ + }}\left( \rm{1 + StopClass}\, + \right.\\[4pt]& \qquad\left. \rm{SpRate|Speaker} \right){\rm{ + }}\left( {{\rm{1|Word}}} \right)\end{align*}
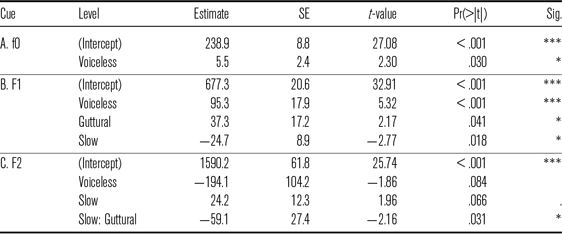
The results are summarized in Table 23. The effect of gender was also obtained for all cues, but it is not discussed here. Quite predictably, frequencies were significantly higher for female speakers (p < .001). The effects of stop class and speech rate are plotted in Figure 14.
Summary of fixed effects in a model examining f0, F1, and F2 after medial stops. Only significant interactions are reported.
* = p < .05; * * * = p < .001
Effects of stop class and speech rate on spectral cues (f0, F1, F2) in medial stops.

For f0 (Table 23A), we found a significant effect of stop class. F0 was 6 Hz lower after voiced stops than after all voiceless stops. No difference in pitch was found between guttural and voiceless stops (p = .374). The effect of speech rate was not obtained.
For F1 (Table 23B), the effect of stop class was also significant. F1 was 95 Hz higher after voiceless stops than after voiced stops, and 37 Hz higher after guttural stops than after voiceless stops. The effect of speech rate was not obtained.
For F2 (Table 23C), the effect of stop class was marginally significant. F2 was 194 Hz lower after voiceless stops than after voiced stops. A 142 Hz decrease in F2 after guttural stops was not significant (p = .249). The effect of speech rate was only marginally significant, with a slight increase by 24 Hz in slow speech. The negative interaction coefficient indicated that the increase in slow speech was cancelled in guttural stops.
3.3.4 Summary
The analysis of medial stops revealed the same relationship between VOT and stop class as in word initial stops. Phonologically voiced stops /b d ɡ/ were produced with phonetic voicing. They were articulated with voiced closure such as voicing started before the release, and the glottal state for these stops was consistent with phonation. F0 and F1 were lower after voiced stops indicating laryngeal adjustments to facilitate vibration of the vocal folds. Also, F2 was higher after medial voiced stops suggesting this might be an important cue to voicing in this dialect. But this effect was smaller in medial stops than in word-initial stops as the former did not reveal changes in F2 in response to rate manipulation.
Voiceless /p t k/ were produced with phonetic voicelessness. They long-lag positive VOT and had essentially voiceless closure with a short voicing tail from the preceding vowel. Guttural /tˁ q/ were also produced with phonetic voicelessness. They had short-lag positive VOT and voiceless closure. Both stop classes were articulated with a glottal state consistent with voicelessness: they had higher f0 and F1. F2 was predictably lower after guttural stops indicating the effect of tongue retraction due to pharyngealization.
In line with predictions of LR, VOT in voiceless stops and closure voicing in voiced stops were sensitive to speech rate manipulation in medial position. In slow speech, speakers demonstrated strong tendency to increase both duration of aspiration and duration of closure voicing to maintain it throughout the entire closure.
4 Discussion and conclusion
In this paper, we set to examine stop laryngeal contrast in KhA within the framework of LR based on two types of evidence: the phonetic realization of the sounds and diagnostics of speakers’ ‘control’, namely the effect of speech rate manipulation on VOTs and the degree of intervocalic voicing. We observed a complex pattern, in which two VOT categories – voicing lead and long lag – were mapped on the phonological contrast in voicing, and the short lag category was consistently associated with pharyngealization. This pattern is very similar to the pattern reported in Kulikov (Reference Kulikov2022) for Qatari Arabic.
Word-initially, 93
 $\%$
of the phonologically voiced stops /b d ɡ/ were produced with voicing lead. This ratio is very close to Swedish (Beckman et al. Reference Beckman, Helgason, McMurray and Ringen2011) and Russian (Ringen & Kulikov Reference Ringen and Kulikov2012), in which 100
 $\%$
and 97
 $\%$
of the voiced stops were prevoiced, respectively. The analysis of spectral cues showed that the glottal state was consistent with voicing: both f0 and F1 were lower and F2 was higher suggesting that speakers employed articulatory gestures to expand the supraglottal cavity in order to facilitate vibration of the vocal folds. Phonologically voiceless stops /p t k/ were produced as voiceless aspirated. They had long lag positive VOT and higher f0 and F1. The guttural stops /tˁ q/ were produced as voiceless unaspirated plosives. They had short-lag positive VOT and a glottal state consistent with phonetic voicelessness (i.e. higher f0 and F1). In addition, F2 was predictably lower in guttural stops as a result of tongue retraction (Ghazeli Reference Ghazeli1977).
Word-medially, we evaluated VOT for both plain and guttural voiceless stops and the degree of intervocalic voicing for all stop consonants. Voiceless /p t k/ and /tˁ q/ showed the same VOT patterns as in the word-initial position: voiceless stops /p t k/ had long lag VOT, but VOT was short lag in guttural /tˁ q/. Voiced stops were predominantly prevoiced, as 94
 $\%$
of the cases had a fully voiced closure. On the other hand, voiceless and guttural stops largely blocked the spread of voicing in the closure. They showed a small voicing tail of around 12 ms that continued from the previous sonorant segment. We evaluated the glottal state of the stops by measuring f0 and F1. Similar to the initial position, voiceless stops had higher f0 and F1 compared to the voiced stops.
The results of the current study largely support predictions of LR in terms of speakers’ control of duration of temporal cues. In word-initial position, the three types of VOT responded differently to speech rate manipulation. Duration of voicing lead in voiced stops and long lag in voiceless stops gradually increased as speech became slower replicating the patterns previously reported for languages with prevoicing and/or aspiration (e.g. Kessinger & Blumstein Reference Kessinger Rachel and Blumstein1997, Allen & Miller Reference Sean and Miller1999, Magloire & Green Reference Magloire and Green1999, Beckman et al. Reference Beckman, Helgason, McMurray and Ringen2011, Kulikov Reference Kulikov2020, among many). But short-lag VOT in guttural stops was not affected by rate and remained relatively stable across rate conditions. The fact that gutturals in KhA are consistently realized with short-lag VOT, which stays stable across rate manipulation, can be interpreted as a language specific requirement of this dialect, which links this VOT category with the contrast in pharyngealization.
In addition, we found that the pattern of response to speech rate manipulation in duration of closure voicing in word-medial voiced and voiceless stops mirrors the pattern of response in VOT of word-initial stops. As predicted by LR (e.g. Schwarz et al. Reference Schwarz, Sonderegger and Goad2019, for Nepali), long lag VOT in voiceless and closure voicing in voiced stops increased in slow speech while short lag in guttural stops and the short voicing tails of both phonetically voiceless categories did not change in response to rate manipulation.
Finally, our results demonstrate that the three classes of stops in KhA differed in spectral properties. Although differences in f0, F1, and F2 between voiced and voiceless stops have been previously reported in the literature and are expected, some findings were surprising. Quite predicably, f0 was consistently lower after voiced stops, which mirrors the cross-linguistic pattern (e.g. Westbury Reference Westbury1983, Lisker Reference Lisker1986, Kingston & Diehl Reference Kingston and Diehl1994, among others). But unlike studies that report no or little difference in f0 between voiceless unaspirated and voiceless aspirated stops across languages (e.g. Kirby & Ladd Reference Kirby and Robert Ladd2018), our study demonstrates that long lag VOT in voiceless stops is aligned with higher f0 values than short lag VOT along the lines of Kirby (Reference Kirby2018), who found slightly lower f0 in voiceless unaspirated stops compared to aspirated stops in Khmer, Thai and Vietnamese (languages with a three-way contrast). It is of note that this difference was observed only in word-initial position in both studies, being largely neutralized word- or phrase-medially. These findings probably suggest that higher f0 is typically associated with voicelessness in production, but it can be enhanced in prominent positions. The reason why differences in f0 between unaspirated and aspirated stops are not maintained in all tokens is not clear so far, but we believe it is probably due to the fact that it is not a primary cue to phonological voicing and, thus, it does not have to be obligatorily mapped on the phonological feature that specifies voiceless stops.
We also found consistent lowering of F1 in voiced stops in KhA, which is also a typical pattern across languages (e.g. Summerfield & Haggard Reference Summerfield and Haggard1977, Westbury Reference Westbury1983, Kingston & Diehl Reference Kingston and Diehl1994). This is a typical aftermath of the expansion of the supraglottal cavity in order to create rarefaction and thus reduce supraglottal pressure to facilitate vibration of the vocal folds. F1 in voiceless stops, on the other hand, was considerably higher, but unlike languages like English, where F1 would be expected to be higher in voiceless aspirated stops than in voiceless unaspirated stops as a result of F1 cutback in the former (Stevens & Klatt Reference Stevens and Klatt1974), voiceless aspirated stops in KhA were produced with lower F1 than unaspirated guttural stops. Higher F1 after guttural stops in Arabic, however, is an expected result of tongue root retraction (Ghazeli Reference Ghazeli1977). We argue that this finding provides evidence for non-laryngeal mapping of F1 in KhA gutturals.
Next, we found that F2 is a more important cue to voicing in KhA than in other languages reported in the literature. Whereas previous studies (e.g. Bolla Reference Bolla1981, Westbury Reference Westbury1983, Ahn Reference Ahn2018) demonstrated that F2 can be raised in production of voiced stops due to advancement of the tongue root – another strategy to expand the supraglottal cavity and facilitate glottal pulsing – the results of our study show that speakers use this strategy quite consistently. It is of interest, that F2 is also an important cue to distinguish between voiceless and guttural stops in KhA. F2 is lowered in production of Arabic gutturals because of a specific articulatory gesture of tongue root retraction into the pharyngeal area (Ghazeli Reference Ghazeli1977). Quite predictably, vowels following both guttural stops in our study had lower F2, indicating back articulation. In line with Kulikov (Reference Kulikov2022), we consider low F2 to be the main acoustic correlate for guttural stops in KhA.
Finally, the results of our study demonstrate that the spectral correlates of voicing and emphasis in KhA were also sensitive to manipulation of speech rate. But it is on note that the response patterns were different for f0/F1 and for F2. F0 and F1 were slightly lower in slow speech, but the adjustment of the larynx to the tempo affected realization of all stops in the same fashion. Changes in F2 in response to manipulation of speech rate, in contrast, were found only for voiced and guttural stops. Both increase in F2 for voiced and decrease in F2 for guttural stops were more prominent in slow speech than in fast speech, suggesting selective accommodation of the vocal tract according to phonological specifications of segments. While the greater drop in F2 in slow speech is, in fact, expected due to direct mapping of this cue to the feature [guttural], significant increase in F2 in word-initial voiced stops suggests that tongue advancement to ensure expansion of the pharyngeal cavity in order to effectively maintain glottal pulsing is also an important strategy in this dialect.
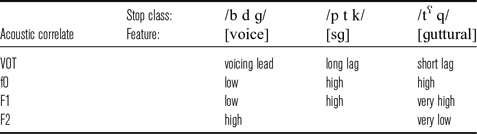
The mapping of the acoustic correlates of the three classes of KhA stops is summarized in Table 24. In line with predictions of LR, we argue that voiced and voiceless stops are specified with [voice] and [sg], respectively, while for guttural stops this laryngeal feature is unspecified. The unaspirated series in KhA, in contrast, is specified with the contrastive feature [guttural], which explains retraction of the tongue and subsequent backing of the neighboring vowel in Arabic (Watson Reference Watson2002).
Mapping of acoustic correlates and phonological features in KhA stops.
Crucially, although KhA uses three VOT categories – voicing lead, short lag, and long lag – the laryngeal contrast in this language is still between voiced and voiceless aspirated stops, similar to the contrast in Swedish (Beckman et al. Reference Beckman, Helgason, McMurray and Ringen2011), Southern American English (Hunnicutt & Morris Reference Hunnicutt and Morris2016), or Qatari Arabic (Kulikov Reference Kulikov2020). The three distinct categories of VOT in KhA do not indicate a three-way contrast like in Eastern Armenian or Thai (Lisker & Abramson Reference Lisker and Abramson1964). The unaspirated series of stops in these languages is another laryngeal category. In contrast, unaspirated stops in KhA differ from voiced and voiceless stops in the non-laryngeal phonological feature [guttural].
To conclude, laryngeal systems contrasting voicing lead and long lag may not be consistent with the principle of ‘economical representation’ in phonology (Chomsky & Halle Reference Chomsky and Halle1968), but they appear to be common in world’s languages. In addition, VOT can signal not only a contrast in voicing but other phonological contrasts as well. Future studies should reveal whether this mapping in a language is stable or it indicates a change in progress.
Acknowledgements
We gratefully thank the editors of the Journal of International Phonetic Association and the anonymous reviewers for their insightful comments and suggestions that helped in improving this paper. We would also like to show our gratitude to all the participants for their assistance with data collection during the COVID-19 pandemic.
Appendix. Word list
Initial position.
Medial position.



