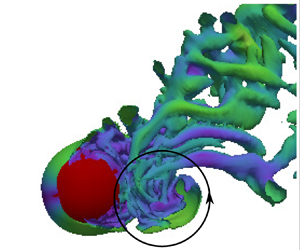



1. Introduction
Vortex-induced vibration of a bluff solid body placed in a fluid flow has been studied for many years because of its practical significance to various engineering fields. Due to the alternate shedding of periodic or quasi-periodic vortices from such a body, large-amplitude vibrations can be excited. This is known as vortex-induced vibration, or VIV. Offshore structures, underwater submarines, marine turbines, buoys, oil conduits and platforms are some examples that can be subject to VIV. The VIV response depends on many factors: the shape of the solid body, its density, the method of mounting, the Reynolds number and even the proximity of the body to a wall or to a free surface (FS). While potential practical applications exist concerning VIV of a bluff body in close proximity to a FS or piercing one, for example, floating offshore ocean structures, such as buoys, floating wind farms, oil-rig platforms and wave power plants, limited research has been conducted to examine effects of the FS on VIV. Thus, this article focuses on VIV of a three-dimensional bluff body in close proximity to a FS or piercing it, using the most generic body shape of a sphere.
Flow past a bluff body placed beneath a FS mainly depends on the scaled distance between the body and the FS,  $h^* = h/D$ (where h is the submergence depth and D the sphere diameter), and the ease of distorting the FS, measured by the Froude number
 $Fr = U_\infty /\sqrt {gh}$ (where
 $U_\infty$ is flow speed and g the gravitational acceleration). The numerical study of Reichl, Hourigan & Thompson (Reference Reichl, Hourigan and Thompson2005) examined the wake of a cylinder close to a FS for Froude numbers
 $Fr \in [0,0.7]$ and submergence depths
 $h^* \in [0.1,5]$, at a Reynolds number of
 $180$. They revealed that for low values of
 $Fr$, when surface deformation is minimal, the FS interface can be approximated with a slip wall, as the flow is mainly governed by geometric constraints. However, when
 $Fr$ exceeds
 $0.3$–
 $0.4$, the surface deformation becomes substantial; and indeed, as the local Froude number becomes close to unity, localised FS sharpening and wake breaking can occur. At moderate
 $Fr$, Reichl et al. (Reference Reichl, Hourigan and Thompson2005) observed previously seen metastable wake states observed in the experimental studies of Sheridan, Lin & Rockwell (Reference Sheridan, Lin and Rockwell1995) and Sheridan, Lin & Rockwell (Reference Sheridan, Lin and Rockwell1997), who examined the flow past a cylinder close to a FS over the Froude number range
 $0.47\leq Fr\leq 0.72$ and Reynolds number range
 $5990\leq Re\leq 9120$.
The findings of Reichl et al. (Reference Reichl, Hourigan and Thompson2005) were consistent with the observations of Kawamura et al. (Reference Kawamura, Mayer, Garapon and Sørensen2002) on the flow past a piercing circular cylinder. That study was conducted using large eddy simulations at  $Re = 2700$ and for
 $Fr= 0.2$,
 $0.5$ and
 $0.8$. They found that at
 $Fr= 0.2$ and
 $0.5$, surface deformation was small, and that the time-mean flow near the surface was similar to that near the bottom symmetry boundary. On the other hand, surface wave generation was large and strongly unsteady at
 $Fr = 0.8$. Yu, Avital & Williams (Reference Yu, Avital and Williams2008) conducted a similar study varying the Froude number up to
 $Fr = 3$ and
 $Re$ up to
 $1 \times 10^5$ with a piercing circular cylinder, and found that the FS attenuated the vortex generation in the near wake. This effect of the FS was found to be stronger as
 $Fr$ was increased, and at
 $Fr=2$, vortex shedding was no longer regular.
Hassanzadeh, Sahin & Ozgoren (Reference Hassanzadeh, Sahin and Ozgoren2012) applied large eddy simulations to investigate the wake flow behind a sphere placed close to a FS at  $Re = 5000$ for submergence depths
 $h^* = 0.25$, 0.5, 1 and 2. They found that the interaction between the FS and the downstream wake was maximum at
 $h^* = 0.25$, and increasing
 $h^*$ resulted in decreasing the level of interaction. At
 $h^*=2$, the FS effect was minimal, and beyond that, flow past the sphere may be assumed to be in a free-stream flow. The experimental studies of Ozgoren et al. (Reference Ozgoren, Dogan, Okbaz, Sahin and Akilli2012, Reference Ozgoren, Canli, Dogan, Sahin and Akilli2013a,Reference Ozgoren, Dogan, Okbaz, Aksoy, Sahin and Akıllıb) and Doğan et al. (Reference Doğan, Özgören, Okbaz, Şahin and Akıllı2018) also revealed that the wake structures behind a sphere strongly depend on the sphere submergence depth.
Compared with a flow-induced vibration (FIV) of a cylinder, much less attention has been directed to FIV of a sphere. Some of the fundamentals of FIV of a sphere were revealed through the systematic series of experimental studies conducted by Williamson & Govardhan (Reference Williamson and Govardhan1997), Govardhan & Williamson (Reference Govardhan and Williamson1997, Reference Govardhan and Williamson2005) and Jauvtis, Govardhan & Williamson (Reference Jauvtis, Govardhan and Williamson2001), using tethered and elastically mounted spheres. When only a single degree of freedom is allowed for the sphere movement, the vibration synchronises with the vortex shedding behind the body, with a characteristic large-amplitude oscillation, as happens for a cylinder. Four distinct modes of sphere vibrations (named modes I–IV) were identified with varying characteristics in terms of sphere oscillation amplitude and phase, and wake structures. The first two modes have been identified as VIV, which appears in the reduced velocity range  $5 \lesssim U^* \lesssim 12$. Mode I is the most robust vibration state, associated with the natural resonance. As the reduced velocity is increased, the sphere motion smoothly transitions to mode II (Govardhan & Williamson Reference Govardhan and Williamson2005). Interestingly, the amplitude of mode II was observed to be about twice that of mode I. In contrast to these experimental observations at high Reynolds numbers, the transition between modes I and II was obscure in the amplitude response at low Reynolds numbers (Behara, Borazjani & Sotiropoulos Reference Behara, Borazjani and Sotiropoulos2011; Behara & Sotiropoulos Reference Behara and Sotiropoulos2016; Rajamuni, Thompson & Hourigan Reference Rajamuni, Thompson and Hourigan2018a,Reference Rajamuni, Thompson and Houriganb). The recent study of Rajamuni, Thompson & Hourigan (Reference Rajamuni, Thompson and Hourigan2020b) numerically investigated vibration modes of a tethered sphere, and found that the effect of Reynolds number on the modes I and II regimes was significant over the Reynolds number range
 $300 \leq Re \leq 2000$, although it was found to be insignificant beyond that range for
 $2000 \leq Re \leq 12\,000$ in the experimental studies of Govardhan & Williamson (Reference Govardhan and Williamson2005). Rajamuni et al. showed that the sphere response amplitude progressively increased as the Reynolds number was increased, especially in the mode II regime. Their response predictions at higher Reynolds numbers (
 $Re = 1200$ and
 $2000$) were close to those seen in previous experimental studies. Importantly, the wakes in the modes I and II regimes consisted of vortex streets of interlaced hairpin-like vortex loops, with the modes distinguished by the phase difference between the vortex force and displacement.
The mode III state, first observed by Jauvtis et al. (Reference Jauvtis, Govardhan and Williamson2001) in the reduced velocity range  $U^* \thicksim 20\text {--}40$, was later identified as a movement-induced vibration by Govardhan & Williamson (Reference Govardhan and Williamson2005). Compared with the first three highly periodic modes, mode IV, found by Jauvtis et al. (Reference Jauvtis, Govardhan and Williamson2001) for
 $U^* > 100$, was characterised by intermittent bursts of vibration. Interestingly, both Rajamuni et al. (Reference Rajamuni, Thompson and Hourigan2018a, with a sphere of mass ratio,
 $m^* = 2.6$) and Rajamuni et al. (Reference Rajamuni, Thompson and Hourigan2020b, with a sphere of
 $m^* = 0.8$) observed mode IV type aperiodic response right after the mode II regime, without the intervening mode III response. In fact, mode III has been seen only with heavy spheres. As the mass ratio of the sphere was increased from
 $0.8$ to
 $80$, at
 $U^* =30$, Rajamuni et al. (Reference Rajamuni, Thompson and Hourigan2020b) observed a smooth transition from mode IV to mode III. With this observation, Rajamuni et al. (Reference Rajamuni, Thompson and Hourigan2020b) hypothesised that mode III is a delicate state that manifests only with the larger inertia of dense spheres. By analysing the sphere response trajectories and Poincare maps, Rajamuni et al. (Reference Rajamuni, Thompson and Hourigan2020b) showed that sphere response is chaotic in mode IV.
The above-mentioned studies have been conducted with a fully submerged sphere far away from a wall boundary. Little research has been undertaken to examine the effect on VIV of the presence of a wall boundary or a FS. Barbosa et al. (Reference Barbosa, Qu, Metrikine and Lourens2017) examined the effects of a plane boundary on the VIV of a freely vibrating cylinder and found that the vibration amplitude increased for gap ratios smaller than  $0.75D$, while the amplitude decreased for gap ratios between
 $2D$ and
 $0.75D$. Chung (Reference Chung2016) numerically investigated 2-degrees-of-freedom (2-DOF) VIV of a horizontal circular cylinder near a FS at
 $Re=100$ for
 $Fr=0.2$ and
 $0.8$ for various submergence depths. It was stated that proximity to a FS strengthened and suppressed the VIV for low and high Froude numbers, respectively. Saelim (Reference Saelim1999) examined self-excited transverse vibrations of a horizontal, elastically mounted cylinder located beneath a FS for
 $0\leq h^*\leq 3$. Although the amplitude response curves agreed with past studies when the cylinder was well submerged, there were dual amplitude response curves when the cylinder was sufficiently close to the FS. In addition, for small submergence depths, very large regions of hysteresis occurred in the variation of oscillation amplitude as a function of the reduced velocity.
Mirauda, Plantamura & Malavasi (Reference Mirauda, Plantamura and Malavasi2014) studied the dynamic response of a sphere immersed in shallow water flow with a sphere of mass ratio  $m^* = 1.34$. For small submergence depths (
 $0\leq h^*\leq 0.5$), the transverse amplitude was significantly smaller with respect to the completely submerged sphere, inhibiting the formation of mode II. Nevertheless, for
 $h^*>0.5$, both modes were observed. However, no attempt was made to examine the effect on fluid forces or the wake behind the sphere to support their claims. Sareen et al. (Reference Sareen, Zhao, Sheridan, Hourigan and Thompson2018) experimentally investigated VIV of a sphere close to a FS over a range of reduced velocities
 $3\leq U^*\leq 20$, by varying the submergence depth from
 $-$0.75 to
 $1$. For the fully submerged case (
 $0\leq h^*\leq 1$), the vibration amplitude decreased monotonically and gradually, as
 $h^*$ decreased, with greater influence on modes II and III. On the other hand, when the sphere pierced the FS, the response amplitude first increased, even beyond that observed for a completely submerged sphere, as
 $h^*$ decreased from
 $0$ to
 $-$0.5, and then it decreased as
 $h^*$ was decreased further. Sareen et al. (Reference Sareen, Zhao, Sheridan, Hourigan and Thompson2018) found both mode I and II type responses, even when the sphere was piercing the FS, in contrast to the findings of Mirauda et al. (Reference Mirauda, Plantamura and Malavasi2014), although the mass ratio was quite different. Sareen et al. (Reference Sareen, Zhao, Sheridan, Hourigan and Thompson2018) also found that the sphere response was insensitive to the Froude number for the range
 $0.05\leq Fr \leq 0.45$.
Recently, Chizfahm, Joshi & Jaiman (Reference Chizfahm, Joshi and Jaiman2021) numerically investigated the transverse FIV of an elastically mounted sphere in the vicinity of a FS at  $h^* = -0.25$, 0 and 1 over the reduced velocity range
 $3 \leq U^* \leq 20$. The response amplitude decreased as
 $h^*$ decreased from
 $1$ to
 $0$, but it increased as
 $h^*$ further decreased to
 $-$0.25, consistent with the findings of Sareen et al. (Reference Sareen, Zhao, Sheridan, Hourigan and Thompson2018). They also reported that the surface deformation was not substantial for the Froude number range
 $Fr \leq 0.44$, although the amplitude response decreased by
 $\sim$30 % as the Froude number was increased from
 $Fr =0.22$ to
 $0.44$. However, the wake flow structure was also observed to be similar across this range.
The main limitation of the experimental study of Sareen et al. (Reference Sareen, Zhao, Sheridan, Hourigan and Thompson2018) was that the three-dimensional (3-D) wake could not be adequately quantified or even characterised. Although through-plane vorticity was determined in a downstream cross-plane, no concrete physical explanation could be drawn about the influence of the FS on the wake, and hence, the changing VIV state. The wake structure of a sphere is intrinsically three-dimensional, and hence difficult to characterise the wake with in-plane velocity measurements on one plane through the wake. Whilst spatio-temporal reconstructions of the wake were attempted by Sareen et al., these may not provide a good representation of the wake dynamics, and especially the near-wake dynamics that governs the coupled VIV forcing. On the other hand, the study of Chizfahm et al. (Reference Chizfahm, Joshi and Jaiman2021) was limited to three submergence depths, and although they presented the global changes to the vortical wake structure over that depth range, the focus was more on the effect of surface distortion on near-wake vorticity than directly relating the details of the near wake to the changes in amplitude response. Thus, further research is called for to understand the findings of Sareen et al. (Reference Sareen, Zhao, Sheridan, Hourigan and Thompson2018) and Chizfahm et al. (Reference Chizfahm, Joshi and Jaiman2021), and to address the questions: (i) What happens to the lift and drag forces when the sphere is close to a FS? (ii) Why does the sphere response become weak as it approaches a FS? And (iii) why does the response subsequently become stronger when the sphere slightly pierces the surface? The present study investigates the influence of the FS on the VIV response, for fully and semi-submerged spheres, and attempts to answer the above questions through a thorough examination of fluid forces and detailed near-wake dynamics.
Prior to proceeding further, it is noted that, in the experiments of Sareen et al. (Reference Sareen, Zhao, Sheridan, Hourigan and Thompson2018), the Froude number was found to be small, with only minor surface deformation detected, and its effect on the VIV response of fully and semi-submerged spheres appeared relatively minor. In particular, as the surface deformation is small for small Froude numbers, through a comparison with experiments (Reichl et al. Reference Reichl, Hourigan and Thompson2005) concluded that a FS can be approximated with a slip wall in such cases. Therefore, rather than modelling this problem as a two-phase flow system, the FS was approximated as a free-slip wall. This also will provide a reference case that can be used to establish the effects of non-negligible Froude number in future studies.
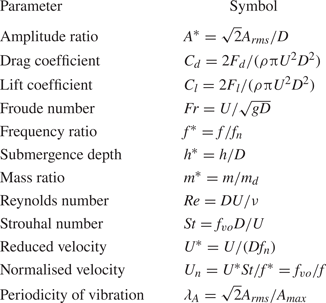
The governing parameters for this study are tabulated in table 1. The article is organised as follows: § 2 describes numerical methods used together with validation studies; results on the sphere response near a FS are presented in § 3.1, then force predictions are given in § 3.2, while § 3.3 provides a comprehensive discussion on the influence of FS on the VIV of a sphere in terms of the vortical structure of the wake in induced forces; finally, concluding remarks are provided in § 4.
Non-dimensional parameters. The streamwise direction is parallel to the  $x$-axis, the
 $y$ and
 $z$ are axes are orthogonal to the flow and referred to as the transverse and vertical directions, respectively. Here,
 $m$ and
 $m_d$ are the mass of the sphere and mass of the displaced fluid, respectively;
 $D$ is the diameter of the sphere;
 $h$ is the vertical distance from the FS to the top of the sphere,
 $U$ is the upstream velocity;
 $\nu$ is the kinematic viscosity of the fluid;
 $f$ is the sphere vibration frequency;
 $f_n$ is the natural frequency of the system (without the added-mass effect);
 $f_{vo}$ is the vortex shedding frequency;
 $F_d$ and
 $F_l$ are the drag and lift forces, respectively; and
 $A_{rms}$ and
 $A_{max}$ are the root-mean-square (r.m.s.) and the maximum of the sphere displacement signals in
 $y$ direction, respectively.

2. Numerical methodology and validation
The computational study employed the open-source finite-volume computational fluid dynamics package OpenFOAM (https://openfoam.org). Efficient parallelisation has been implemented in OpenFOAM, allowing it to tackle reasonably large flow problems efficiently. Recent versions of OpenFOAM enable the solving of fluid–structure interaction problems based on dynamic grid techniques. As the technique requires the reconstruction or movement of the grid at the end of each time step, this approach can add significant computational overhead for problems having continual structure motion. However, the present fluid–structure interaction problem of a single rigid body can be solved efficiently and accurately by using a body-fixed reference frame and a non-deformable grid, as used by Blackburn & Henderson (Reference Blackburn and Henderson1996), Leontini, Thompson & Hourigan (Reference Leontini, Thompson and Hourigan2006) and Leontini, Lo Jacono & Thompson (Reference Leontini, Lo Jacono and Thompson2013). In this section, the problem formulation and fluid-structure interaction (FSI) solver are discussed, the computational details are provided, and finally the validity of the approach and selected resolution for the main simulations are discussed.
2.1. Problem formulation
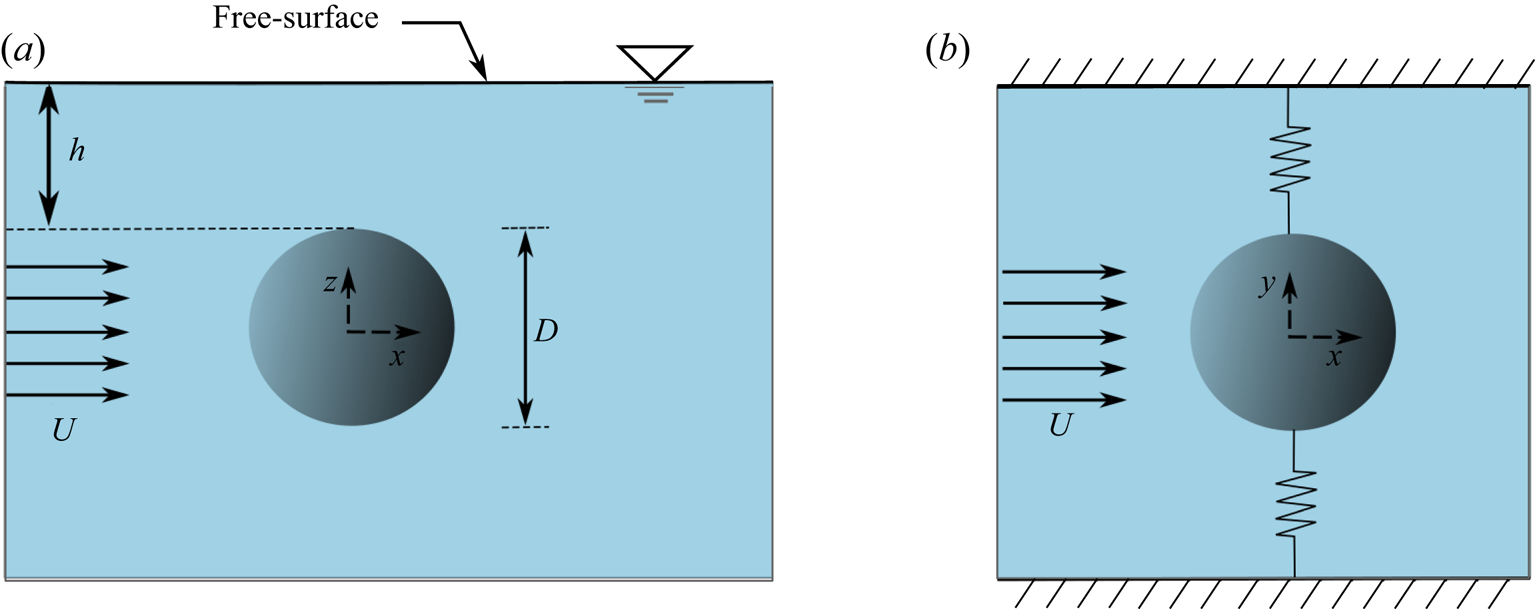
Figure 1 shows a schematic of the set-up used for the study. A solid sphere was mounted in a flow domain with elastic supports in the transverse direction ( $y$ direction) near a FS. The flow was assumed to be in the
 $x$ direction. The diameter of the sphere is
 $D$ and the vertical distance between the top of the sphere and the FS is
 $h$. To achieve the maximum vibration amplitude, the sphere was supported with springs without dampers.
Schematic of the elastically mounted sphere near a FS. Panel (a) shows the side view ( $x$–
 $z$ plane), while (b) shows the plan view (
 $x$–
 $y$ plane).

The fluid flow was modelled in the moving reference frame attached to the centre of the sphere, to avoid grid deformation. This is a non-inertial reference frame, as the velocity of the sphere is not fixed. Therefore, the fixed-frame (momentum) Navier–Stokes equations need to be adjusted by adding the acceleration of the sphere to the momentum equations, as a source term. The fluid was assumed incompressible, Newtonian and viscous. The sphere was taken as a rigid body with a uniformly distributed mass, while its motion was controlled through its set-up as a spring–mass–damper system.
The fully coupled fluid–solid system can be described by the incompressible Navier–Stokes equations given by (3.1) and the continuity equation given by (2.2), together with the governing equation for the motion of the sphere by (2.3)
 $$\begin{gather} \frac{\partial \boldsymbol{u}}{\partial t} + (\boldsymbol{u\cdot\nabla})\boldsymbol{u} ={-} \boldsymbol{\nabla} p + \nu \nabla^2 \boldsymbol{u} - \ddot{\boldsymbol{y}}_{\boldsymbol{s}}, \end{gather}$$
 $$\begin{gather}\boldsymbol{\nabla \cdot u} = 0, \end{gather}$$
 $$\begin{gather}m \ddot{\boldsymbol{y}}_{\boldsymbol{s}} + c \dot{\boldsymbol{y}}_{\boldsymbol{s}}+ k \boldsymbol{y}_{\boldsymbol{s}}=\boldsymbol{f}_{\!\boldsymbol{l}}. \end{gather}$$
Here,  $\boldsymbol {u} = \boldsymbol {u}(x, y, z, t)$ is the velocity vector,
 $p$ is the scalar kinematic pressure and
 $\nu$ is the kinematic viscosity of the fluid. The vectors
 $\boldsymbol {y}_{\boldsymbol {s}}$,
 $\dot {\boldsymbol {y}}_{\boldsymbol {s}}$ and
 $\ddot {\boldsymbol {y}}_{\boldsymbol {s}}$ are the sphere displacement, velocity and acceleration, respectively (the
 $x$ and
 $z$ components of these vectors are set to zero, as the sphere motion was restricted to the
 $y$ direction only). In addition,
 $m$ is the mass of the sphere,
 $c$ is the damping constant (taken as zero),
 $k$ is the structural spring constant and
 $\boldsymbol {f}_{\boldsymbol {l}}$ is the flow-induced vector fluid force acting on the sphere.
2.2. The fluid–structure solver
Recently, we developed a fully coupled FSI solver named vivIcoFoam to efficiently solve FIV problems of an elastically mounted single rigid body. Rajamuni (Reference Rajamuni2018), Rajamuni et al. (Reference Rajamuni, Thompson and Hourigan2018a) and Rajamuni, Thompson & Hourigan (Reference Rajamuni, Thompson and Hourigan2019, Reference Rajamuni, Thompson and Hourigan2020a) have documented this solver in detail, so only brief details are provided here.
This FSI solver is based on the pre-built icoFoam transient solver, which is implemented according to the pressure implicit splitting of operators algorithm introduced by Issa (Reference Issa1986). The vivIcoFoam solver employs a predictor–corrector iterative method, which initially predicts the solid motion and corrects it in several corrector iterations. At the end of each iteration, the fluid equations given in (3.1) and (2.2) are solved with the predicted or subsequently corrected solid acceleration, and the fluid forces induced on the solid are calculated. Readers are referred to Rajamuni et al. (Reference Rajamuni, Thompson and Hourigan2020a) for the details of the solver. The iterative process to move from one timestep to the next terminates when the relative error of the magnitudes of the solid acceleration and the fluid forces are less than a given error bound, typically  $\epsilon = 0.001$. As for the fluid solver, the overall vivIcoFoam solver is of second-order temporal accuracy.
The fluid domain was modelled in a moving frame of reference. The frame motion is acknowledged through adjusting the outer domain velocity boundary conditions (except the outlet boundary). In this study, the velocity is prescribed on all outer boundaries except the outlet. Once the predictor–corrector iterative process has been completed, the velocity at the inlet boundaries is updated according to the velocity of the solid body,  $\dot {\boldsymbol {y}}_{\boldsymbol {s}}$, before proceeding to the next time step.
2.3. Computational details
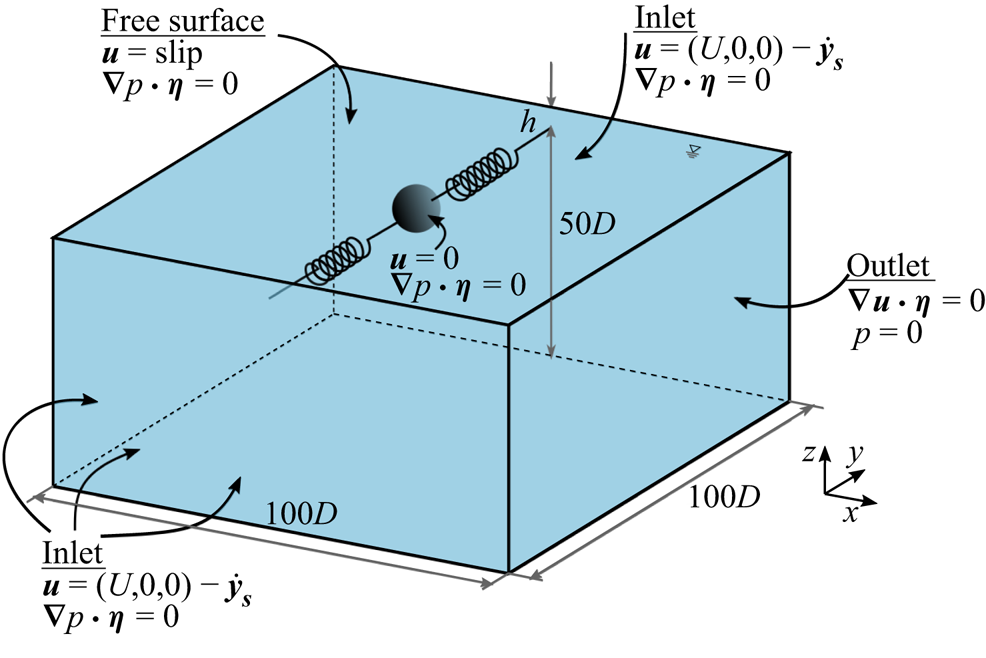
As figure 2 shows, a cubical domain was chosen for the fluid. The sphere was placed at the middle of the fluid domain such that it is at a distance  $h$ to the FS and
 $50D$ to other five boundaries. Four of these boundaries were treated as inlets with the velocity supplied, and the remaining one is the outlet. At the inlet boundaries, a varying Dirichlet boundary condition was prescribed for the velocity, while a zero-gradient Neumann boundary condition was prescribed for the pressure (see figure 2). At the FS, a slip boundary condition for the velocity was applied. The sphere surface was treated as a solid wall and no-slip and no-penetration boundary conditions were applied on it. At the outlet boundary, the pressure was set to zero while the velocity was prescribed as zero gradient in the normal direction.
Schematic of the computational domain and boundary conditions.

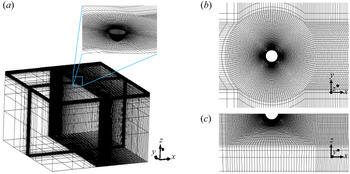
A set of block-structured grids were generated for the simulations by varying the submergence depth in the range  $h^* \in [-0.75,1]$. Each grid was created such that it was concentrated towards the sphere surface with help of ‘O-grid’ blocking. The grid generation process is similar to that of Rajamuni et al. (Reference Rajamuni, Thompson and Hourigan2018a), and as such, details are omitted here. Figure 3 displays the mesh for the
 $h^* = -0.5$ case, for which the sphere pierces the FS by exposing half of it. A grid of this study looks similar to that of Rajamuni et al. (Reference Rajamuni, Thompson and Hourigan2018a) which is cut off by the FS. Grids were generated by fixing the minimum cell thickness in the radial direction from the sphere surface,
 $\delta l$, at
 $0.002D$, having similar characteristics to grid 3 of Rajamuni et al. (Reference Rajamuni, Thompson and Hourigan2018a). This yielded approximately
 $1.2$ million total cells in a grid. Rajamuni et al. showed that their grid 2 (
 $\delta l = 0.004D$) is sufficient for accurate simulation predictions, noting that it has approximately
 $10$–
 $16$ cells in the boundary layer before the separation, with further refinement providing little benefit.
The unstructured-grid computational domain for  $h^* = -0.5$: (a) isometric view, (b) grid at the FS and (c) grid near the sphere surface at
 $x$–
 $z$ plane.

2.4. Validation of the solver
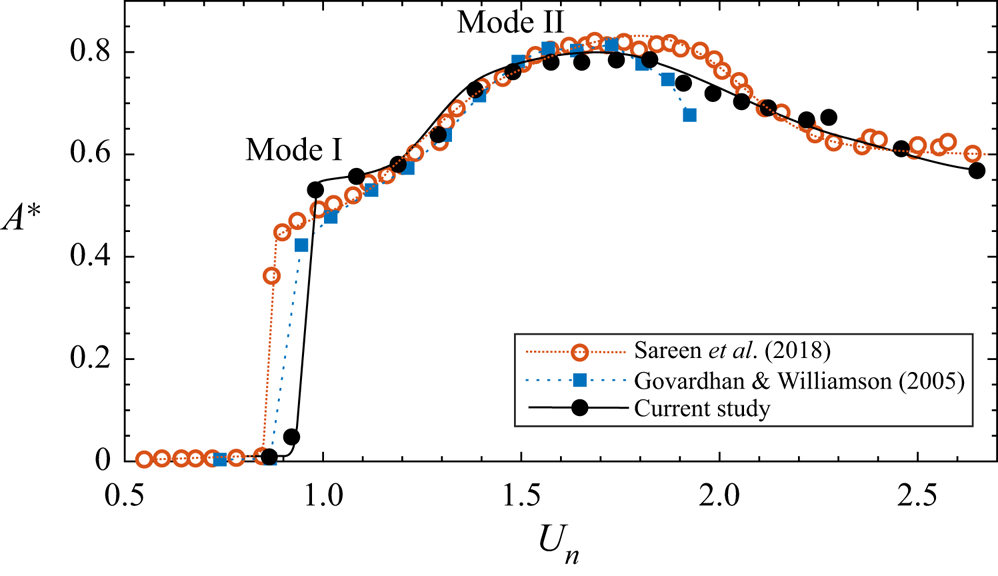
Rajamuni et al. (Reference Rajamuni, Thompson and Hourigan2018a) provide several validation studies of the implemented numerical model, including a standard validation study of the vivIcoFoam solver by comparing the results of VIV of a cylinder at  $Re = 200$ with the results of Leontini et al. (Reference Leontini, Thompson and Hourigan2006). This solver with a similar computational set-up was used for the computational study of Rajamuni, Thompson & Hourigan (Reference Rajamuni, Thompson and Hourigan2016) and Rajamuni et al. (Reference Rajamuni, Thompson and Hourigan2018b) to examine the effect of transverse rotation on the FIV of a sphere. In addition, Rajamuni et al. (Reference Rajamuni, Thompson and Hourigan2019) used it to examine the VIV of a sphere having three degrees of freedom for Reynolds numbers up to 2000. To provide further evidence of the validity and accuracy of the solver for this case, figure 4 shows the prediction of the amplitude response of a completely submerged sphere far away from a wall boundary as a function of normalised velocity (
 $U_n$) at
 $Re = 2000$ in comparison with experimental curves of Govardhan & Williamson (Reference Govardhan and Williamson2005) and Sareen et al. (Reference Sareen, Zhao, Sheridan, Hourigan and Thompson2018). As can be seen, the current predictions match well the findings of both Govardhan & Williamson (Reference Govardhan and Williamson2005) and Sareen et al. (Reference Sareen, Zhao, Sheridan, Hourigan and Thompson2018) over both mode I and II regimes. Although the damping ratio,
 $\zeta$, was non-zero in those studies, the mass damping parameter,
 $(m^*+C_a)\zeta$, was small and hence they could achieve the saturation amplitude which is similar to the case of
 $\zeta = 0$. Note that further convergence studies are provided in the previously mentioned papers (Rajamuni et al. Reference Rajamuni, Thompson and Hourigan2020b, Reference Rajamuni, Thompson and Hourigan2019), confirming that the predictions are insensitive to further increases in grid resolution, even at this Reynolds number.
Comparison of the amplitude response of a completely submerged sphere with results from the experimental studies of Govardhan & Williamson (Reference Govardhan and Williamson2005) and Sareen et al. (Reference Sareen, Zhao, Sheridan, Hourigan and Thompson2018). The present study was carried out at  $Re = 2000$ with a sphere of
 $m^* = 3$ and
 $\zeta = 0$. The mass damping,
 $(m^* + C_a)\zeta$, was approximately
 $0.03$ and
 $0.0169$, for the Govardhan & Williamson (Reference Govardhan and Williamson2005) and Sareen et al. (Reference Sareen, Zhao, Sheridan, Hourigan and Thompson2018) studies, respectively, where
 $C_a$ is the added-mass coefficient.

3. Results
The influence of a FS on VIV was examined for an elastically mounted sphere at  $Re = 2000$, by systematically varying the submergence depth from
 $h^* = -0.75$ to
 $1$. A positive submergence depth corresponds to a fully submerged sphere, while a negative submerged depth represents a piercing sphere. The mass ratio of the sphere was
 $m^* = 3$ for the fully submerged cases. However, since the mass ratio was defined as the ratio of the mass of the sphere to the mass of the displaced fluid, it increased from
 $3$ to
 $19.2$, as
 $h^*$ decreased from
 $0$ to
 $-$0.75. The VIV response of the
 $h^*= 1$ case was effectively identical to that of a fully submerged sphere placed far away from a wall boundary. For the
 $h^* = -0.75$ case, the sphere almost remained stationary having no VIV response, except at
 $U^* \simeq 5$. Most probably this is because only a very small portion of the sphere was submerged in the fluid and so the weaker wake forcing was not strong enough to trigger vibrations. These simulation predictions collapse well with the experimental response curves of Sareen et al. (Reference Sareen, Zhao, Sheridan, Hourigan and Thompson2018), as discussed below; however, unlike the experiments, they provide the detailed near-wake dynamics which is linked to the structural response. No attempt was made to examine submergence depths of
 $h^*>1$ or
 $h^*<-0.75$.
The results are presented in the following three subsections. Initially, the effect of FS on the sphere response is discussed with its oscillation amplitude, periodicity and frequency of the oscillation. Next, the forces exerted on the sphere are given in terms of time-mean values and fluctuation amplitudes. Finally, the nature of the flow is analysed through the vortical structures in the wake behind the sphere.
3.1. The sphere response
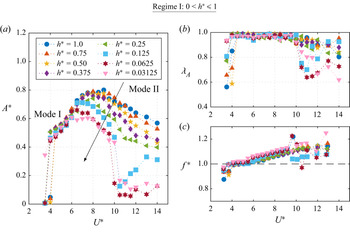
Figures 5 and 6 display the effect of the FS on the sphere response, in terms of the response amplitude,  $A^* = \sqrt {2}A_{rms}$, periodicity of the vibration,
 $\lambda _A= \sqrt {2}A_{rms}/A_{max}$ (see Govardhan & Williamson Reference Govardhan and Williamson2005) and frequency ratio of the signal,
 $f^*=f/f_n$, when the sphere was fully and semi-submerged, respectively. Here,
 $A_{rms}$ is the root mean square of the amplitude and
 $A_{max}$ is the highest sphere amplitude recorded,
 $f$ is the sphere vibration frequency and
 $f_n$ is the natural frequency of the system taking account of the influence of added mass.
VIV response of a fully submerged sphere in the reduced velocity range  $U^* = [3.5,14]$: (a) the sphere response amplitude,
 $A^*$, (b) the periodicity of the sphere vibration,
 $\lambda _A$, and (c) the frequency ratio,
 $f^* = f/f_n$.

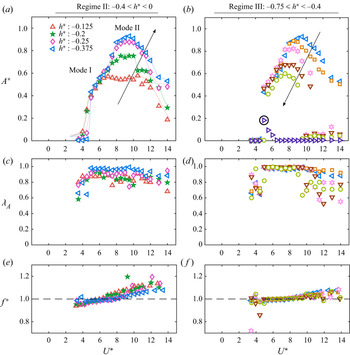
VIV response of a semi-submerged sphere in the reduced velocity range  $U^* = [3.5,14]$: (a,b) the sphere response amplitude,
 $A^*$, (c,d) the periodicity of the sphere vibration,
 $\lambda _A$, and (e, f) the frequency ratio,
 $f^* = f/f_n$.

3.1.1. VIV of a fully submerged sphere (regime I)
For the fully submerged case (regime I:  $0 < h^* \leq 1$), the sphere response amplitude monotonically and gradually decreased as the sphere was moved closer to the FS, as shown in figure 5(a). These findings reasonably match those of Sareen et al. (Reference Sareen, Zhao, Sheridan, Hourigan and Thompson2018) in general, although the Reynolds number of their study varied in the range
 $5000 \leq Re \leq 30\,000$, while
 $Re$ was fixed at
 $2000$ in the present study. However, it is relevant that Govardhan & Williamson (Reference Govardhan and Williamson2005) showed the effect of
 $Re$ is negligible over the range
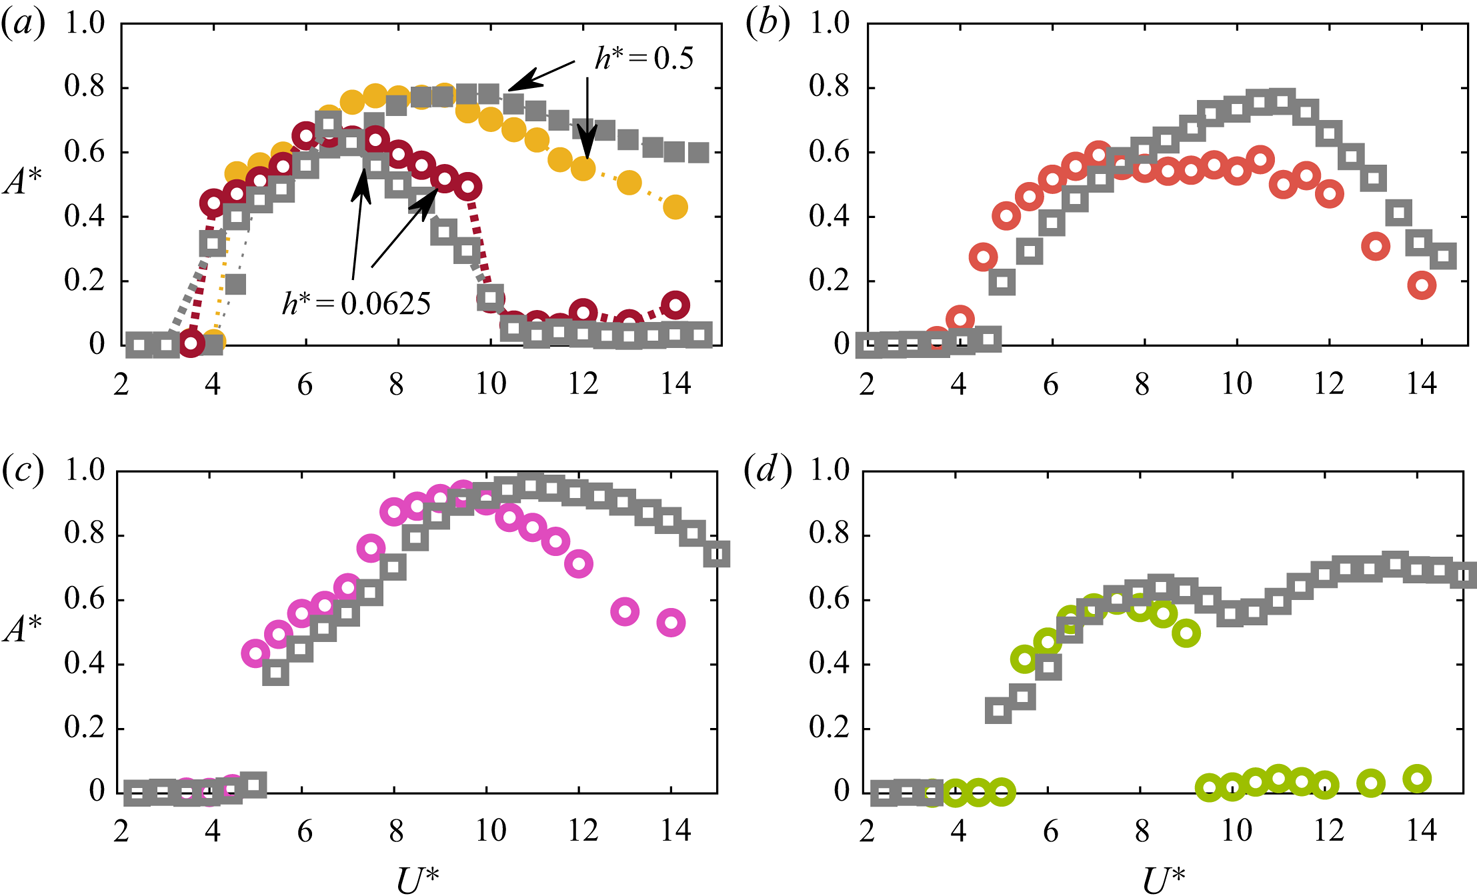
 $2000 \leq Re \leq 12\,000$ for fully submerged spheres. Therefore, it is reasonable to expect similar observations to Sareen et al. (Reference Sareen, Zhao, Sheridan, Hourigan and Thompson2018) despite the Reynolds number difference. It can be seen that the sphere response curves of a fully submerged sphere reasonably reproduce those of Sareen et al. (Reference Sareen, Zhao, Sheridan, Hourigan and Thompson2018), as shown in figure 7(a) for
 $h^*=0.5$ and
 $0.0625$.
Comparison of the sphere response curves,  $\bigcirc$ (colour), with the response curves observed by Sareen et al. (Reference Sareen, Zhao, Sheridan, Hourigan and Thompson2018),
 $\square$ (grey), at (a)
 $h^* = 0.5$,
 $0.0625$, (b)
 $-$0.125, (c)
 $-$0.375 and (d)
 $-$0.625.

The effect of the FS was significant over the mode II regime compared with that for the mode I regime. This is perhaps not surprising since mode II was found to be less robust than mode I (Rajamuni et al. Reference Rajamuni, Thompson and Hourigan2020b), as the latter is due to the natural resonance between the normal shedding frequency and the system frequency. As  $h^*$ was decreased, the maximum response amplitude was smaller and it occurred at a progressively lower reduced velocity. Nevertheless, the sphere response was highly periodic over both mode I and II regimes, even when it was in the vicinity of the FS. This is evident from figure 5(b), which plots the periodicity of the response
 $\lambda _A$ as a function of
 $U^*$, noting
 $\lambda _A = 1$ corresponds to a purely periodic signal. As
 $h^*$ was decreased, the mode II regime also narrowed. At higher
 $U^*$ values, both the response amplitude and the periodicity decreased. Especially when the sphere was very close to the FS (at
 $h^* =0.0625$ and
 $0.03125$), the responses were less periodic (
 $\lambda _A \approx 0.7$), and with amplitudes less than
 $0.2D$ for
 $U^*>10$.
As figure 5(c) shows, the vibration frequency was close to the natural frequency of the system ( $f^* \approx 1$), at each
 $h^*$ value. Within the modes I and II regimes,
 $f^*$ uniformly increased with increasing
 $U^*$, following the same trend observed for VIV of a bluff body placed far away from a wall boundary. Nevertheless, beyond the mode II regime,
 $f^*$ fluctuated as the response was less periodic, especially at lower
 $h^*$ values.
3.1.2. VIV of a semi-submerged sphere (regimes II and III)
When the sphere was positioned so that it pierces the FS, the sphere response amplitude first increased, and then decreased, as  $h^*$ decreased from
 $0$ (or the piercing height of the sphere increased), as found by Sareen et al. (Reference Sareen, Zhao, Sheridan, Hourigan and Thompson2018). Therefore, to analyse the results, the semi-submerged range was partitioned into two: regime II (
 $-0.4< h^*<0$) and regime III (
 $-0.75\leq h^*<-0.4$).
The sphere response when it was slightly below the FS (at  $h^* = 0.03125$, plotted in figure 5a by
 $\blacktriangledown$) and slightly piercing the FS (at
 $h^* = -0.125$, plotted in figure 6a by
 $\triangle$) was similar in terms of the response amplitude. However, the response curve for
 $h^* = -0.125$ was shifted to the right (higher
 $U^*$ values) compared with that for
 $h^* = 0.03125$. In addition, at
 $h^* = -0.125$, the amplitude was roughly
 $0.6D$ until it tapered off towards the end of the
 $U^*$ range. The periodicity of the signal was noticeably lower at this
 $h^*$ value, compared with the fully submerged cases.
In regime II, as  $h^*$ decreased from
 $-$0.125 to
 $-$0.375, the sphere response amplitude increased monotonically and globally, see figure 6(a). This effect was significant in mode II, while it was barely noticeable in mode I. Moreover, the periodicity of the signal lifted as
 $h^*$ decreased, throughout the mode I and II ranges (see figure 6c). At
 $h^* = -0.375$, the maximum oscillation amplitude was
 $0.93D$ at
 $U^* = 9.5$, which is even higher than that of a fully submerged sphere placed far away from a wall boundary. Consistently, Sareen et al. (Reference Sareen, Zhao, Sheridan, Hourigan and Thompson2018) also found that the sphere vibration is at its strongest when the submergence depth is
 $-$0.375, in agreement with the current predictions.
Figures 7(b) and 7(c) compare two response curves in regime II with those of Sareen et al. (Reference Sareen, Zhao, Sheridan, Hourigan and Thompson2018). Comparatively, their response curves were shifted slightly to the right. Also, in their experiments, the sphere vibrated with a relatively larger amplitude at higher reduced velocities. This is likely due to the higher Reynolds number of the experiments.
In regime III, the sphere response amplitude decreased gradually and monotonically and the lock-in regime narrowed, as  $h^*$ was decreased beyond
 $-0.375$. As figure 6(b) shows, the effect was more significant over the mode II range. The current predictions for regime III also collapse well with the findings of Sareen et al. (Reference Sareen, Zhao, Sheridan, Hourigan and Thompson2018), except for the fact that the latter observed two distinct peaks in the vibration response curves. For the current predictions, there was only a small trace of a secondary peak at
 $U^* = 10.5$, for the submergence depths
 $h^* = -0.5$ and
 $-$0.575. As can be seen from figure 7(d), the response curve at
 $h^* = -0.625$ closely matches with that of Sareen et al. (Reference Sareen, Zhao, Sheridan, Hourigan and Thompson2018) until
 $U^*=9$, beyond which they observed a second peak, while there were no significant vibrations in the current predictions. At this submergence depth, only a small portion of the sphere is submerged in the water, and consequently, it may be considered to act as an almost ‘dry’ mass–spring–dashpot system with only weak forcing from the wake. Notably, Sareen et al. (Reference Sareen, Zhao, Sheridan, Hourigan and Thompson2018) observed that a slight reduction of the submergence depth (from
 $h^* =-0.625$ to
 $-$0.688), caused the sphere to reduce its response amplitude significantly, and cease vibrations for
 $U^*>11$. Perhaps also relevant is that the angle between the sphere and fluid surface in this case is small, so relatively minor surface distortion may lead to larger effects on the wake forcing. At a given submergence depth, the vibration response was periodic and sinusoidal (
 $\lambda _A = 1$) in the synchronisation regime, while it was significantly less periodic outside the synchronisation regime – see figure 6(d). Piercing of the surface by the sphere did not significantly affect the
 $f^*$–
 $U^*$ variation, as observed for the fully submerged cases.
When the submergence depth was  $-$0.75, where only one quarter of the sphere height was in the fluid, only synchronised vibrations were seen at
 $U^*=5$,
 $5.5$ and
 $6$. At this depth, the simulations had to go through a very long transition period before reaching the asymptotic state. This is because the mass ratio of the sphere becomes very large (
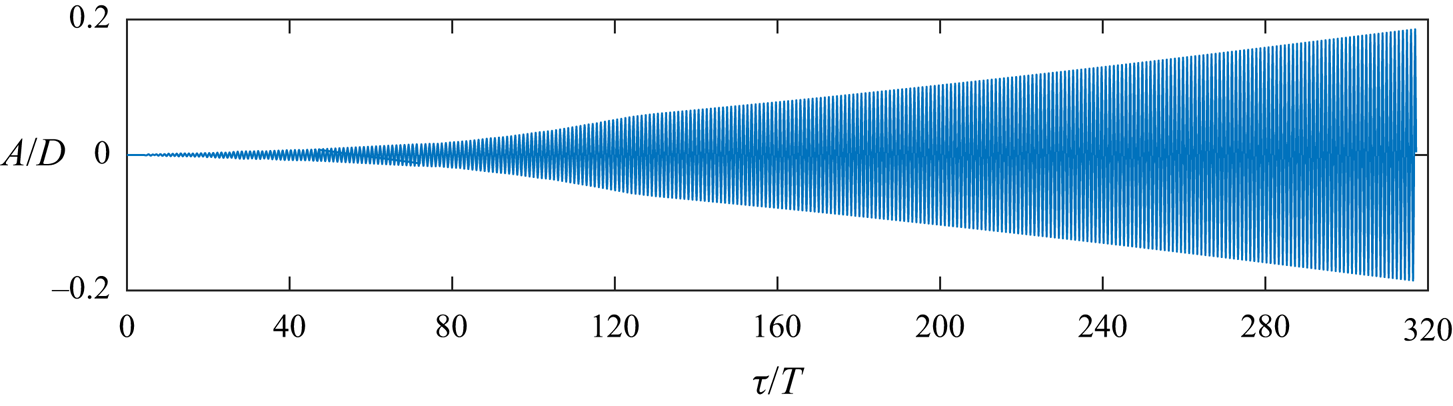
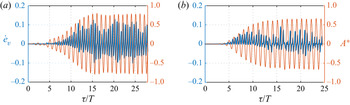
 $m^*=19.2$) in this case with only a small portion of the solid immersed in the fluid. Figure 8 displays the time history of the sphere displacement at
 $U^* = 5$, for
 $320$ oscillation cycles. The vibration amplitude increases only slowly as the simulation time increases and is yet to reach the asymptotic state after three hundred oscillation cycles. It is possible that the simulation would still take hundreds more oscillation cycles to reach the asymptotic state. These extremely long simulations are very costly and were not continued further. The sphere response curve for
 $h^* = -0.75$ given in figure 6(b) was obtained by considering the last
 $10$ vibration cycles, although the signal has yet to reach the asymptotic state. However, to confirm, simulations at other submergence depths reported in these figures were integrated long enough to reach their asymptotic states.
Time history of the sphere displacement,  $A$, at
 $h^* = -0.75$ and
 $U^*=5$. The sphere undergoes a very long transition period before reaching the asymptotic state. In this case, even after 320 cycles, it has not achieved this state.

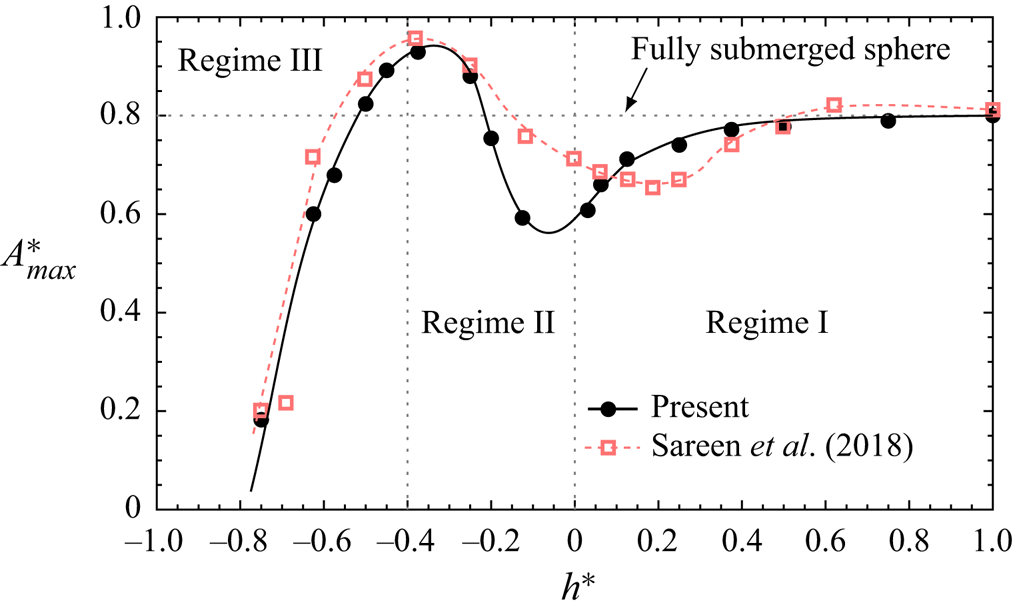
For an overall view of the effect of FS on the VIV response of a sphere, figure 9 plots the maximum oscillation amplitude observed at each submergence depth,  $A^*_{max}$, as a function of
 $h^*$. As discussed in § 3.1.1, in regime I, the maximum vibration amplitude decreased as the submergence depth decreased from
 $h^* = 1$ and sphere was moved closer to the FS. This reduction was larger near the FS. As the submergence depth was decreased further by raising the sphere until
 $h^* \approx -0.4$,
 $A^*_{max}$ continued to increase, indicating the strong effect of the FS and its effect on the wake. In regime III, raising the position of the sphere further,
 $A^*_{max}$ decreased gradually, as
 $h^*$ decreased from
 $-$0.4. This decrement of
 $A^*_{max}$ is probably due to the reducing immersed portion of the sphere and/or due to the mass ratio of the sphere increasing rapidly, as
 $h^*$ is decreased. Interestingly, for submergence depths of
 $h^* = -0.25$,
 $-$0.375,
 $-$0.45 and
 $-$0.5, the maximum response amplitude was even larger than that of a fully submerged sphere placed far away from a wall boundary. Figure 9 also plots the
 $A^*_{max}$–
 $h^*$ curve reported by Sareen et al. (Reference Sareen, Zhao, Sheridan, Hourigan and Thompson2018). The current prediction matches well with that of Sareen et al. (Reference Sareen, Zhao, Sheridan, Hourigan and Thompson2018), especially in regime III. However, Sareen et al. (Reference Sareen, Zhao, Sheridan, Hourigan and Thompson2018) found a local minimum of
 $A^*_{max} = 0.65D$ near
 $h^* = 0.2$, while the current local minimum was
 $A^*_{max} = 0.6D$ close to
 $h^*\approx -0.1$. Thus, the current prediction of the trend of
 $A^*_{max}$ deviates slightly from that of Sareen et al. (Reference Sareen, Zhao, Sheridan, Hourigan and Thompson2018), around zero submergence depth. This is probably a slight Reynolds number effect, since in the experiments the Reynolds number varies as the reduced velocity is changed; however, there are also weak surface waves and quasi-steady surface distortion generated in the experiments which cannot be entirely ruled out as having some effect on the wake.
Plot of the maximum vibration amplitude,  $A^*_{max}$, as a function of the submerged depth,
 $h^*$.

3.1.3. Effect of mass ratio on the sphere response
Although the mass ratio was fixed at  $3$ for the fully submerged sphere simulations, it varies with the submergence depth when the sphere pierces the FS. As
 $h^*$ is decreased from
 $0$ to
 $-$0.625, the mass ratio gradually increases from
 $m^*=3$ to
 $9.48$, and beyond this, as
 $h^*$ is decreased further to
 $-$0.75, the corresponding mass ratio reaches
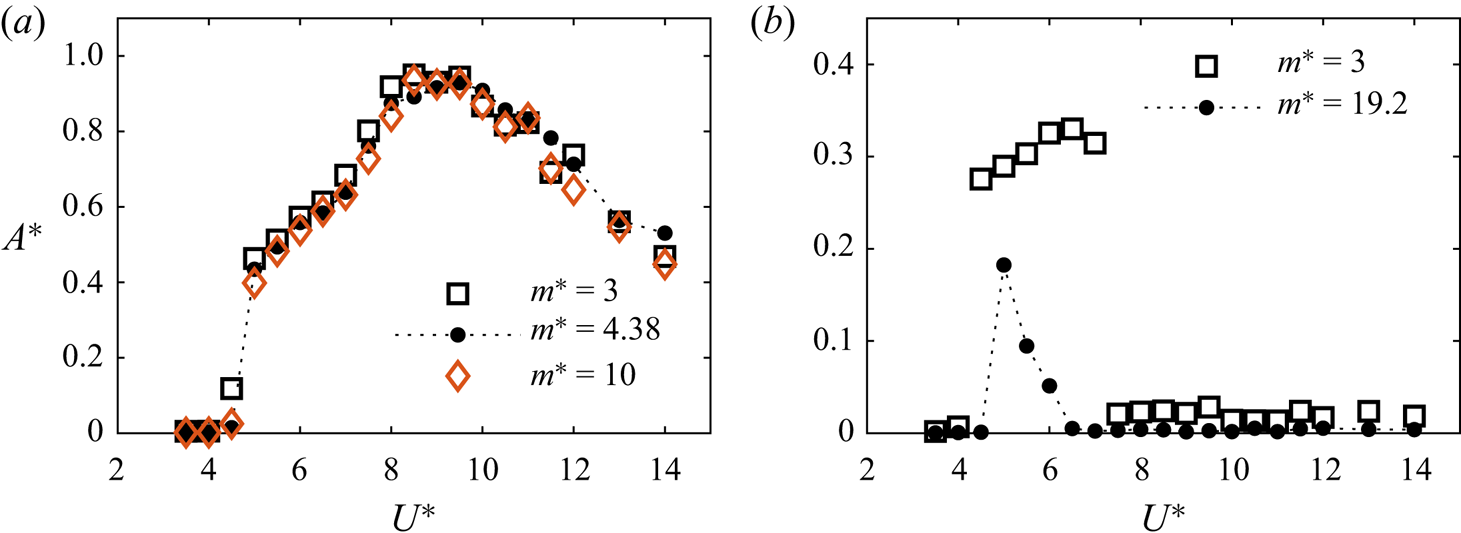
 $19.2$. Figure 10 plots the amplitude response curves for different mass ratios at two representative submergence depths: (a)
 $h^*=-0.375$ for
 $m^* = 3$,
 $4.38$ (the nominal case) and
 $10$; and (b)
 $h^* = -0.75$ for
 $m^* = 3$ and
 $19.2$ (nominal case). As can be seen from figure 10(a), there is very little effect of the mass ratio over the range
 $3\leq m^* \leq 10$ for the moderately piercing case (
 $h^* = -0.375$). Note that this mass ratio range corresponds to submergence depths
 $-0.625 \leq h^* \leq 1$. In a previous study, Rajamuni et al. (Reference Rajamuni, Thompson and Hourigan2018a) also reported a similar finding for a range of
 $1.2\leq m^*\leq 10$ with a sphere placed far from a FS. However, for simulations at
 $h^*=-0.75$, the sphere response amplitude was noticeably higher for the mass ratio of
 $3$ than for
 $19.2$. However, because of the high mass ratio and weaker forcing in this case, the sphere response at
 $m^* = 19.2$ did not reach the final asymptotic state. From these studies, we can assert that the variation of the sphere response curves is due to the influence of
 $h^*$ and not the changing mass ratio, except perhaps for the extreme
 $h^* = -0.75$ case.
The effect of mass ratio on the amplitude response of a piercing sphere: (a)  $h^* = -0.375$; and (b) at
 $h^*=-0.75$. The sphere response is found be insensitive to mass ratio over the range
 $3\leq m^*\leq 10$ (
 $-0.625\leq h^*\leq 1$). For the simulations reported in this paper, as
 $h^*$ is decreased from
 $0$ to
 $-$0.75, the mass ratio increases from
 $3$ to
 $19.2$.

3.1.4. Sphere response for 2-DOF movement
As discussed previously, the effect of the FS was found to be substantial when the sphere was free to translate only in the transverse ( $y$) direction. Nevertheless, a lot of applications exist for systems having
 $2$-DOF movement. Thus, to broaden the applicability to a wider range of FSI problems, a set of simulations was conducted at
 $h^* = -0.375$, by allowing the sphere to freely move in the streamwise (
 $x$) direction as well. The ratio between the natural frequencies of
 $x$ and
 $y$ directions is
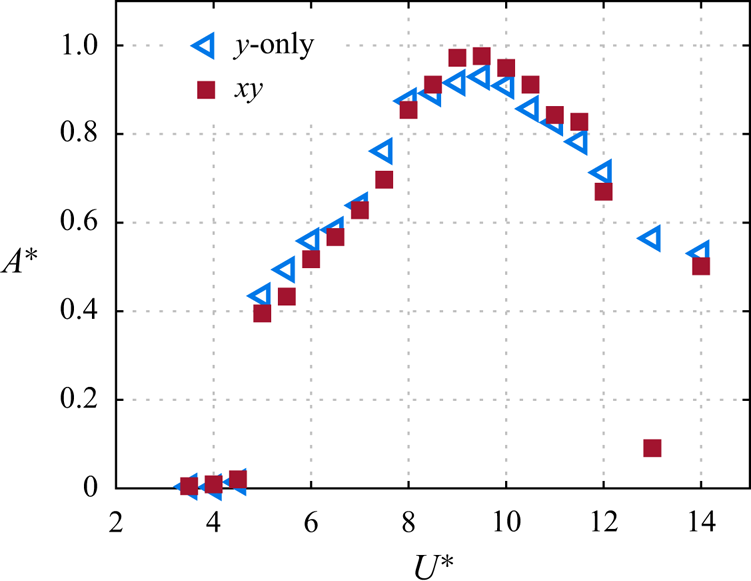
 $1$. Figure 11 compares the responses when the sphere was allowed to have 1-DOF or 2-DOF movement. The sphere response curves almost coincide on each other, indicating the effect of the FS on the vibration response is not very sensitive to the degrees of freedom, at least for the highest-amplitude piercing case. Hence, results presented in this paper allowing
 $y$ only motion are tentatively applicable to a sphere have 2-DOF movement.
Comparison of the response amplitude of 1-DOF ( $y$-only) and 2-DOF (
 $xy$) VIV responses.

3.2. Effect of the FS on fluid forces
As the sphere vibrated symmetrically, the time-mean lift coefficient,  $\overline {C}_l$, was close to zero at each submergence depth and reduced velocity considered. Thus, an analysis of
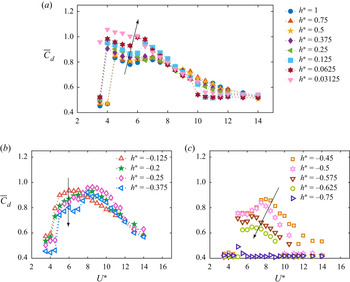
 $\overline{C}_l$ was not included here. Figures 12(a), 12(b) and 12(c) show the variation of the time-mean drag coefficient,
 $\overline{C}_d$, with the reduced velocity at each submergence depth in regimes I, II and III, respectively. At each
 $h^*$, the time-mean drag coefficient increased through the synchronisation regime from its pre-oscillatory value, as has been previously found for a bluff body undergoing VIV (Govardhan & Williamson Reference Govardhan and Williamson1997; Behara et al. Reference Behara, Borazjani and Sotiropoulos2011; Rajamuni et al. Reference Rajamuni, Thompson and Hourigan2018a, Reference Rajamuni, Thompson and Hourigan2019, Reference Rajamuni, Thompson and Hourigan2020b). At a given submergence depth, the value of
 $\overline{C}_d$ increased sharply at approximately
 $U^*\approx 5$, as synchronised vibration is triggered. Then, this increment generally lessened, as the reduced velocity was increased. For
 $h^* = 1$,
 $\overline{C}_d$ increased approximately
 $80\,\%$ at
 $U^* = 4.5$, and this increment of
 $\overline{C}_d$ was negligible at
 $U^*=14$. As
 $h^*$ decreased to
 $0$, the increment of
 $\overline{C}_d$ monotonically increased over the reduced velocity range
 $4.5\leq U^*\leq 7$ and slightly decreased for
 $U^*\geqslant 9.5$ – see figure 12(a). The value of
 $\overline{C}_d = 1.06$ observed at
 $h^* = 0.03125$ and
 $U^*=4$ was the largest from all the cases considered in this study.
Variation of the time-mean drag coefficient,  $\overline{C}_d$ for different
 $h^*$ values in regime I (a), regime II (b) and regime III (c).

The variation of  $\overline{C}_d$ with
 $U^*$ in regimes II and III was significantly different from that of regime I. As can be seen from figure 12(b,c), the
 $\overline{C}_d$–
 $U^*$ curves were roughly bell shaped when the sphere pierces the FS. In regime II, the peak of
 $\overline{C}_d$ shifted progressively to the right (higher
 $U^*$), as
 $h^*$ decreased. Thus, at
 $h^* = -0.2$ and
 $-$0.375, the peaks of
 $\overline{C}_d$ were observed at the heart of mode II. In regime III, the peak of
 $\overline{C}_d$ always occurred close to the peak sphere response of mode II. Consistent with the sphere response, the peak of
 $\overline{C}_d$ monotonically decreased and was observed at a progressively lower
 $U^*$ value, as
 $h^*$ decreased – compare figures 6(b) and 12(c). The above observations indicate that the response of a piercing sphere is significantly different from the response of a fully submerged sphere.
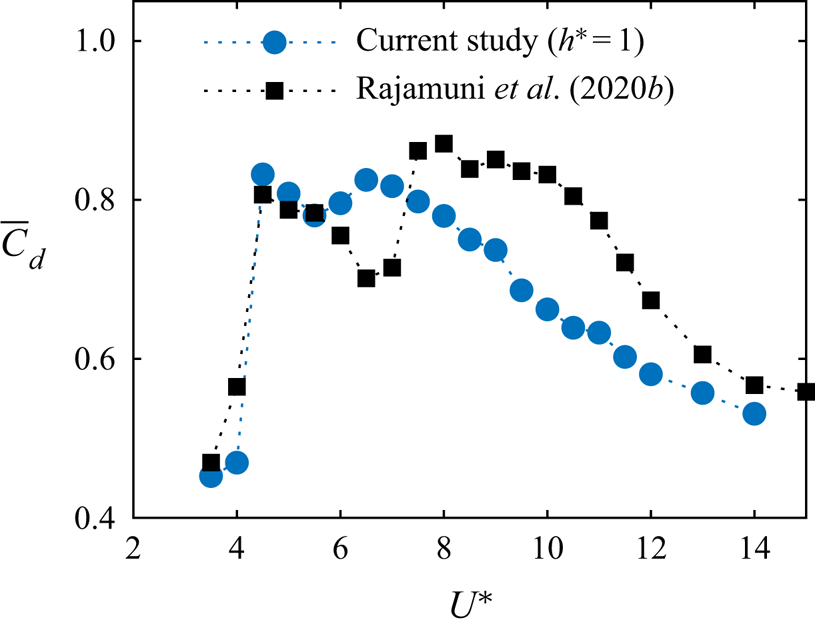
The variation of  $\overline{C}_d$ of a fully submerged elastically mounted sphere reasonably matches with that for a tethered sphere, as can be seen from figure 13, which provides a comparison of current prediction at
 $h^*=1$ with that for a tethered sphere from our previous study (Rajamuni et al. Reference Rajamuni, Thompson and Hourigan2020b). Consistently, there were two peaks in the current prediction in the
 $\overline{C}_d$–
 $U^*$ curve. Nevertheless, the value of
 $\overline{C}_d$ was slightly different for mode II. In the mode II regime, a tethered sphere experiences a large time-mean drag compared with an elastically mounted one. As can be seen from figure 12(a), at each
 $h^*$ value in regime I, there were two peaks in the
 $\overline{C}_d$–
 $U^*$ curves.
Comparison of the time-mean drag coefficient at  $h^* = 1$ with predictions of Rajamuni et al. (Reference Rajamuni, Thompson and Hourigan2020b) for a tethered sphere. The Reynolds number of the flow is
 $2000$ and the mass ratios are
 $3$ and
 $0.8$, in the current study and the study of Rajamuni et al. (Reference Rajamuni, Thompson and Hourigan2020b), respectively.

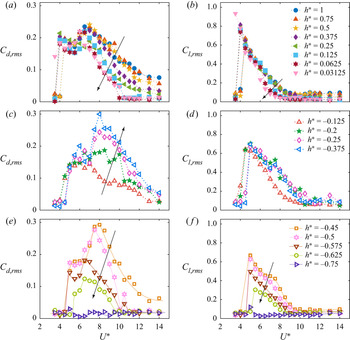
The fluctuating components of the force coefficients were analysed using the r.m.s. values. Figure 14 shows the variation of the r.m.s. of the drag and lift coefficients ( $C_{d,rms}$ and
 $C_{l,rms}$) with reduced velocity for various submergence depths, covering all three regimes. In regime I, as evident from figures 14(a) and 14(b), there are sudden jumps in both
 $C_{d,rms}$ and
 $C_{l,rms}$ associated with the sudden increase in the amplitude response at the beginning of the synchronisation regimes. Both
 $C_{d,rms}$ and
 $C_{l,rms}$ generally decreased as
 $U^*$ increased. However, there were two peaks in the
 $C_{d,rms}$–
 $U^*$ curves, as shown in figure 14(a). Here, both
 $C_{d,rms}$ and
 $C_{l,rms}$ roughly decreased with decreasing
 $h^*$, having a significant effect in mode II. This is consistent with the reduction of the response amplitude as the sphere gets close to the FS.
 $C_{l,rms}$ dropped back to its original value at a progressively lower reduced velocity, as
 $h^*$ decreased towards
 $0$. The current predictions of
 $C_{l,rms}$ for a fully submerged sphere match well with those of Sareen et al. (Reference Sareen, Zhao, Sheridan, Hourigan and Thompson2018).
Variation of the r.m.s. drag coefficient,  $C_{d,rms}$, (a,c,e) and the r.m.s. lift coefficient,
 $C_{l,rms}$, (b,d, f), with reduced velocity for various submergence depths in regimes I (a,b), II (c,d) and III (e, f).

In contrast to sudden jumps of  $C_{d,rms}$ in regimes I and III, it increased gradually in regime II, associated with a gradual increase of the sphere response amplitude. The r.m.s. of the drag coefficient increased with decreasing
 $h^*$, especially in mode II, as did the sphere response amplitude – see figure 14(c). Similar to
 $C_{d,rms}$,
 $C_{l,rms}$ also increased with decreasing
 $h^*$ in regime II. However, as can be seen from figure 14(d), the
 $C_{l,rms}$–
 $U^*$ curve of
 $h^* = -0.125$ was different from that of other
 $h^*$ values, which have local peaks near
 $U^*=7.5$. In regime III, both
 $C_{d,rms}$ and
 $C_{l,rms}$ decreased with decreasing
 $h^*$, associated with the reduction in sphere vibration amplitude. As observed for fully submerged cases,
 $C_{d,rms}$–
 $U^*$ curves of semi-submerged cases also consist of two peaks that can be related to the mode I and II vibrations.
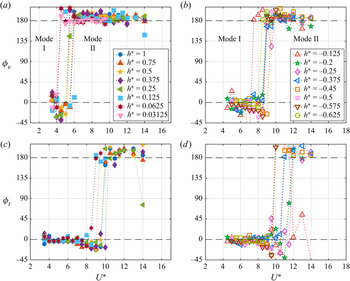
To explore the effect of FS on the mode of sphere vibration, the vortex phase,  $\phi _v$, and total phase,
 $\phi _t$, were examined. The total lift force acting on the body,
 $F_{total}$, can be decomposed into to a potential force component,
 $F_{potential} = - m_a \ddot {\boldsymbol {y}}_{\boldsymbol {s}}(t)$, that arises due to the potential added-mass force, and a vortex force,
 $F_{vortex}$, that is due to vorticity within the flow domain (Lighthill Reference Lighthill1986; Govardhan & Williamson Reference Govardhan and Williamson2005),
 \begin{equation} F_{vortex} = F_{total} - F_{potential},\end{equation}
here,  $m_a$ is the added mass due to the acceleration of the sphere. It is the product of added-mass coefficient and the displaced mass of fluid (
 $m_a = C_A m_d$). For a fully submerged sphere placed far away from a wall boundary,
 $C_A = 0.5$ and
 $m_d = (4/3){\rm \pi} (D/2)^3 \rho$, and thus
 $m_a = {\rm \pi}D^3 \rho /12$.
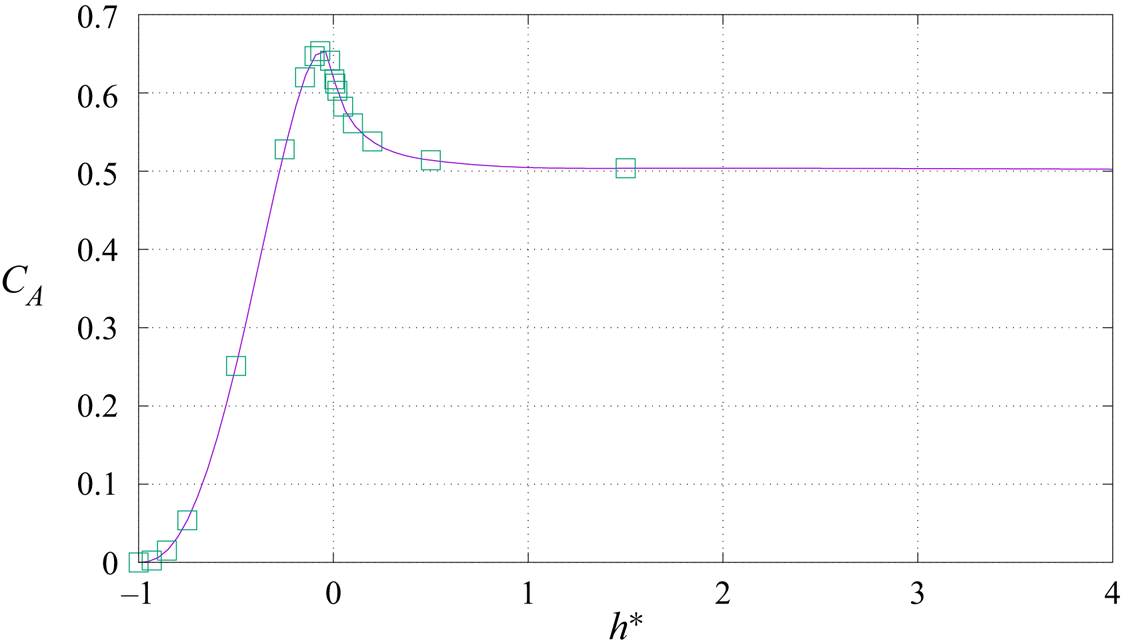
As the sphere approaches or pierces the surface, the added mass varies from the fully submerged value. This can be estimated by setting up a simulation where a constant force is applied to the sphere and the acceleration is measured. The difference between predicted acceleration (assuming no added-mass effect) and the actual acceleration extrapolated to time zero can be used to calculate the added mass. Figure 15 shows the predicted added-mass coefficient as a function of  $h^*$, when the FS is approximated with a non-deformable free-slip boundary. Note that the value quickly asymptotes to the fully submerged value of
 $C_A = 0.5$ as the sphere is increasingly submerged: at
 $h^* = 0.5$,
 $C_A \simeq 0.515$. The estimated accuracy of the added-mass coefficient is approximately 1 %, given that the predicted value at
 $h^* = 9.5$ was
 $C_A = 0.503$ – approximately 0.6 % larger than the accepted value from potential flow theory.
Computed variation of the added-mass coefficient with the submergence ratio for the zero Froude number (non-deformable free-slip surface) case.

The vortex and total phases are the phase differences between the total and vortex forces, and the sphere displacement, respectively. The sphere vibration mode transition between modes I and II was found to be associated with approximately a  $180^{\circ }$ phase shift in
 $\phi _v$ (Govardhan & Williamson Reference Govardhan and Williamson2005; Rajamuni et al. Reference Rajamuni, Thompson and Hourigan2018a, Reference Rajamuni, Thompson and Hourigan2020b; Sareen et al. Reference Sareen, Zhao, Sheridan, Hourigan and Thompson2018). The study of Govardhan & Williamson (Reference Govardhan and Williamson2000), on VIV of an elastically mounted cylinder, showed that a shift in
 $\phi _v$ or
 $\phi _t$ of a purely sinusoidal vibration response with zero damping ratio should be abrupt, as the phase can only be either
 $0^{\circ }$ or
 $180^{\circ }$ in the equilibrium state. The switching from
 $\phi _v = 0^{\circ }$ to
 $180^{\circ }$, occurs as the vibration frequency crosses the natural frequency of the system (
 $f^*=1$ line). Rajamuni et al. (Reference Rajamuni, Thompson and Hourigan2018a) also verified this behaviour for the mode transition of a tethered sphere between modes I and II.
Consistently, we found that  $\phi _v$ switched suddenly from
 $0^{\circ }$ to
 $180^{\circ }$ with increasing
 $U^*$, indicating a vibration mode transition from mode I to mode II at each submergence depth, see figure 16(a,b). Govardhan & Williamson (Reference Govardhan and Williamson2005) explained that the shift in vortex phase is due to the shift in the timing of vortex formation. For a fully submerged sphere, the mode transition occurred in the range,
 $4\leq U^* \leq 6$. However, for a piercing sphere, the mode transition was delayed, by expanding the mode I regime. For
 $h^*<0$, the mode transition occurred in the range,
 $7.5 \leq U^* \leq 9$.
Variation of the vortex phase,  $\phi _v$, and total phase,
 $\phi _t$, with
 $U^*$ (a,c) in regime I and (b,d) regimes II and III. Shift of
 $\phi _v$ from
 $0^{\circ }$ to
 $180^{\circ }$ indicates the vibration mode transitions from mode I to mode II.

As shown in figure 16(c,d), the total phase was also switched from  $0^{\circ }$ to
 $180^{\circ }$, when the sphere response reached the peak saturation value. Within mode I, the sphere vibrated with an amplitude of
 $A^*\simeq 0.5$ by phase aligning with both vortex and total forces. The sphere vibrated with a large amplitude during the
 $U^*$ range when
 $\phi _v = 180^{\circ }$ and
 $\phi _t = 0^{\circ }$, for example, at
 $h^* = 1$ and
 $6\leq U^*\leq 9.5$. This regime can be identified as mode II. Beyond this regime, both
 $\phi _v$ and
 $\phi _t$ were
 $180^{\circ }$, and the sphere response amplitude decreased with increasing
 $U^*$. Rajamuni et al. (Reference Rajamuni, Thompson and Hourigan2018a) also reported a similar result for an elastically mounted sphere placed far away from a FS. Even for a cylinder, there are sudden jumps in
 $\phi _v$ and
 $\phi _t$, which are related to the switching of the vibration branches. Consistent with the current predictions, the upper branch for VIV of a circular cylinder was also observed when
 $\phi _v = 180^{\circ }$ and
 $\phi _t = 0^{\circ }$.
3.3. Analysis of vortical structures in wake
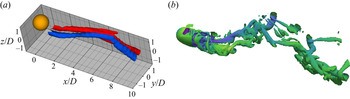
Although Sareen et al. (Reference Sareen, Zhao, Sheridan, Hourigan and Thompson2018) have previously investigated VIV of a sphere close to a FS experimentally, the fluid–structure interaction was not well explained, as it was not possible to map the wake in any detail. The streamwise vorticity field was obtained on a single downstream cross-plane. From these data, the wake was visualised through spatio-temporal reconstructions using phase-averaged vorticity fields. Figure 17 compares one spatio-temporal reconstruction from Sareen et al. (Reference Sareen, Zhao, Sheridan, Hourigan and Thompson2018) with the predicted instantaneous wake visualised by the  $Q\ {\rm criterion}\ (Q = 0.5^{\ast}{\rm (vorticity}^{2} \,-\, {\rm strain\ rate}^{2}))$ for a similar parameter set. Such reconstructions can provide only limited information about the actual wake, and are not representative of any instantaneous snapshot of the wake structure. In particular, as the wake near the sphere was not quantified, that study could not provide much insight into why the sphere vibration varies as its position approaches a FS and pierces it. To try to increase our understanding of the role of the near-wake dynamics on the varying VIV response, here, we carefully examine the near wake for different submergence depths, focusing on both the vorticity field and iso-surfaces of the
 $Q$ criterion. Both the near wake and far wake are characterised and analysed, and concrete interpretations for the distinct sphere responses as
 $h^*$ is varied are provided below.
Comparison of the spatio-temporal reconstruction of the vorticity field from experiments with the predicted wake structure: (a) spatio-temporal reconstruction of the streamwise vorticity crossing the transverse plane at a distance of  $1.5D$ from the sphere rear surface at
 $(h^*, U^*) = (0.125,10)$ from Sareen et al. (Reference Sareen, Zhao, Sheridan, Hourigan and Thompson2018), and (b) the numerically predicted wake structures at
 $(h^*,U^*) =(0.0625,9)$ visualised by the
 $Q$-criterion at
 $Q = 0.01$.

To explore the wake structures behind the sphere, very fine grids having a large number of cells near the sphere surface and the downstream were generated for eight submergence depths, to better resolve the very fine details of the near-wake vortical structures. Each of these grids contains approximately  $5.3$ million hexahedral cells. The results presented in this section were acquired by simulating the flow on these grids for one to two oscillation cycles starting from snapshots from the existing simulations.
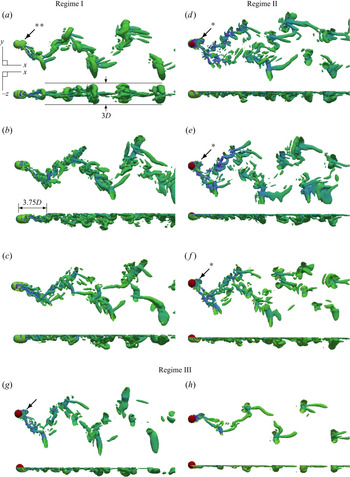
The wake structure behind the sphere under VIV was found to be modified substantially as the sphere approached the FS and pierced it. To explore the effect of the FS, wake structures were observed at various submergence depths, by fixing the reduced velocity at  $U^* = 9$, as the sphere vibration was approximately maximum close to this reduced velocity in almost all of the cases. In § 3.1, the submergence depth range
 $-0.75\leq h^* \leq 1$ was partitioned into three regimes based on the characteristics of the sphere response. Covering all three regimes, figure 18 displays iso-surfaces of the wake visualised by the
 $Q$-criterion in two orthogonal planes for eight
 $h^*$ values. In each case, the sphere is in its peak position of a vibration cycle. As can be seen, the wake behind the sphere varied gradually, as
 $h^*$ decreased from
 $1$; nevertheless, it has a distinctly different structure in each regime. Hence, partitioning the submergence depth range based on the sphere response agrees well with the changing wake pattern.
Iso-surfaces of the wake visualised using the  $Q$ criterion (
 $Q = 0.01$) and coloured according to the velocity at
 $U^* = 9$, for
 $(a)\ h^* = 1,\ (b)\ 0.25,\ (c)\ 0.0625,\ (d)\ {-}0.125,\ (e)\ {-}0.2,\ (f)\ {-}0.375, (g)\ {-}0.45\ {\rm and}\ (h)\ {-}0.625:$ (a–c) regime I, (d–f) regime II and (g,h) regime III. The asterisks indicate the presence of a vortex bubble. Flow is from left to right.

3.3.1. Regime I
At  $h^* = 1$, the wake behind the sphere consists of two trails of two-sided hairpin loops, as shown in figure 18(a). This wake strongly resembles the wake observed in the synchronisation regime of a sphere placed far away from a wall boundary by Govardhan & Williamson (Reference Govardhan and Williamson2005), Behara et al. (Reference Behara, Borazjani and Sotiropoulos2011) and Rajamuni et al. (Reference Rajamuni, Thompson and Hourigan2018a, Reference Rajamuni, Thompson and Hourigan2020a,Reference Rajamuni, Thompson and Houriganb). It also supports the finding that the effect of FS on VIV of a sphere was insignificant for
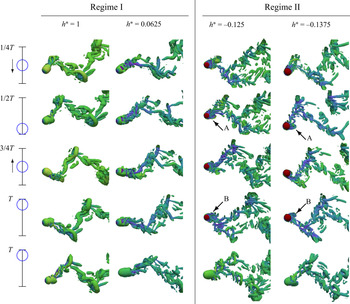
 $h^*\geq 1$. Figure 19 shows the evolution of the wake over a vibration cycle at four
 $h^*$ values:
 $h^* = 1$ and 0.0625 from regime I and
 $h^* = -0.125$ and
 $-$0.375 from regime II. As shown in the first column of figure 19 and in see supplementary movie 1 available at https://doi.org/10.1017/jfm.2021.873, at
 $h^* = 1$, there are two large-scale vortex loops shed per oscillation cycle from the opposite sides of the sphere. Although these two vortex loops were connected near the sphere, they become disconnected as they convect downstream. The wake is approximately symmetric in the
 $x$–
 $y$ plane, thus, the wakes viewed from above and below the FS are nearly identical – compare the structures given in the last two rows of the second column of figure 19.
Evolution of the wake structures for one sphere oscillation cycle in regime I ( $h^* = 1$ and 0.0625) and regime II (
 $h^* = -0.125$ and
 $-$0.375). Four columns show the instantaneous wake structures observed at four time instances of a vibration cycle for
 $h^{*} = 1, 0.0625, -0.125\, {\rm and}\, {-}0.375$. First four rows display wake structures viewed from above the FS, while the last row displays wake structure viewed from below the FS at
 $T$, where
 $T$ is the length of a vibration cycle.

As the sphere vibrates in the  $y$ direction, the thickness of the wake in the
 $x$–
 $z$ plane is comparatively small. For
 $h^* = 1$, it spans only
 $3$ diameters, i.e. vortex loops were always below the FS, and the largest vortex ring was about to connect to the FS; consequently, the interaction of the FS and sphere vibration was negligible. Thus,
 $h^*=1$ again can be identified as the minimum submergence depth, or critical submergence depth, where the sphere response is not altered by the FS. Extrapolating from this, for
 $h^*<1$, vortex loops connected to the FS are expected to appear.
In regime I, as evident from figures 18(b) and 18(c), the wake structures adjust substantially as the distance between the top of the sphere and the FS becomes smaller than one diameter. For  $0 < h^* < 1$, downstream vortex loops are connected to the FS, as expected. The shape of the vortex loops is also modified, by stretching and twisting. These observations of vorticity transformation in the current results closely relate to the case of a vortex ring approaching a FS, as reported by Zhang, Shen & Yue (Reference Zhang, Shen and Yue1999). They explained that the mechanisms of vorticity transformation via turning, stretching and diffusion take on distinct roles in the surface layers: an inner thin viscous layer resulting from the dynamic free-stress boundary condition at the FS and a thick outer blockage layer, due to the kinematic boundary condition at the FS. The dominant mechanism in the blockage layer is vortex turning, which in the viscous layer is due to viscous diffusion, while vortex stretching remains important throughout. Similar observations of vortex disconnection and connection at a FS were reported by Bernal & Kwon (Reference Bernal and Kwon1989), Ohring & Lugt (Reference Ohring and Lugt1991), Gharib & Weigand (Reference Gharib and Weigand1996), Reichl et al. (Reference Reichl, Hourigan and Thompson2005) and Campagne et al. (Reference Campagne, Cazalbou, Joly and Chassaing2009).
Wakes at  $h^* = 0.25$ and
 $0.0625$ were moderately dense with small structures, compared with the wake for the
 $h^*=1$ case. Consequently, the wake convected downstream in a zig-zag pattern, displaying many interconnected loops, rather in two distinct trails as for the
 $h^*=1$ case. At
 $h^* = 0.25$, the near wake appears less affected by the FS, albeit that the near wake for
 $h^* = 0.0625$ is certainly affected by the FS, as the sphere is then very close to the FS – see figure 18(b,c). For sufficiently large submergence depths, only the far wake is in the viscous layer, not the near wake. For example, at
 $h^* = 0.25$, vortex diffusion to the FS is observed approximately
 $3.75$ diameters downstream from the centre of the sphere, as indicated in figure 18(b).
In § 3.1.1, we reported a systematic reduction in the sphere vibration amplitude with decreasing  $h^*$ in regime I. Specifically, at
 $U^* = 9$, the sphere vibration amplitude reduced from
 $A^* = 0.8$ to
 $0.51$, as the submergence depth decreased from
 $h^* = 1$ to
 $0.03125$. However, the reduction of
 $A^*$ remains negligible until approximately
 $h^* = 0.375$ – see figure 9. This reduction of the response amplitude is strictly associated with the surface layer(s) in which the near wake resides. For large
 $h^*$ values, the near wake is affected only by the blockage layer, resulting in a small reduction of the vibration amplitude. Nevertheless, for small submergence depths, the near wake is affected also by the viscous layer, causing a significant reduction of the VIV response amplitude, due to substantial modification of the wake with vorticity diffusion at the FS. From this, we can conclude that the VIV response of a fully submerged sphere is sensitive to the proximity of the sphere to the viscous layer.
The second column of figure 19, together with supplementary movie 2, show the evolution of the wake at  $h^* = 0.0625$ for one oscillation cycle of the sphere. The wake has been adjusted significantly compared with the wake at
 $h^* = 1$, especially near the sphere surface. Obviously, the wake is no longer symmetric through the
 $x$–
 $y$ plane, as the elongated vortex core that wraps the sphere opens from the FS side – see the last two rows of the second column of figure 19. Nevertheless, two large-scale vortex loops are shed per oscillation cycle, maintaining the VIV response.
3.3.2. Regime II
An interesting wake structure is found when the sphere pierces the FS. Figure 18(d–f) display a visualisation of the wake using iso-surfaces of the  $Q$ criterion for
 $h^* = -0.125$,
 $-$0.2 and
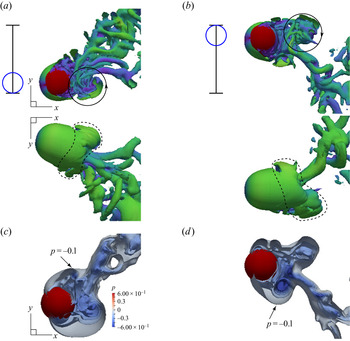
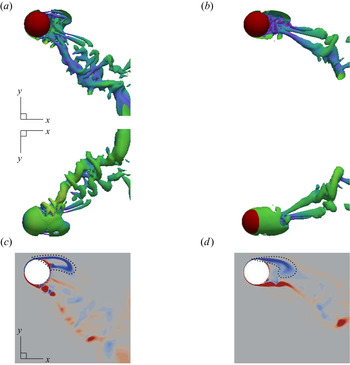
 $-$0.375, respectively. As can be seen, the wake behind the sphere in regime II consists of a collection of small structures that are more dispersed, compared with a more regulated wake in regime I. The wake consists of both: vortex tubes, which are spiralled, elongated and located strictly below the FS; and vortex loops that are twisted, elongated and connected to the FS. Obviously, the effect of the viscous layer is pronounced everywhere, including in the near wake. Interestingly, a vortex bubble connected to the FS appeared protruding in the near wake behind the sphere that is not seen for a fully submerged sphere; these vortex bubbles are indicated by
 $*$ in figure 18(d–f) and are shown in more detail later in figure 20. These vortex bubbles can be recognised as an added feature in the modification of the hairpin vortex ring of the
 $h^* = 1$ case, indicated by
 $**$ in figure 18(a), as the sphere pierces the FS. Readers are encouraged to watch the supplementary movies, to get a clear view of these vortex bubbles. The evolution of the wake and the effect of this new vortex bubble are discussed below in detail, for the
 $h^*= -0.125$ case.
Vortex whirling in the near wake at  $h^* = -0.125$: (a,b) iso-surfaces of
 $Q$ criterion at
 $Q=0.001$ when the sphere in the valley and peak positions, respectively; (c,d) iso-surfaces of pressure at
 $p=-0.1$,
 $-$0.2,
 $-$0.3,
 $-$0.4,
 $-$0.5 and
 $-$0.6, with the sphere in the valley and peak positions, respectively. With the sphere is in its valley (peak) position, vortices behind it whirl in the counterclockwise (clockwise) direction. The second row shows the wake viewed from below the FS, indicating the asymmetric vortex loops.

The third column of figure 19 and supplementary movie 3 display the evolution of the wake for a sphere vibration cycle for  $h^* = -0.125$. Over a vibration cycle, vortex shedding from the opposite sides of the sphere is evident. In the near wake, two large vortex loops that are connected to the FS are shed per oscillation cycle. These vortex loops shed asymmetrically, with the attached vortex bubble that consists of many small vortex tubes and rings, from the outer side. These vortex bubbles evolve in size and strength during a vibration cycle, and are strongest at
 $\frac {1}{2}T$ and
 $T$, marked by
 $A$ and
 $B$ in figure 19, respectively. Figures 20(a) and 20(b) display close-up views of the near wake, when the sphere is in its valley (minimum
 $y$) and peak (maximum
 $y$) positions, respectively. When the sphere moves towards its valley position, the flow behind the lower part of the sphere swirls in the counterclockwise direction, creating a vortex bubble located below the stagnation point. Similarly, as the sphere moves towards its peak position, the flow behind the upper part of the sphere swirls in the clockwise direction, creating a vortex bubble located above the stagnation point. Although these vortex bubbles are initially small and hard to visualise, they grow in size and become strongest at the peak and valley positions of the sphere, as indicated in figure 21. In addition to the induced force from the hairpin vortex loops, these vortex bubbles also induce a periodic force on the sphere, enhancing the VIV response. In particular, the vortex bubble that swirls in the clockwise (counterclockwise) direction generates an induced velocity on the sphere in the
 $y$ (
 $-y$) direction during the sphere movement towards the maximum (minimum)
 $y$. Of course, at equilibrium, when the amplitude reaches an approximately constant value, the net power transfer from the fluid to the sphere is zero; so the interpretation here is that the additional near-wake vortex-bubble structures observed in the piercing case allows the amplitude to build up to higher values prior to saturation.
Schematic of the action of vortex bubbles over a vibration cycle. Red arrows indicate the strength of the induced velocity on the sphere. The induced velocity is aligned with the direction of the sphere motion, providing an additional energy enhancing sphere vibration.

Such a vortex bubble is associated with a low-pressure core region that develops behind the sphere. Figures 20(c) and 20(d) display  $6$ iso-surfaces of pressure in the range
 $-0.6\leq p \leq -0.1$ when the sphere is in its valley and peak positions, respectively. As can be seen, the low-pressure cores closely resemble the wake visualised through surfaces of
 $Q$. As the sphere vibrates and reaches its extreme positions, highly swirling fluid forms these vortex bubbles. As a result, the wake convects downstream with some spiralling structures. For a clearer visualisation of the swirling motions in the newly attached vortex bubbles, please refer to supplementary movie 3.
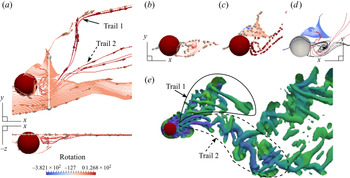
Figure 22(a) shows two views of the streamlines that pass through the line in the  $x$–
 $y$ plane that is
 $1D$ downstream from the centre of the sphere and lies in the FS when the sphere is in its valley position. Two counter-rotating spirals of streamlines can be seen downstream of the sphere at the FS. As shown from figure 22(b–d), two nearby streamlines coming from the upstream create these counter-rotating spirals. In one case, the fluid coming from underneath the sphere enters into the core of the lower spiral, then spins in the counterclockwise direction, and is later convected downstream by mixing with the fluid coming below the sphere. In the second case, fluid coming underneath the sphere rises and convects downstream to a point in the FS, and then returns creating the upper spiral that spins in the clockwise direction. The flow exiting from the core of the upper spiral splits and convects in two directions, creating two trails, as indicated in figure 22(a). Simultaneously, two vortical trails can be seen in the wake, as shown in figure 22(e).
Formation of two vortical trails behind the sphere as it turns: (a) streamlines that passes through a line in the FS that is  $1D$ downstream from the sphere centre, coloured by the rotation; (b,c) close-up views of the lower and upper vortex spirals shown in (a), respectively; (d) two streamline spirals viewed below the FS; and (e) the wake visualised by an iso-surface of the
 $Q$ criterion at
 $Q = 0.001$. The submergence depth is
 $h^* = -0.125$, reduced velocity is
 $U^* = 9$ and the sphere is in its valley position.

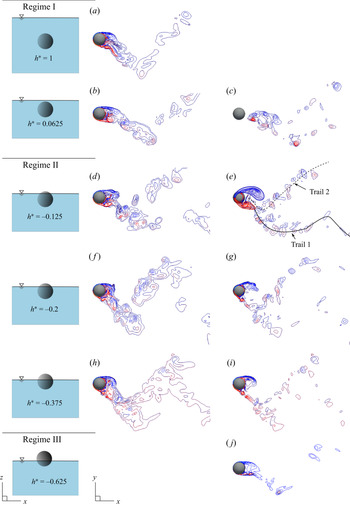
To extend and clarify this analysis, the vorticity field in a plane was also examined. Figure 23 compares the vorticity contours in the  $x$–
 $y$ plane that passes through the centre of the sphere (centre plane) and that in the FS, for various submergence depths. The sphere is approximately in its peak position. At
 $h^* = 1$, vorticity is close to zero at the FS, as expected, and not shown in the figure. Vorticity contours through the centre plane are modified as
 $h^*$ is decreased from
 $1$, which have a significant effect for the piercing sphere cases. Simultaneously, vorticity contours at the FS are also reshaped with decreasing
 $h^*$. In regimes II and III, two counter-rotating vortex pairs that attach to the sphere are evident at the FS, in agreement with the counter-rotating streamline spirals discussed earlier – see figure 23(e–j). The upper blue contours are larger in size and further away from the sphere compared with the lower red contours. These structures are also evident in the centre plane but are smaller in size, indicative of the 3-D vortex bubble that is found in the wake discussed previously.
A comparison of vorticity contours in the  $x$–
 $y$ plane that pass through the centre of the sphere (a,b,d, f,h) and the FS (c,e,g,i,j) at
 $U^* = 9$, for
 $h^* = 1$, 0.0625,
 $-$0.125,
 $-$0.2,
 $-$0.375 and
 $-$0.625. The sphere in its peak position.

The characteristics of the counter-rotating vortex pair in the near wake and the two vortex trails in the far wake were analysed to help answer the question: why does the sphere response amplitude increase in regime II with decreasing  $h^*$? At the FS, the location, orientation and size of the vortex pair varied significantly with decreasing submergence depth. At
 $h^* = -0.375$, both the upper and lower vortices were located closer to the sphere surface compared with those for
 $h^* = -0.125$. Moreover, the clockwise rotating upper vortex structure wraps back to attach to the sphere surface, see figure 23(i). Consequently, the 3-D vortex bubbles, representing recirculating flow regions attached to the sphere, when the sphere is in its valley and peak positions, are more prominent at
 $h^* = -0.375$ compared with
 $h^* = -0.125$ – see the vortex cores indicated by A and B in the last two columns of figure 19. Indeed, these vortex bubbles appear to have a significant influence in amplifying the VIV response of the sphere.
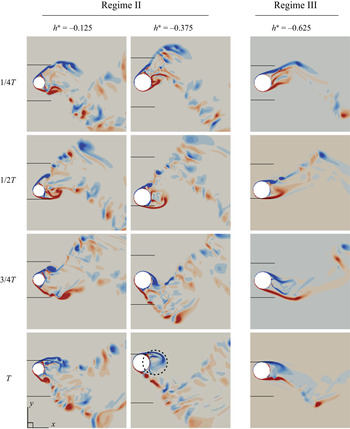
Figure 24 displays the evolution of the vorticity field at the FS for a cycle of sphere vibration for  $h^* = -0.125$,
 $-0.375$ and
 $-0.625$. The shed vorticity for the
 $h^* = -0.125$ case rolled up into discrete vortical structures that do not reattach to the sphere surface at each phase of the sphere vibration. The equivalent vortical structures were comparatively less spread in the near wake at
 $h^*= -0.375$, especially at
 $0.25T$ and
 $0.75T$ phases where there are clear signs of reattaching to the sphere surface. As a result, the low pressure associated with these attached structures causes the sphere to vibrate with a large amplitude at
 $h^* = -0.375$ compared with
 $h^* = -0.125$. As can be seen from fourth column of figure 19 and supplementary movie 4, at
 $h^* = -0.375$, the wake also appears more regular. These strong vortex bubbles located close to the sphere surface appear to empower the sphere vibration, as they add a fluctuating component of lift in phase with the displacement. Hence, the sphere achieves a vibration amplitude that is even larger than that of a sphere located far from a boundary.
Evolution of the vorticity field at the FS for one cycle of sphere oscillation at submergence depths  $h^* = -0.125$,
 $-0.325$ and
 $-0.625$. The two solid lines in each image show peak-to-peak vibration amplitude and indicate the position of the sphere in a vibration cycle.

As shown by figure 23, similar to the  $h^* = -0.125$ case, a secondary vortex trail is visible in the wake for all other submergence depths in regime II as well. Generation of this secondary vortex trail in the wake, as a result of the sphere piercing the FS, can be identified as a disturbance to the VIV response of the sphere. The starting point of this trail progressively shifts downstream and it is connected to the first vortex trail, as
 $h^*$ is decreased. Therefore, its effect on the sphere response is more significant at
 $h^* = -0.125$ and is smaller, as the submergence depth decreased in regime II. This may be a reason for less periodicity of the sphere vibration at
 $h^* = -0.125$.
3.3.3. Regime III
When only a small portion of the sphere is above the FS ( $h^* \approx -0.125$), the wake is dispersed with numerous small-scale structures. However, as the submergence depth is decreased, the scattered nature of the wake diminishes, and at
 $h^* = -0.45$, the wake becomes more regular with a zig-zag shape and fewer smaller-scale structures – see figure 18(d–h). Beyond this, at
 $h^* = -0.625$, the wake consists of two trails of vortex loops that are connected to the FS. Although only
 $37.5\,\%$ of the sphere height is submerged in the fluid at
 $h^* = -0.625$, two vortex loops are shed per oscillation cycle, contributing to the formation of two vortex trails, see supplementary movie 5. The wake is more organised at this submergence depth, as it consists mainly of large-scale structures, and is somewhat similar to that for
 $h^* = 1$ but trimmed off by a plane parallel to the
 $x$–
 $y$ plane – compare figures 18(h) and 18(a). However, as the sphere vibration amplitude was small at
 $h^* = -0.625$, the distance between the upper and lower vortex trails is smaller.
In regime III, the secondary vortex trail seen in regime II completely disappears. As explained in § 3.1, unlike in the first two regimes, the sphere vibrated sinusoidally in regime III. This is consistent with the more organised wake found in this regime that consists mainly of larger-scale structures. Nevertheless, a vortex bubble still forms behind the sphere at  $h^* = -0.45$, as indicated by the symbol
 $*$ in figure 18(g). At
 $h^* = -0.45$, the size of the vortex bubble is comparatively small, since a smaller portion of the sphere resided in the fluid. Furthermore, at
 $h^* = -0.625$, the existence of such a bubble is obscure. To provide a clearer view, figure 25 displays the near wake viewed from above and below the FS, and the vorticity field at the FS for these two submergence depths, at the time when the sphere is in its peak position.
Near wake in regime III: (a,b) wake visualised by  $Q$ criterion at
 $Q = 0.001$ at
 $h^* = -0.45$ and
 $-$0.625, respectively; (c,d) vorticity field at the FS at
 $h^* = -0.45$ and
 $-$0.625, respectively. The second row shows the wake viewing below the FS. Sphere is at its peak position.

Although the vortex bubble becomes stronger with decreasing submergence depth until  $h^* = -0.375$, it subsequently becomes increasingly weaker. Simultaneously, the sphere vibration amplitude increases with decreasing
 $h^*$ until
 $-$0.375, and then it gradually decreases as
 $h^*$ is decreased further. As discussed earlier, the vorticity field at the FS can be used to investigate the nature of this vortex bubble. At
 $h^* = -0.375$, the positive and negative vortices forming behind the sphere at the FS plane at the
 $0.5T$ and
 $T$ phases, respectively, are relatively circular in shape and located immediately behind the sphere – see figure 23. This combination results in the maximum sphere vibration. As
 $h^*$ is decreased to
 $-0.45$, these vortices become even more elongated in the streamwise direction, although strong circulation is still evident, see figure 25(c). At
 $h^* = -0.625$, the shape of the near-wake vortex structure dramatically changes. Both positive and negative vortex structures are elongated in the streamwise direction, are oriented close to each other and form away from the rear of the sphere – see figure 25(d). These features are consistent the low-level vibration observed at smaller submergence depths.
Unlike the almost sudden wake transition between regimes I and II, the wake transition between regimes II and III is more continuous. This is to be expected as the sphere is semi-submerged in both regimes II and III. As discussed in § 3.1.2, the sphere response amplitude decreases with decreasing  $h^*$ in regime III. This reduction of the sphere response amplitude can be directly attributed to the reduction of the energy that the sphere can receive from the fluid, as the submerged surface area of the sphere reduces with decreasing
 $h^*$. Because of the convex shape of the sphere, two hairpin-type vortex loops shed from the opposite sides of the sphere in a vibration cycle persist even at a very small submergence depth. These are associated with the fluid–structure interaction, and hence sphere vibrations persist, although they are much smaller, even with only
 $25\,\%$ of the sphere height immersed in the fluid.
3.3.4. Energy transfer
The rate of energy transfer (or ‘power input’) from the fluid to the sphere was examined, to further investigate why the strength of the VIV response varies in each regime. The normalised rate of energy transfer can be obtained by
 \begin{equation} \dot{e}_v = C_{vortex}*\dot{y},\end{equation}
as described by Govardhan & Williamson (Reference Govardhan and Williamson2005), where  $C_{vortex} = 2F_{vortex}/(\rho {\rm \pi}U^2D^2)$ is the vortex force coefficient, and
 $\dot {y}$ is the transverse velocity of the sphere normalised by the diameter. Figure 26 displays the time history of
 $\dot {e}_v$ and response amplitude for two
 $h^*$ and
 $U^*$ combinations. As can be seen, the energy transfer is mostly positive during the transient response for both cases, whereas it fluctuates about zero in the asymptotic states. This positive energy transfer during the period of amplitude growth essentially fuels the VIV response, resulting in the amplitude increasing until the average energy transfer over a cycle reduces to zero, as the response saturates and the flow about the sphere changes concurrently. For the following discussion, it is useful to define the net energy transfer rate (per cycle) as
 \begin{equation} \dot{e}_{v,T}= \int_{0}^{T} C_{vortex}\dot{y}\,\textrm{d}t.\end{equation}
Time history of the sphere response amplitude,  $A^*$, and energy transfer to the sphere,
 $\dot {e}_v$: (a) at
 $h^* = 1$ and
 $U^* = 8$ and (b) at
 $h^* = 0.5$ and
 $U^* = 6$. The energy transfer over a vibration cycle is positive during the transient response.

With the assumption of sinusoidal sphere vibration and sinusoidal vortex force with a phase difference of  $\phi _v$, one can show that
 $\dot {e}_{v,T} = C\sin (\phi _v)$, where
 $C$ is a constant. The vortex phase of this study is either approximately
 $0^{\circ }$ or
 $180^{\circ }$ (see figure 16). Thus
 $\dot {e}_{v,T}$ is ideally
 $=0$ at the asymptotic state. Nevertheless, even though the asymptotic response is nearly sinusoidal, the vortex force is not close to a pure sinusoidal signal in many cases. Thus, for cycles after the sphere vibration saturates,
 $\dot {e}_{v,T}$ can be expected to vary around zero.
Figure 27 displays the variation of net energy transfer per cycle and the response amplitude at the corresponding cycle at eight submergence depths ( $U^* = 8$). In each case,
 $\dot {e}_{v,T}$ is positive and increased with the simulation time over the transient stage, providing the energy to achieve a large saturation amplitude. Once the sphere vibration reached saturation,
 $\dot {e}_{v,T}$ fluctuated around zero. The fluctuation of
 $\dot {e}_{v,T}$ was significantly larger in regime II, where the sphere response was far from sinusoidal – see figure 27(e, f).
Plots of the net energy transfer per cycle,  $\dot {e}_{v,T}$, and the response amplitude,
 $A^*$ at the corresponding cycle at
 $U^* = 8$ and
 $h^* = 1$, 0.5, 0.125, 0.03125,
 $-$0.125,
 $-$0.375,
 $-$0.5 and
 $-$0.625. The value of
 $\dot {e}_{v,T}$ strictly positive in the transient response, as
 $h^*$ decreased the variation of the maximum value of
 $\dot {e}_{v,T}$ collapsed well with the variation of
 $A^*_{max}$.

The variation of  $\dot {e}_{v,T}$ with submergence depth over the transient growth phase could be a useful predictor of the asymptotic response. Thus, we examined
 $\dot {e}_{v,T}$ values that correspond to the transient response of the signal for this analysis. For
 $h^*=1$, during the transient response,
 $\dot {e}_{v,T}$ reached a maximum value of
 $4$. This maximum value of
 $\dot {e}_{v,T}$ steadily decreased, as
 $h^*$ was decreased in regime I, consistent with the VIV response amplitude monotonically decreasing – see the first column of figure 27. However, as
 $h^*$ was decreased through regime II, the maximum value of
 $\dot {e}_{v,T}$ increased to a value of approximately
 $6$ at
 $h^*=-0.375$, see figure 27(e, f). This increase of
 $\dot {e}_{v,T}$, perhaps together with the increased number of cycles over which the amplitude is allowed to grow, essentially provides more energy to the sphere so that it can vibrate with an even larger vibration amplitude than for the fully submerged case. As
 $h^*$ was decreased further in regime III, the maximum value of
 $\dot {e}_{v,T}$ reduced indicating a smaller power input. Indeed, the saturated VIV amplitude across each regime is strictly dependent on the maximum energy transfer per cycle the sphere receives during the transient growth phase.
Given this analysis, it seems reasonable to argue that it is the added feature of counter-rotating vortex bubbles in the wake of a piercing sphere that essentially leads to the additional energy transfer per cycle to maintain the higher-amplitude response compared with that for fully submerged sphere. Also supporting this conclusion is that these vortex bubbles can be observed from the beginning of the transient response – see figure 28 and supplementary movie 6.
Wake visualised using the  $Q$ criterion at
 $Q=0.005$ at
 $h^* = -0.375$ and
 $U^*=8$: (a) and (b) at the time instances shown in the bullseyes of figure 27( f), which correspond to the transient and saturated responses, respectively. For a piercing sphere, the formation of swirling vortex bubbles behind the sphere is evident at the transient response as well.

4. Conclusions
The effects of the proximity to a FS on transverse VIV of a sphere were investigated numerically at a Reynolds number of  $2000$. Past studies have indicated that this is sufficiently large to be relevant to many previous experimental studies discussed in the introduction. The FS boundary was modelled with a slip wall, as the effect of low Froude number in previous experiments (Sareen et al. Reference Sareen, Zhao, Sheridan, Hourigan and Thompson2018) was found to be negligible on the VIV response. To determine the influence of the FS on sphere vibration, a comprehensive set of simulations was conducted over the reduced velocity range
 $U^* \in [3.5,14]$ and the submergence depth range
 $h^* \in [-0.75,1]$. The submergence depth range was itself partitioned into three regimes delineated by
 $h^* = 0$ and
 $-$0.375, based on the characteristics of the sphere response and the wake. The major findings of this study over the previous experimental study of Sareen et al. (Reference Sareen, Zhao, Sheridan, Hourigan and Thompson2018) can be summarised as follows.
The effect of the viscous layer (associated with the zero stress condition) is significant on the VIV response of a fully submerged sphere. The submergence depth  $h^*=1$ was identified as the critical depth such that the sphere response is not altered by the FS. The formation of two streets of hairpin vortex loops was observed in the wake, as found in previous experimental and computational studies of a sphere placed far away from a wall boundary. Since the thickness of the wake in the vertical direction was restricted to
 $3$ diameters, vortex loops remained strictly below the FS and the influence of the FS on the sphere response was minimal. As the submergence depth was decreased in regime I (
 $0 < h^* \leq 1$), i.e. moving the sphere towards the surface, the wake was modified under the influence of the surface, and as a result, the sphere response amplitude decreased globally and monotonically, with a greater effect at higher reduced velocities. However, the relative reduction of maximum response amplitude was less than
 $5\,\%$ until
 $h^* = 0.375$, and it reached approximately
 $25\,\%$ for
 $h^* \approx 0$. The reduction of response amplitude was associated with the simultaneous reduction of the fluctuating component of the lift coefficient and the reduced energy transfer per cycle during the transient growth phase. Nonetheless, the mean drag coefficient monotonically increased with decreasing
 $h^*$. As seen for a vortex ring approaching a FS, the vortex loops are twisted and stretched under the influence of the thick blockage layer, and large downstream vortex loops connect to the FS through diffusion. The influence of the zero stress condition at the surface on the near wake was only pronounced for the range
 $0< h^* < 0.375$, and hence, the sphere response was affected strongly for submergence depths close to zero. From these observations, we can conclude that the effect of the viscous layer (associated with zero stress) on VIV of a fully submerged sphere is more significant than that of the thicker blockage layer (preventing flow through the surface).
Two counter-rotating vortex bubbles formed on opposite sides of a piercing sphere being strongest close to the positive and negative peak displacements, as it vibrated during a cycle. As the submergence depth was decreased beyond zero with the sphere piercing the FS, both the near- and far-wake structures were modified significantly. Nevertheless, as found for a fully submerged sphere, two vortex loops connected to the FS were shed in each vibration cycle for a piercing sphere, leading to the extra transfer of fluid energy to the sphere for large-amplitude VIV to persist. However, in this regime attached vortex bubbles formed in the near wake, consisting of finer-scale vortical flow features. Previously unseen, these counter-rotating vortex bubbles were only clearly visible in the instantaneous flow field when the sphere was close to times of maximal displacement. However, these vortex bubbles were clearer in the dynamic field. They provided an additional induced force enhancing the VIV response. The characteristics of the wake and these vortex bubbles were highly dependent on the submergence depth.
Vortex bubbles strengthen the VIV response in regime II. In regime II ( $-0.375 \leq h^* < 0$), with less than half of the sphere piercing the FS, the swirling of the fluid forming a vortex bubble resulted in the generation of a secondary vortex trail. These secondary vortex trails act as a disturbance to VIV, leading to a less periodic VIV response. As
 $h^*$ was decreased in regime II, the vortex bubbles strengthened and the effect of the secondary vortex trail lessened; consequently the sphere response amplitude increased to be above even that of a fully submerged sphere. The predicted trend was similar to that reported from experimental studies by Sareen et al. (Reference Sareen, Zhao, Sheridan, Hourigan and Thompson2018); however, they did not examine the near-wake structure to provide a physical explanation. By carefully analysing the near-wake structure and evolution, we can conclude that the development of two vortex bubbles per vibration cycle enhances VIV, leading to larger-amplitude vibration than for the fully submerged case, as they enhanced the energy transfer rate during the transient response.
Strength of the vortex bubbles reduces in regime III. As the submergence depth was decreased below  $-0.375$, i.e. in regime III, the size of the vortex bubbles reduces, due to the reduction of the portion of the sphere immersed in the fluid. Together with the overall weakening of the wake, the reduced vortex bubbles result in less energy transfer with decreasing
 $h^*$, resulting in a reduction in the saturated sphere response amplitude. As well as the fluctuating components of the drag and lift coefficients, the time-mean drag coefficient and energy transfer rate during the transient response decreased in regime III with decreasing
 $h^*$.
Supplementary movies
Supplementary movies are available at https://doi.org/10.1017/jfm.2021.873.
Acknowledgements
The support from Australian Research Council Discovery Grants DP150102879, DP170100275 and DP190103388, and computing time from the National Computational Infrastructure (NCI), and the Pawsey Supercomputing Centre with funding from the Australian Government and the Government of Western Australia, are gratefully acknowledged.
Declaration of interests
The authors report no conflict of interest.