I. Introduction
There is growing interest in whether corporate environmental, social, and governance (ESG) performance matters for financial markets and corporate behavior. Practitioners contend that ESG-related uncertainty is now a central focus because investors are concerned that poor ESG performance can cause substantial physical risks, transition risks, supply chain risks, and/or downside risks (Morningstar (2020), PwC (2020)). There is also academic evidence that ESG performance affects firms’ risks, including systematic, downside, and crash risks.Footnote 1 However, less is understood about the pricing of these risks.
In this article, we study the pricing of uncertainty associated with ESG, by which we mean operational, reputational, and/or litigation uncertainty due to poor ESG performance. Our interest is not so much in studying the impact of ESG on various risk measures per se but rather in analyzing whether investors recognize these risks and pay a premium, which we call the “ESG premium,” to potentially hedge against them. Note that while risks due to poor ESG performance are normally associated with bad outcomes, the directional impact of ESG-related uncertainty could be positive. Therefore, we view ESG-related uncertainty as having both an upside and a downside, and we conjecture that investors may be willing to pay to hedge against this uncertainty. Options markets are a natural place for us to uncover these insurance premia, if any.Footnote 2 Option returns (suitably delta-hedged) allow us to isolate the pricing impact of ESG-related uncertainty due to hedging from the ESG risk premia on the underlying stocks. Ilhan, Sautner, and Vilkov (Reference Ilhan, Sautner and Vilkov2021) also use risk-neutral quantities extracted from options to study the pricing of carbon risks.
We are also inspired by Kelly, Pástor, and Veronesi (Reference Kelly, Pástor and Veronesi2016) and Pástor and Veronesi (Reference Pástor and Veronesi2013), who show that options whose lives span political events tend to be more expensive, indicating that political uncertainty is priced. Similar to their arguments about political risks, it is unclear when ESG risks will materialize or how severe they will be. For example, despite increasing awareness of ESG issues, there remains uncertainty about when and how ESG-related regulatory policies will be implemented, about investors’ divestment policies, and about firms’ fluctuations in revenues. Therefore, options serve as a good vehicle to understand how such uncertainties are perceived and ultimately priced. In the context of climate change, Giglio, Maggiori, Rao, Stroebel, and Weber (Reference Giglio, Maggiori, Rao, Stroebel and Weber2021) highlight the importance of alternative asset classes to estimate their impact. For example, these authors use the real estate market to understand the term structure of discount rates for investments in climate change abatement. Somewhat similarly, we study another alternative asset market, the equity options market, to study the risks associated with ESG.
Our conjecture is that investors are willing to pay a premium to hedge against ESG-related uncertainty. We start our empirical investigation by analyzing how firms’ ESG scores are related to their option expensiveness, measured using delta-hedged option and straddle returns. These returns insulate the effect of the underlying return (for which evidence of ESG pricing is ambiguous) and allow us to focus on the object of interest, the premium due to ESG-related uncertainty. Dew-Becker, Giglio, and Kelly (Reference Dew-Becker, Giglio and Kelly2021) and Dew-Becker, Giglio, Le, and Rodriguez (Reference Dew-Becker, Giglio, Le and Rodriguez2017) also use option returns (specifically straddle and strangle returns) to study the pricing of macroeconomic risk and volatility risk, respectively.
We pick one call and one put option on each optionable stock that has a time to maturity of about one and a half months and are closest to being at the money (ATM)—these options are the most frequently traded and hence are the most liquid. For each optionable stock and in each month, we evaluate the return until the maturity of a portfolio that buys one call (or put), delta-hedged with the underlying stock. To investigate the impact of ESG performance on option returns and gauge the economic magnitude of the ESG premium, we sort all options into quintiles based on the ESG scores of the underlying stocks. We calculate two types of option returns. The first is daily rebalanced delta-hedged returns, following Bakshi and Kapadia (Reference Bakshi and Kapadia2003) and Cao and Han (Reference Cao and Han2013), so that the portfolio is not sensitive to stock price movements. Second, we calculate the returns of the daily rebalanced zero-beta straddle portfolio until maturity following Coval and Shumway (Reference Coval and Shumway2001). We calculate the returns and factor model alphas using the stock market factors of Fama and French (Reference Fama and French2018) and the option market factor of Coval and Shumway (Reference Coval and Shumway2001). We find that both returns and alphas increase almost monotonically from quintile 1 (lowest ESG score) to quintile 5 (highest ESG score), and this finding is robust across both types of option returns. The difference in the average delta-hedged option returns on low- and high-ESG stocks can be regarded as the ESG premium that investors are willing to pay in the options market to hedge against their perceived uncertainty for low-ESG stocks. The magnitude of the risk premium using the daily rebalanced delta-hedged return is around 0.2% held until maturity. Beta-neutral straddle returns yield an estimate of the ESG premium of about 2.72%.Footnote 3
Do all three components of ESG contribute to the relation between ESG scores and option returns? To investigate this question, we separate environmental (E), social (S), and corporate governance (G) scores and study their individual impacts on delta-hedged option returns. Using portfolio sorts as before, we find that all three aspects of ESG contribute to the positive relationship between delta-hedged option returns and ESG performance, although the E-score and the S-score are stronger determinants of option returns than the G-score. The fact that our results are weaker using the G-score also suggests that corporate governance risks are more idiosyncratic in nature than those related to environmental and social issues. There are various potential sources of systematic ESG risks. For example, pro-environmental regulations may subsidize high-ESG products or handicap low-ESG products, leading to a larger difference in customer demand between high-ESG firms and low-ESG firms. The risks could also come from social movements such as #MeToo, which may change public awareness and investors’ perceptions.
Delta-hedged option returns and straddle returns embed various types of risk premia, such as the volatility risk premium, jump risk premium, and tail risk premium. Many studies document the existence of a nonzero volatility premium (see, e.g., Buraschi and Jackwerth (Reference Buraschi and Jackwerth2001), Coval and Shumway (Reference Coval and Shumway2001), and Bakshi and Kapadia (Reference Bakshi and Kapadia2003)) and the risk of unforeseen tail events (see, e.g., Jackwerth and Rubinstein (Reference Jackwerth and Rubinstein1996), Bakshi and Kapadia (Reference Bakshi and Kapadia2003)). It is, therefore, of interest to examine which risk premia contribute to the positive relationship between ESG scores and option returns. To directly test whether volatility and tail risk premia are related to ESG scores, we construct straddle returns following Cremers, Halling, and Weinbaum (Reference Cremers, Halling and Weinbaum2015). Through portfolio sorts, we find a positive relationship between ESG and returns to gamma-positive, vega-neutral straddles (portfolios exposed to tail risk), while the relationship between ESG and returns to vega-positive, gamma-neutral straddles (portfolios exposed to volatility risk) is not significant. These results show that jump risks related to ESG performance are strongly priced in the options, while the impact of volatility risks is limited.
If our hypothesis that investors pay a premium to hedge against uncertainty is correct, then the effect of ESG on option pricing should increase when public ESG awareness/attention increases and when the perceived uncertainty for low-ESG stocks is expected to be more important. To support our argument, we conduct three tests to examine how the ESG premium changes with public ESG awareness/attention over time. First, we divide our sample into two subperiods based on the monthly change in the Google search volume of “ESG,” and we find that the alpha for the H
$ - $
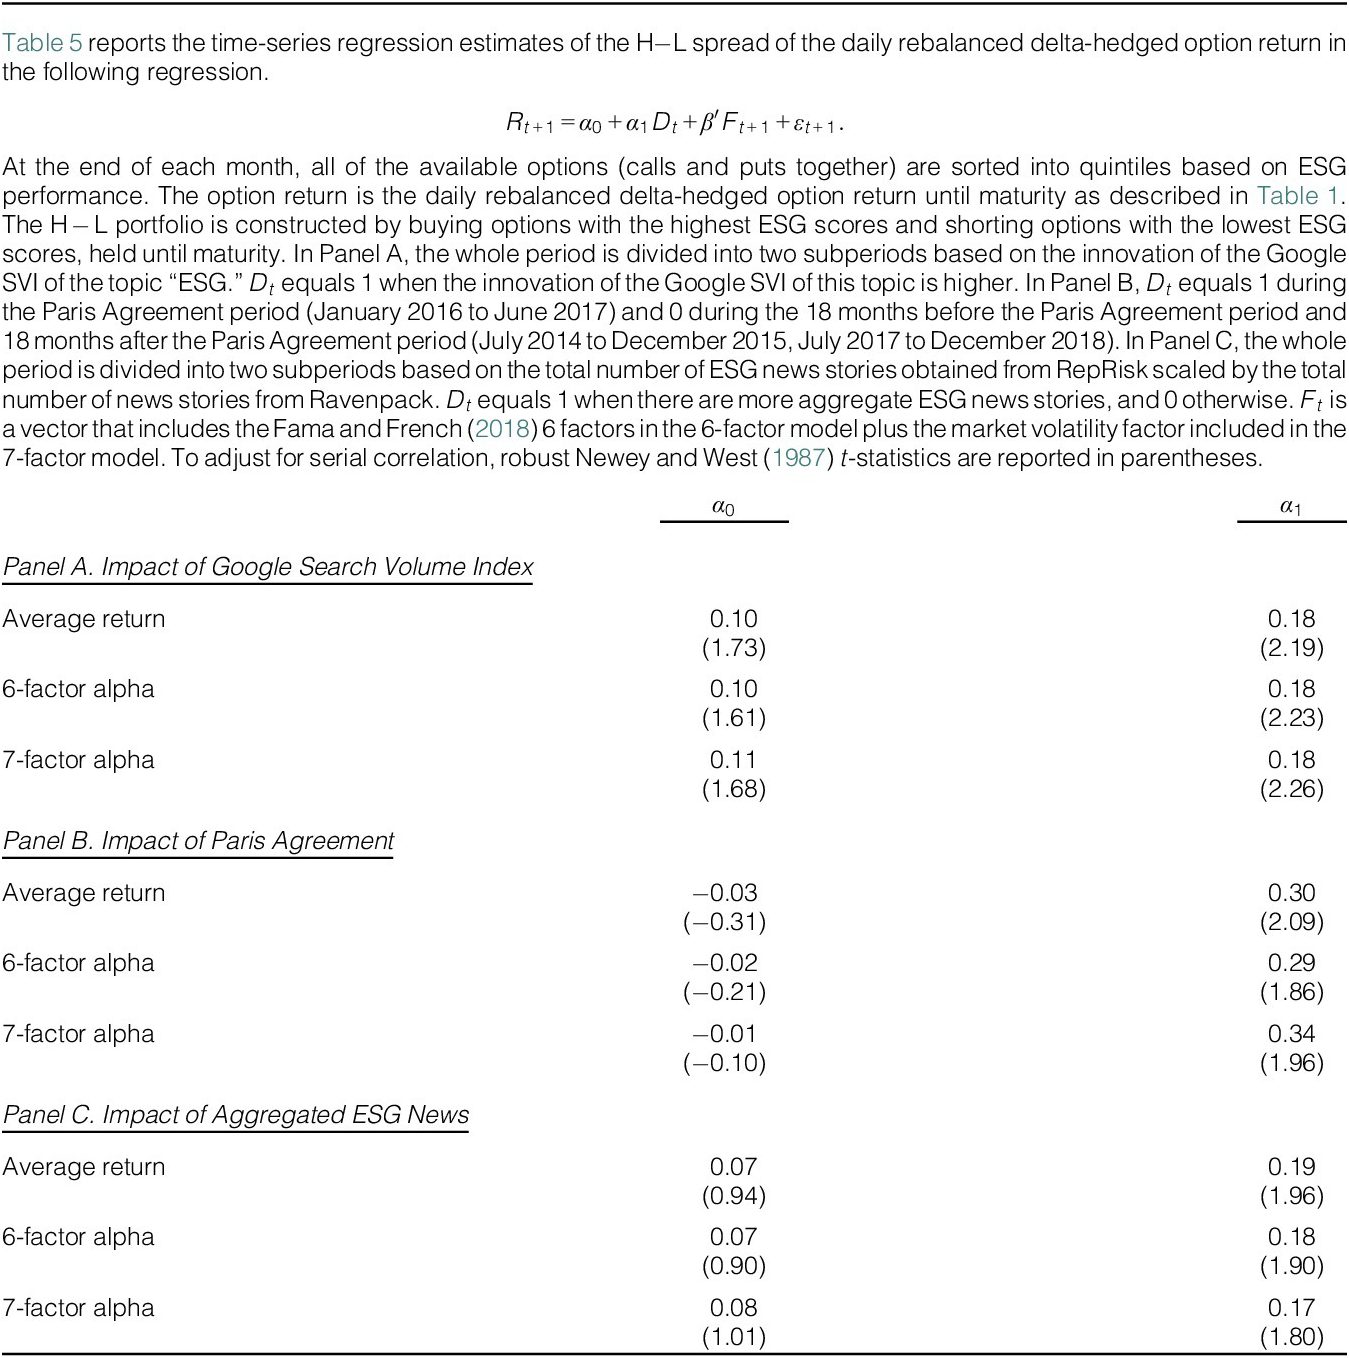
 L spread portfolio is significantly higher during the period with heightened Google search volume. Second, we find that the effect of the ESG score on the delta-hedged option return is significantly stronger during the Paris Agreement period (January 2016 to June 2017), when the Paris Agreement was in effect and likely to impose stringent regulations on firms with poor ESG performance. Third, using aggregate ESG news in the market as a proxy for ESG awareness, we find that the ESG premium is much higher when there is more ESG news.
A natural question is whether the ESG premium comes from the quantity of risk or the price of risk. We find that low-ESG stocks are riskier, with risk measured as the risk of increasing volatility (Cao, Vasquez, Xiao, and Zhan (Reference Cao, Vasquez, Xiao and Zhan2023) or jump intensity (Bollerslev, Li, and Zhao (Reference Bollerslev, Li and Zhao2020)). This is consistent with the quantity of risk driving the higher risk premium on options on low-ESG stocks. At the same time, we also find that the quantity of risk does not change during times when ESG awareness is high. Coupled with evidence that the risk premium does increase during these times, we conclude that the market price of risk increases when investors pay more attention to ESG-related uncertainty. Therefore, both the quantity and the price of risk drive the ESG premium.
Next, we use Fama and MacBeth (Reference Fama and MacBeth1973) regressions (FM regressions henceforth) to test the impact of ESG performance on the option level. Controlling for various firm characteristics, option characteristics, and risk measures, we find that lower ESG scores are associated with lower delta-hedged option returns. For example, we find that the delta-hedged option returns for calls increase by 0.32% each month if we move from the lowest to the highest quartile of ESG scores (similar to the return spread from portfolio sorts). To disentangle the effect of carbon tail risk (Ilhan et al. (Reference Ilhan, Sautner and Vilkov2021)) from broader ESG risks, we run FM regressions of delta-hedged option returns on both the ESG score and carbon emission intensity. We find that the ESG score plays an important role even when we control for carbon emission intensity, which indicates that our results are not merely driven by the carbon emission intensity of the firm but also depend on other aspects of the ESG score.
ESG scores are likely to be correlated with other characteristics of the firm, which may also be important for option returns. To mitigate these endogeneity concerns, we use the RepRisk Index (RRI) to identify sudden increases in ESG risk and investigate how the options market reacts to these shocks. We use such exogenous variations in time as quasi-natural experiments and rely on multiple shocks to firm ESG risk to alleviate concerns about omitted variables. For each treated stock (for which RRI increases), we identify control stocks via propensity score matching. A difference-in-differences (DiD) analysis shows that after a sudden increase in ESG risk, the delta-hedged call option return of treated firms drops by 0.295% compared with that for the control group. The results are very similar for put options. A parallel trend analysis serves as a validity test of the DiD analysis and shows no visible trends before the shocks to ESG. We acknowledge that we do not have a cleaner exogenous shock to rule out all sources of endogeneity, and therefore, we take these results only as suggestive causal evidence.
Given the complexity of measuring ESG information, ESG ratings from different providers disagree substantially, and the validity of these ratings has been critically debated. We perform three robustness tests to mitigate the concern that our empirical results are only significant for a particular ESG data provider. First, we used the ESG scores of four alternative data providers, and we find that all are significant. Second, we create a combined ESG score using the information from five data providers and show that the results are robust. Third, using a noise-correction procedure (Berg, Koelbel, Pavlova, and Rigobon (Reference Berg, Koelbel, Pavlova and Rigobon2024)), we again find consistent patterns.
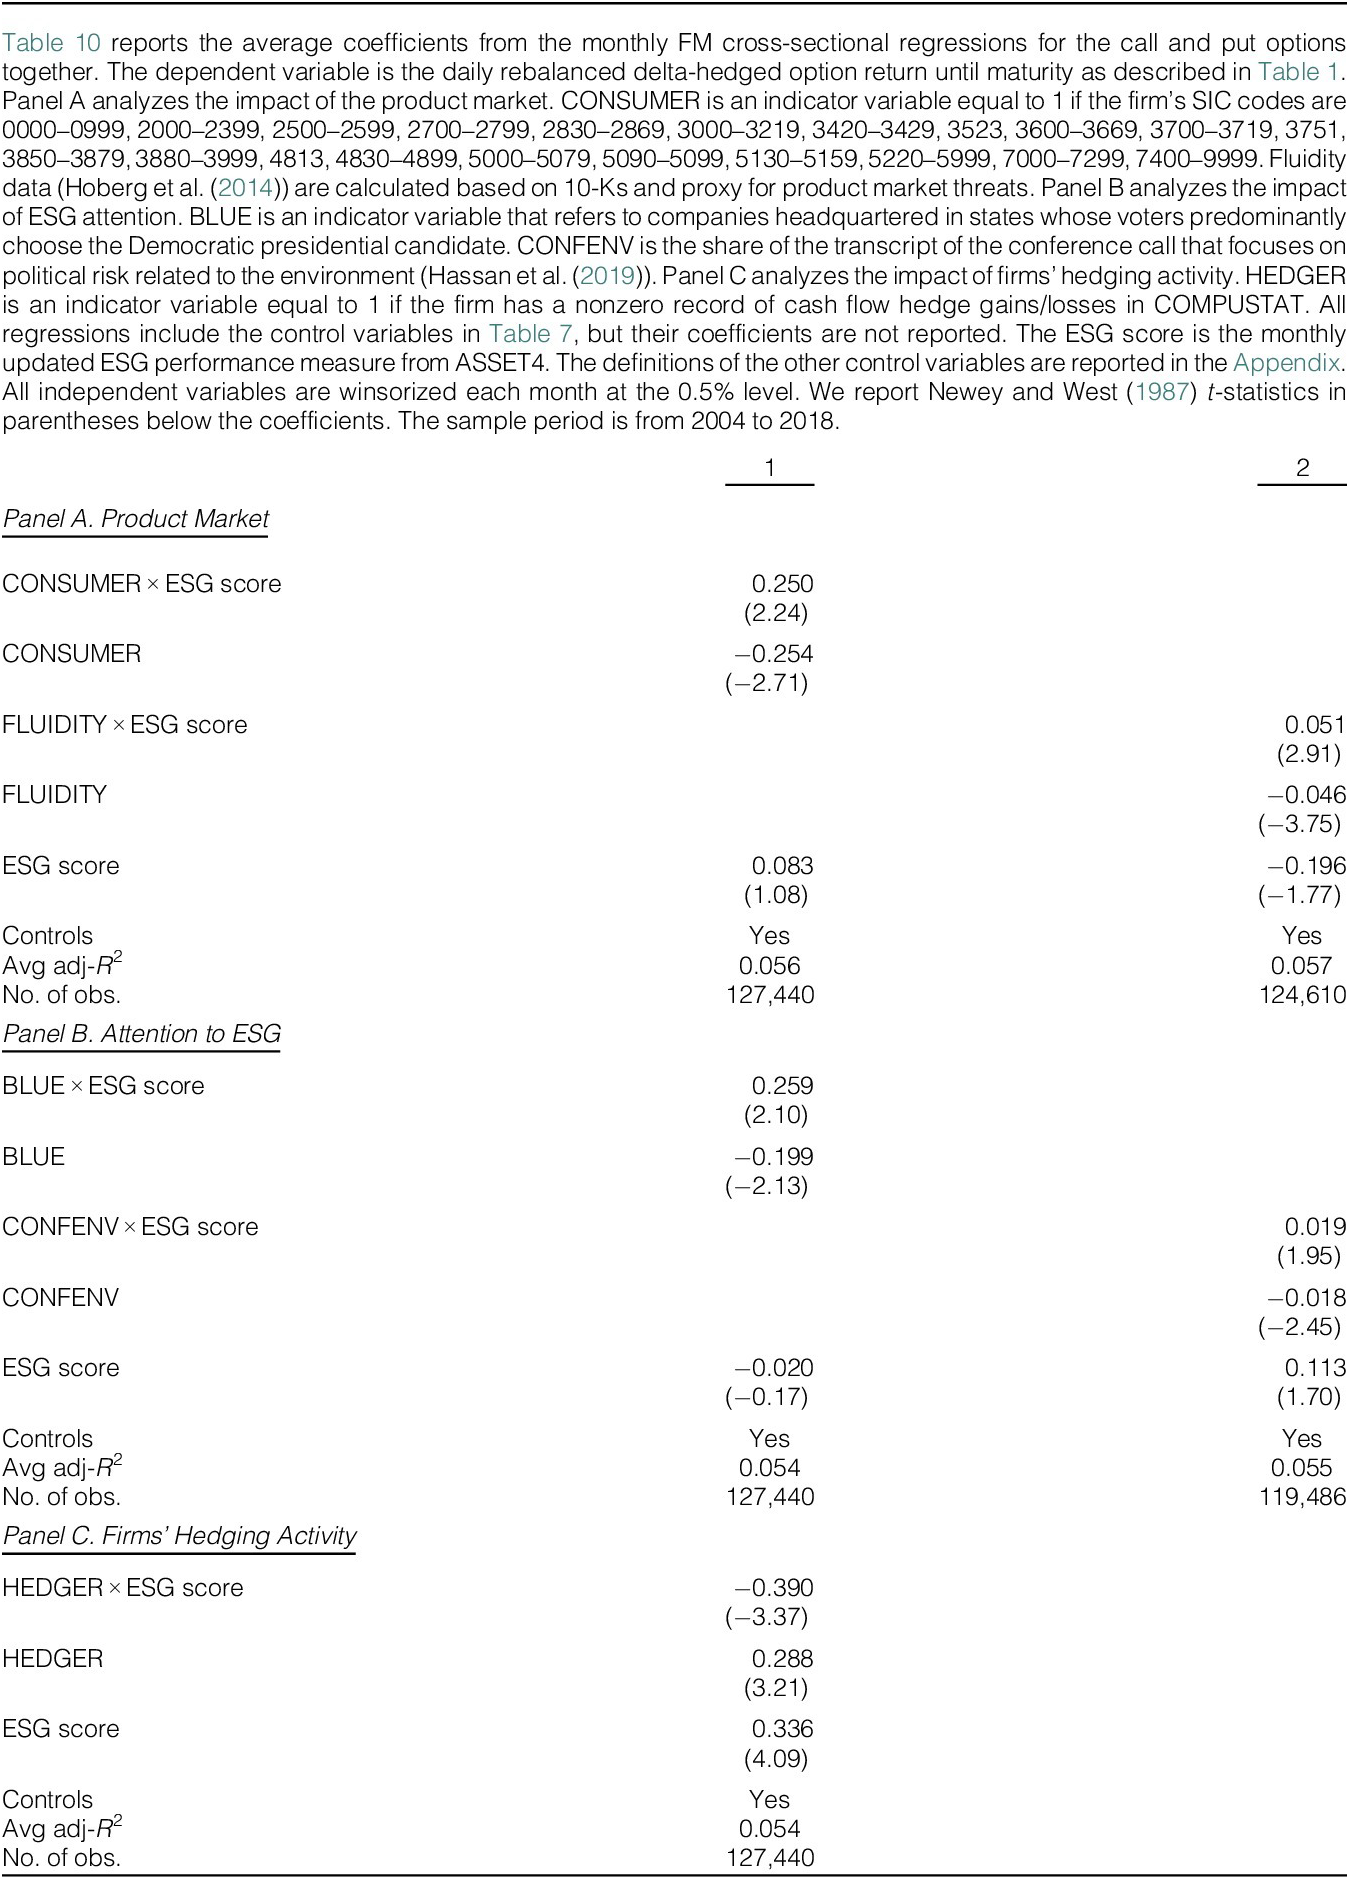
Next, we consider several channels through which the link between the ESG score and the option market is strengthened or weakened. The first channel is different business models and product market competition. The proximity of industries to end consumers has been documented to influence the impact of the ESG score on firm fundamentals because private end consumers show more social concerns in their consumption (see, e.g., Curcio and Wolf (Reference Curcio and Wolf1996), Baron, Harjoto, and Jo (Reference Baron, Harjoto and Jo2011)). We conjecture that the effect of ESG on option prices might be more important in industries that depend more heavily on the trust of end consumers. The second channel influencing the ESG premium is cross-sectional variations in investors’ attention to ESG. We proxy this by the political leaning (Democratic vs. Republican) of the state where the company is headquartered (see, e.g., Hong and Kostovetsky (Reference Hong and Kostovetsky2012), Di Giuli and Kostovetsky (Reference Di Giuli and Kostovetsky2014)) or the portion of the quarterly earnings conference call transcripts that are devoted to environmental-related political topics (Hassan, Hollander, van Lent, and Tahoun (Reference Hassan, Hollander, van Lent and Tahoun2019)). As a third channel, we conjecture that corporate hedging policy can also affect the relationship between ESG performance and option pricing. We find evidence consistent with all of these channels.
To the best of our knowledge, our article is the first to formally investigate the effect of ESG performance on risk premia in the options market.Footnote 4 Since the seminal study of Bakshi and Kapadia (Reference Bakshi and Kapadia2003), variance risk premia have been known to be negative—an increase in volatility is typically regarded as corresponding to bad states. The literature on the cross-sectional variation of these risk premia is sparse (see, e.g., Buraschi, Trojani, and Vedolin (Reference Buraschi, Trojani and Vedolin2014), González-Urteaga and Rubio (Reference González-Urteaga and Rubio2016)). We investigate how these risk premia are related to ESG. We conjecture and find evidence that investors are willing to pay to insure against ESG risks. Importantly, our study not only explores the relation between ESG and general variance risk premia but also drills down to risk premia related to jump risk.
We also contribute to the growing body of literature on option pricing. Goyal and Saretto (Reference Goyal and Saretto2009), Bali and Murray (Reference Bali and Murray2013), Cao and Han (Reference Cao and Han2013), Zhan, Han, Cao, and Tong (Reference Zhan, Han, Cao and Tong2022), Christoffersen, Goyenko, Jacobs, and Karoui (Reference Christoffersen, Goyenko, Jacobs and Karoui2018), and Ramachandran and Tayal (Reference Ramachandran and Tayal2021) explore the impacts of various stock and volatility-related characteristics on option returns. Our article is the first to examine the effects of underlying firms’ ESG performance on option pricing and to explore several potential underlying economic channels.
The study most closely related to ours is Ilhan et al. (Reference Ilhan, Sautner and Vilkov2021). These authors find that the cost of protection against downside tail risks is higher for firms with more carbon-intensive business models. Our article differs from theirs in two major aspects. First, we focus on the risks associated with general ESG performance, not just the carbon policy risks. As discussed previously, we show that our results are not due to the impact of carbon risks or only environmental risks but rather derive from all of the components (E, S, and G) of ESG (our results are robust to controlling for carbon emission measures). The evidence from other cross-sectional analyses also shows that the social component is nonnegligible, as it amplifies the impact of ESG on option pricing. Second, Ilhan et al. (Reference Ilhan, Sautner and Vilkov2021) mainly focus on downside risk (hence their focus on deep out-of-the-money (OTM) options). In contrast, we study the pricing of general uncertainty related to ESG performance (and therefore ATM options). Ilhan et al. (Reference Ilhan, Sautner and Vilkov2021) report that carbon risks also affect variance risk premia. We find results consistent with theirs. Importantly, we also show that the ESG premium embedded in option prices goes beyond that related to volatility risk only and includes premia related to jump risks. Because our interest is in the general ESG premium, we quantify it using returns (on delta-hedged options and straddles in our case) rather than prices per se. Dew-Becker et al. (Reference Dew-Becker, Giglio and Kelly2021) also advocate the use of option returns to study the pricing of macroeconomic risk.Footnote 5
The rest of the article proceeds as follows: Section II describes our data and measures. Section III quantifies the ESG premium and investigates the sources of this premium. We present the Fama-Macbeth results in Section IV. We discuss potential underlying economic channels that affect the cross-sectional relationship between ESG performance and option pricing in Section V and conclude in Section VI.
II. Data and Variables
A. Data and Sample Coverage
We collect data on firms’ ESG performance from ASSET4. These data provide objective, relevant, and systematic ESG information based on 250+ key performance indicators and 750+ individual data points from three pillars (E, S, and G). ASSET4 provides data on more than 3,000 firms globally, covering major indexes. In the United States, ASSET4 only covered firms in the S&P 500 index at the beginning of the sample period and expanded to firms in the Russell 1,000 index later.Footnote 6
We obtain data on individual U.S. stock options from OptionMetrics. The data set includes the daily closing bid and ask quotes, trading volume, and open interest of each option. Options’ delta and other Greeks are computed by OptionMetrics based on standard market conventions.
Stock returns, prices, and trading volumes are obtained from the Center for Research on Security Prices (CRSP). The accounting data are collected from COMPUSTAT. We obtain institutional holdings (13F) data from Thomson Reuters and analyst coverage data from IBES. The daily and monthly Fama–French factors and risk-free rates are from Kenneth French’s data library. The sample period is January 2004 to December 2018.
At the end of each month and for each optionable stock, we collect a pair of options (one call and one put) that are closest to being ATM and that expire on the third Friday/Saturday of the month after the next. For example, on June 30, 2011, we select options expiring on Aug. 20, 2011. For a given month, all options that we study have the same expiration day, and our cross-sectional analysis is not influenced by the difference in maturities. We focus on these options because short-term ATM options are traded more frequently and with lower effective transaction costs than long-term options or expiring options. We apply several filters to the option data. First, our main analyses use options whose stocks do not have a planned dividend payment with ex-dividend dates prior to option expiration (i.e., we only exclude an option if the underlying stock has announced, at the time of establishing the portfolio, a dividend payment during the remaining life of the option). Second, to avoid microstructure-related bias, we retain only options that have positive trading volume in the last month. Third, we keep common stocks with stock prices larger than $5 in the previous month. Fourth, we exclude stocks with missing ESG scores from ASSET4 data and only retain stocks with both call and put options available after filtering. To ensure that our tests do not suffer from potential look-ahead bias as outlined in Duarte, Jones, Khorram, Mo, and Wang (Reference Duarte, Jones, Khorram, Mo and Wang2026), all the aforementioned filters mentioned are based on available real-time information, so future information is not used in our portfolio formation process.
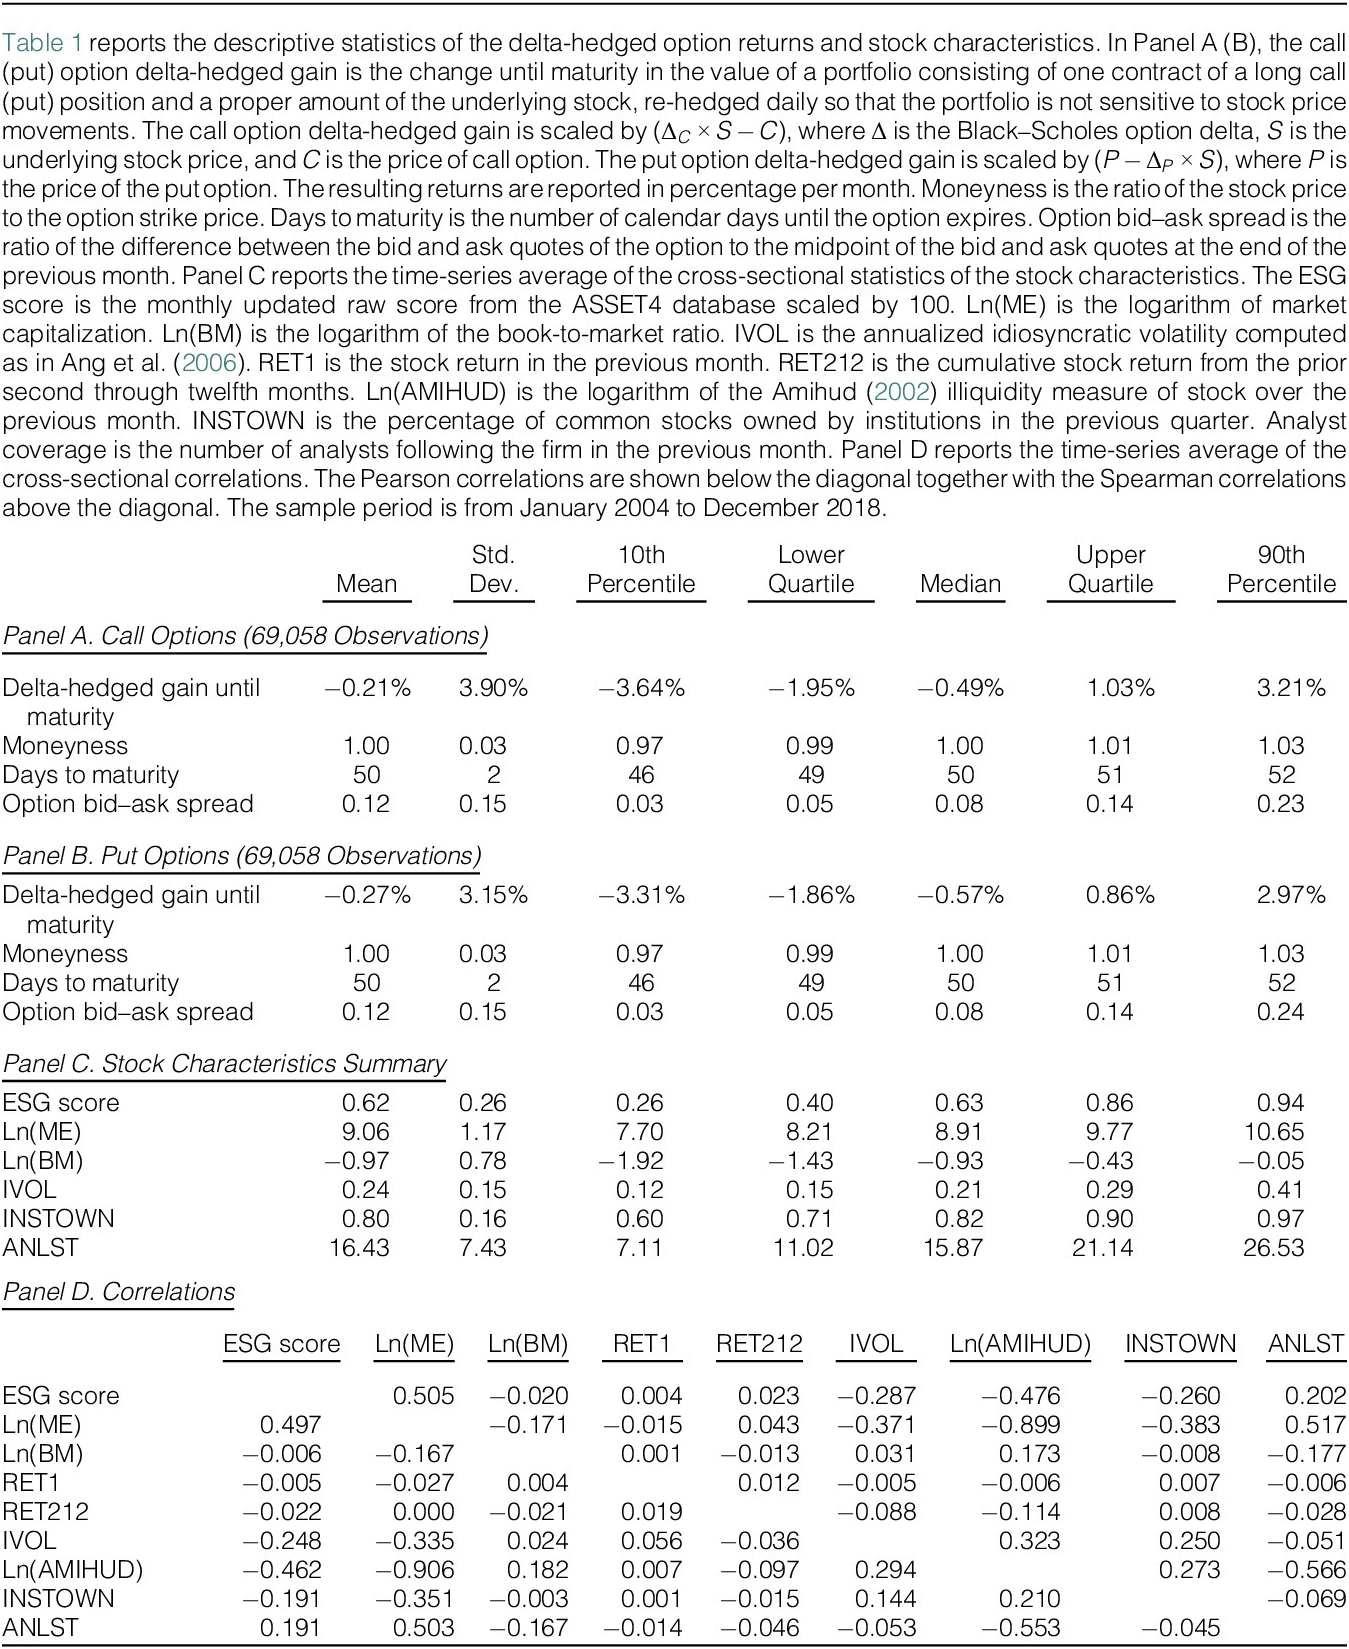
Our final sample contains 69,058 option-month observations for both call and put options on individual stocks. Table 1 shows that the average moneyness of the sample options is 1, with a small standard deviation of 0.03. The time to maturity is between 46 and 52 calendar days, with an average of 50 days. These short-term ATM options have relatively smaller bid–ask spreads and provide more reliable pricing information related to investors’ perceptions of risk and uncertainty.

TABLE 1 Long description
The table is divided into four panels.
Panel A: Call Options (69,058 Observations).
- Delta-hedged gain until maturity: Mean -0.21%, Std. Dev. 3.90%, Median -0.49%.
- Moneyness: Mean 1.00, Std. Dev. 0.03, Median 1.00.
- Days to maturity: Mean 50, Std. Dev. 2, Median 50.
- Option bid-ask spread: Mean 0.12, Std. Dev. 0.15, Median 0.08.
Panel B: Put Options (69,058 Observations).
- Delta-hedged gain until maturity: Mean -0.27%, Std. Dev. 3.15%, Median -0.57%.
- Moneyness: Mean 1.00, Std. Dev. 0.03, Median 1.00.
- Days to maturity: Mean 50, Std. Dev. 2, Median 50.
- Option bid-ask spread: Mean 0.12, Std. Dev. 0.15, Median 0.08.
Panel C: Stock Characteristics Summary.
- E S G score: Mean 0.62, Std. Dev. 0.26, Median 0.63.
- L n (M E): Mean 9.06, Std. Dev. 1.17, Median 8.91.
- L n (B M): Mean -0.97, Std. Dev. 0.78, Median -0.93.
- I V O L: Mean 0.24, Std. Dev. 0.15, Median 0.21.
- I N S T O W N: Mean 0.80, Std. Dev. 0.16, Median 0.82.
- A N L S T: Mean 16.43, Std. Dev. 7.43, Median 15.87.
Panel D: Correlations.
This panel presents a correlation matrix for E S G score, L n (M E), L n (B M), R E T 1, R E T 2 1 2, I V O L, L n (A M I H U D), I N S T O W N, and A N L S T. Pearson correlations are below the diagonal and Spearman correlations are above. Notable Pearson correlations include a strong negative correlation between L n (M E) and L n (A M I H U D) at -0.906 and a positive correlation between E S G score and L n (M E) at 0.497.
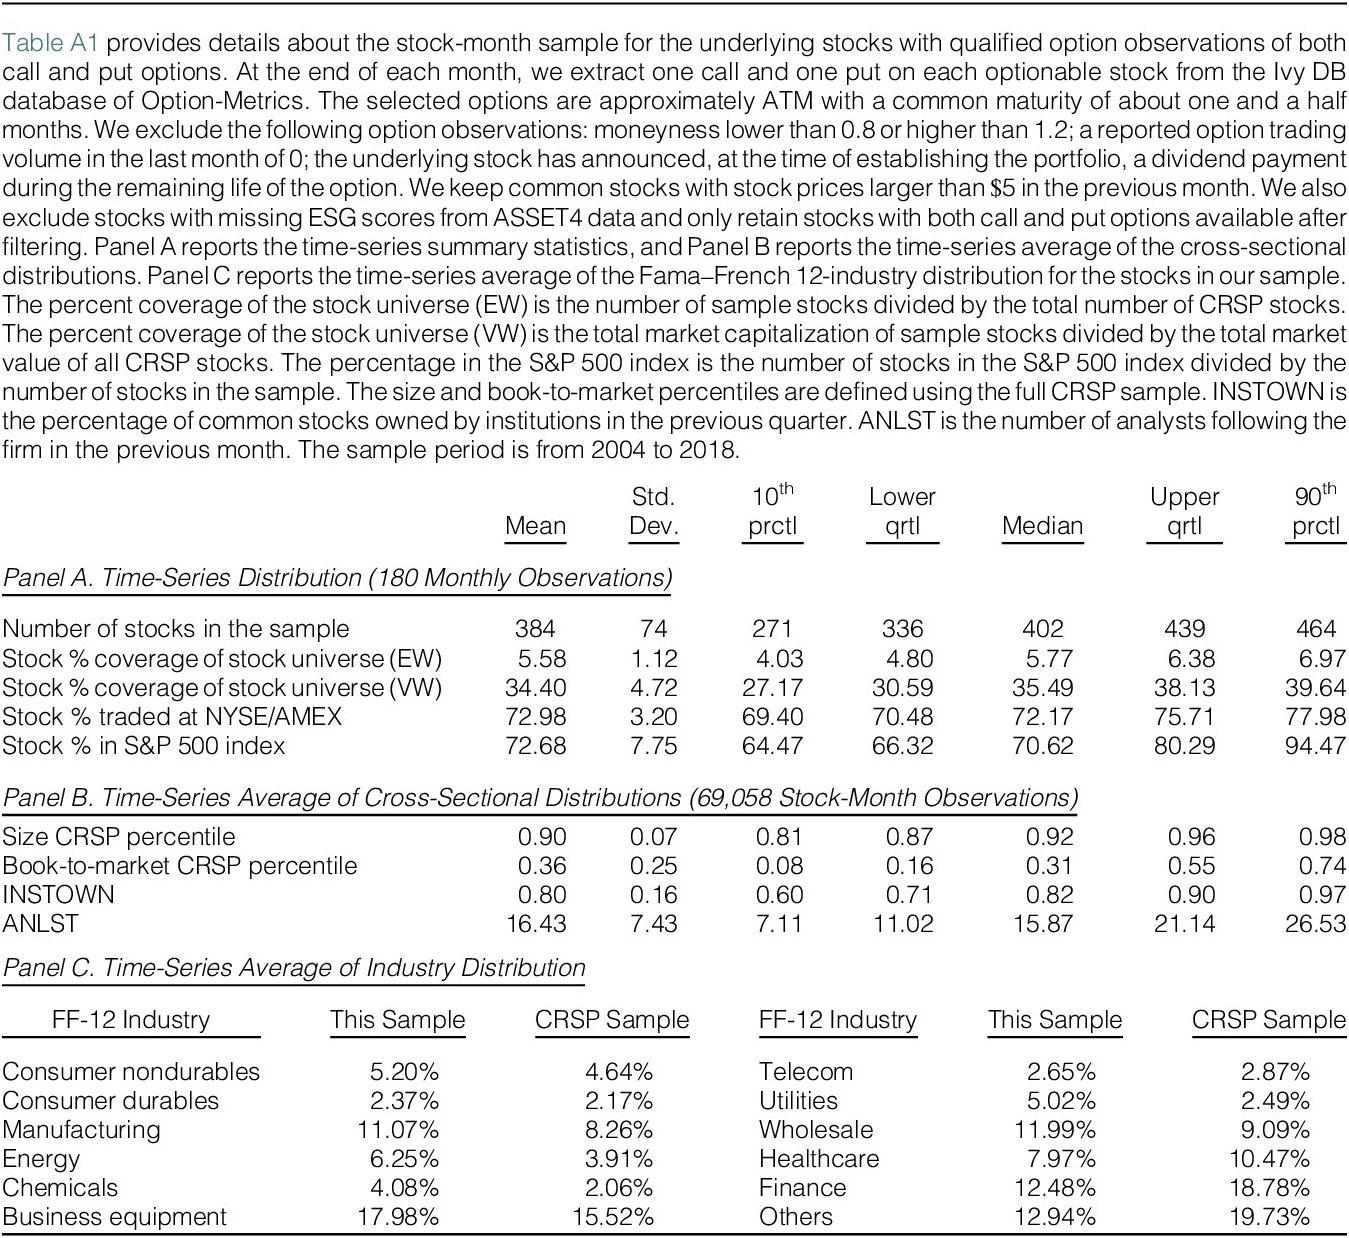
Table A1 reports the sample coverage details of 899 unique underlying stocks. The average number of stocks in our sample per month is 384. On average, our sample contains only 5.58% of the total number of stocks in CRSP but comprises 34% of the total market capitalization. In addition, 73% of our sample stocks are traded on the NYSE/AMEX and 72.7% are included in the S&P 500 index. Compared to the full CRSP sample, the average size percentile and the book-to-market ratio percentile of these stocks in our sample are 90% and 36%, respectively. In addition, the average institutional ownership is 80%, and the average number of analysts following is 16.43. The industry distribution of these stocks does not deviate substantially from that of the full CSRP sample. Given the characteristics of our sample firms, the results are less likely to be confounded by market frictions, such as small, illiquid, less transparent stocks, stocks with low attention, or bias toward a few industries.
B. Delta-Hedged Option Return
We rebalance the delta-hedged option on each trading day and calculate the delta-hedged call option return until maturity following Bakshi and Kapadia (Reference Bakshi and Kapadia2003) and Cao and Han (Reference Cao and Han2013). We define the daily rebalanced delta-hedged option gain as the change in the value of a self-financing portfolio that consists of a long call position hedged by a short position in the underlying stock. Such a portfolio is not sensitive to stock price movements, with the net investment earning the risk-free rate.Footnote
7 Specifically, consider a call option that is hedged discretely
$ N $
 times over a period
$ \left[t,t+1\right] $
 . The rebalancing times are
$ {t}_n $
 (where
$ {t}_0=t $
 and
$ {t}_N=t+1 $
 ). The delta-hedged call option gain is

where
$ {\Delta}_{c,{t}_n} $
 is the call delta of the call option on date
$ {t}_n $
 ,
$ {r}_{t_n} $
 is the annualized risk-free rate on date
$ {t}_n $
 , and
$ {a}_n $
 is the number of calendar days between
$ {t}_n $
 and
$ {t}_{n+1} $
 .Footnote
8
, Footnote
9 The delta-hedged put option gain is defined similarly. Note that since we hold options to maturity,
$ {C}_{t+1}=\max \left({S}_{t+1}-K,0\right) $
 and
$ {P}_{t+1}=\max \left(K-{S}_{t+1},0\right) $
 . With a zero-net-investment initial position, the delta-hedged option gain
$ {\Pi}_{t+1} $
 is the excess dollar return of the delta-hedged option. Because the option price is homogeneous of degree one in the stock price and the strike price,
$ {\Pi}_{t+1} $
 is proportional to the initial stock price. To make it comparable across stocks, we scale the dollar return by
$ {\Delta}_{c,t}{S}_t-{C}_t $
 for call options and
$ {P}_t-{\Delta}_{p,t}{S}_t $
 for puts.Footnote
10
Panels A and B of Table 1 present the summary statistics of the delta-hedged option returns until maturity for the call and put options, respectively. Consistent with the findings of Cao and Han (Reference Cao and Han2013), the average delta-hedged returns of individual equity options are negative for both calls and puts. On average, the delta-hedged return for calls (puts) is −0.21% (−0.27%) until maturity. There is substantial cross-sectional variation in these returns. For example, the lower and upper quartiles of delta-hedged call returns are −1.95% and 1.03%, respectively.
We report the stock-related summary statistics in Panel C of Table 1. Ln(ME) is the logarithm of market capitalization, and Ln(BM) is the logarithm of the book-to-market ratio (Fama and French (Reference Fama and French1992)). RET1 is the stock return in the prior month. RET212 is the cumulative stock return from the prior second through twelfth months. As in Ang, Hodrick, Xing, and Zhang (Reference Ang, Hodrick, Xing and Zhang2006), idiosyncratic volatility (IVOL) is computed as the standard deviation of the residuals of the Fama and French (Reference Fama and French1993) 3-factor model estimated using the daily stock returns over the previous month. Ln(AMIHUD) is the logarithm of the Amihud (Reference Amihud2002) stock illiquidity measure, calculated as the average of the daily ratio of the absolute stock return to dollar volume over the previous month. The ESG score has a mean of 0.62 and a standard deviation of 0.26. Such a large cross-sectional variation of ESG scores is useful to estimate the effect of ESG performance on the options market. Panel D of Table 1 reports the time-series average of the cross-sectional correlations among these stock variables. The ESG score tends to have high correlations with Ln(ME) and Ln(AMIHUD), which we further control in the multivariate regression analyses.
III. ESG Premium
A. Portfolio Sort Results
To understand the pricing implications of ESG performance, we start our analysis using portfolio sorts to quantify the ESG premium. We use two types of option returns to calculate this premium. First, we rely on the daily rebalanced delta-hedged option returns, as described in Section II.B.
The second option return is a daily rebalanced zero-beta straddle portfolio return, which is also not sensitive to stock returns. Dew-Becker et al. (Reference Dew-Becker, Giglio and Kelly2021) also use straddle returns to study whether investors hedge macroeconomic risks. We select a call option and a put option with a maturity of 50 days and are closest to ATM, as in the main tests. Following Coval and Shumway (Reference Coval and Shumway2001), we form zero-beta straddles by solving the following equations:

where
$ {r}_v $
 is the straddle return,
$ \theta $
 is the fraction of the straddle’s value in call options, and
$ {\beta}_c $
 and
$ {\beta}_p $
 are the market betas of the call and put, respectively.
$ {\beta}_c $
 is calculated as follows:

where
$ {\beta}_s $
 is the rolling beta of the stock, which is estimated using weekly returns over the past year. To ensure that beta-neutrality is preserved as closely as possible during the holding period and the portfolio is less exposed to unintentional risks, we daily rebalance the straddle portfolio until maturity. Following a similar procedure in Section II.B, we sum up the daily gain over the holding period and scale it by the initial cost of the portfolio.Footnote
11
To measure the ESG premium, we sort all stocks into quintiles based on the ESG score at the end of each month and then calculate the equal-weighted portfolio return for the quintiles and the H
$ - $
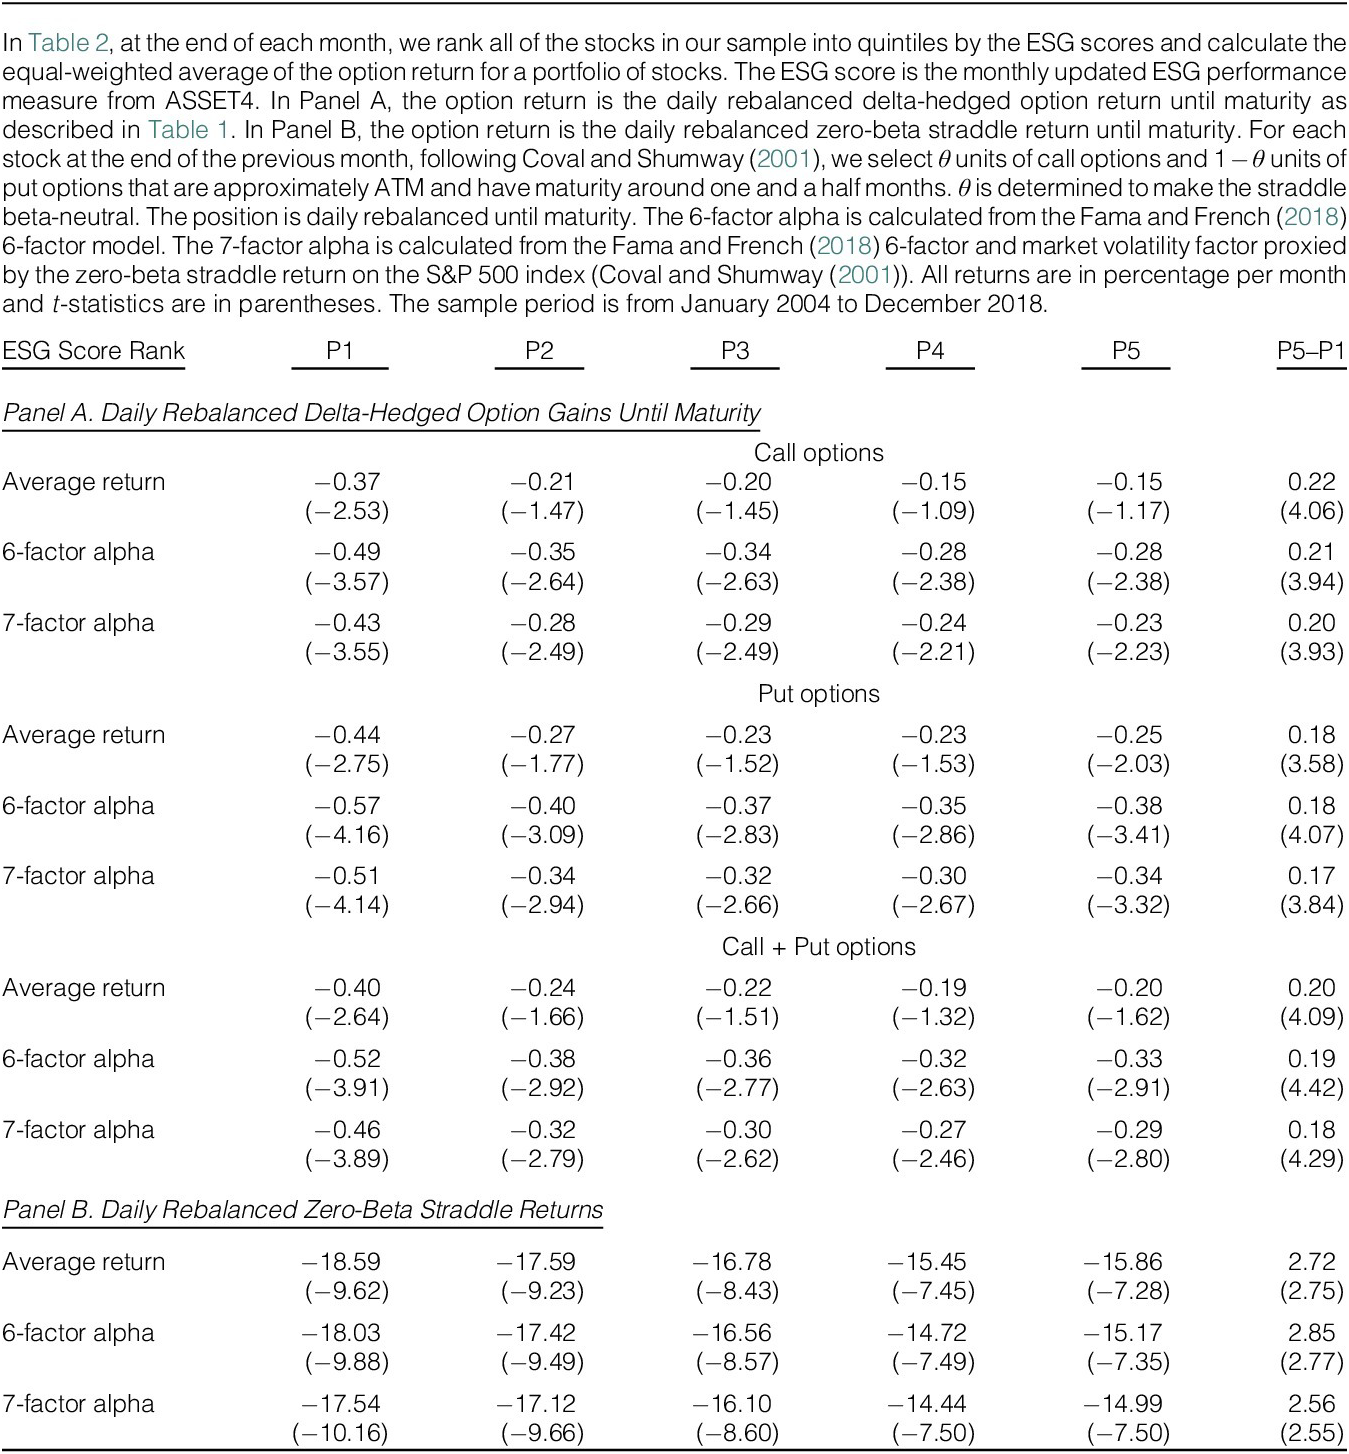
 L spread portfolio using the three option returns. Throughout the article, all returns reported are in excess of the risk-free rate. In addition, we report the risk-adjusted return based on two different factor models. The first is a 6-factor model from Fama and French (Reference Fama and French2018) that includes the market factor, size factor, value factor, profitability factor, investment factor, and momentum factor. The second is a 7-factor model that includes these six factors plus a market volatility factor proxied by the zero-beta straddle return on the S&P 500 index (Coval and Shumway (Reference Coval and Shumway2001), Carr and Wu (Reference Carr and Wu2009)), to examine whether the portfolio return can be further explained by the systematic volatility risk factor. The portfolio sort results for daily rebalanced delta-hedged option returns and straddle returns are reported in Panels A and B of Table 2, respectively. Panel A shows the results separately for delta-hedged calls and delta-hedged puts. Delta-hedged call and put positions are, in essence, volatility positions and thus should behave similarly. To increase the power of some of our tests, we also pool both calls and puts in the results in Panel A.

TABLE 2 Long description
The table is titled E S G Premium and is divided into two main sections. The columns are E S G Score Rank (P 1, P 2, P 3, P 4, P 5) and a difference column P 5 minus P 1. Values in parentheses are t-statistics.
Panel A: Daily Rebalanced Delta-Hedged Option Gains Until Maturity.
* Call options: Average returns increase from -0.37 (P 1) to -0.15 (P 5), with a P 5 minus P 1 difference of 0.22 (t = 4.06). 6-factor alpha and 7-factor alpha show similar increasing trends from P 1 to P 5.
* Put options: Average returns increase from -0.44 (P 1) to -0.25 (P 5), with a P 5 minus P 1 difference of 0.18 (t = 3.58).
* Call plus Put options: Average returns increase from -0.40 (P 1) to -0.20 (P 5), with a P 5 minus P 1 difference of 0.20 (t = 4.09).
Panel B: Daily Rebalanced Zero-Beta Straddle Returns.
* Average returns: Values increase from -18.59 (P 1) to -15.86 (P 5), with a P 5 minus P 1 difference of 2.72 (t = 2.75).
* 6-factor alpha: Increases from -18.03 (P 1) to -15.17 (P 5), with a difference of 2.85 (t = 2.77).
* 7-factor alpha: Increases from -17.54 (P 1) to -14.99 (P 5), with a difference of 2.56 (t = 2.55).
The returns and alphas from the factor models exhibit patterns consistent with our conjecture that options on low-ESG stocks are more expensive. Both returns and alphas increase monotonically from quintile 1 (lowest ESG score) to quintile 5 (highest ESG score), and these results are robust across the three types of option returns. For example, in Panel A of Table 2, where we consider daily rebalanced delta-hedged option returns, when we group call and put options together, the 6-factor alpha of the quintile 1 (5) portfolio is −0.52% (−0.33%), leading to a H
$ - $
 L portfolio alpha of 0.19%, which is statistically significant at the 1% level. The H
$ - $
 L 7-factor alpha is 0.18% and still significant at the 1% level. The call and put option returns demonstrate similar patterns, although the magnitude of the H
$ - $
 L portfolio alphas is slightly higher for call options than for put options.
Panel B of Table 2 shows that daily rebalanced beta-neutral straddle returns also increase as ESG scores increase, with a 7-factor alpha of −17.54% for the quintile 1 portfolio and −14.99% for the quintile 5 portfolio, yielding a H
$ - $
 L portfolio alpha of 2.56%. Overall, the portfolio-sorting results show that there is an ESG premium in the cross section of option returns, supporting the hypothesis that investors pay a significant premium to hedge against uncertainties associated with poor ESG performance. The magnitude of the ESG premia is around 0.2% for daily rebalanced delta-hedged returns and around 2.7% for straddle returns.
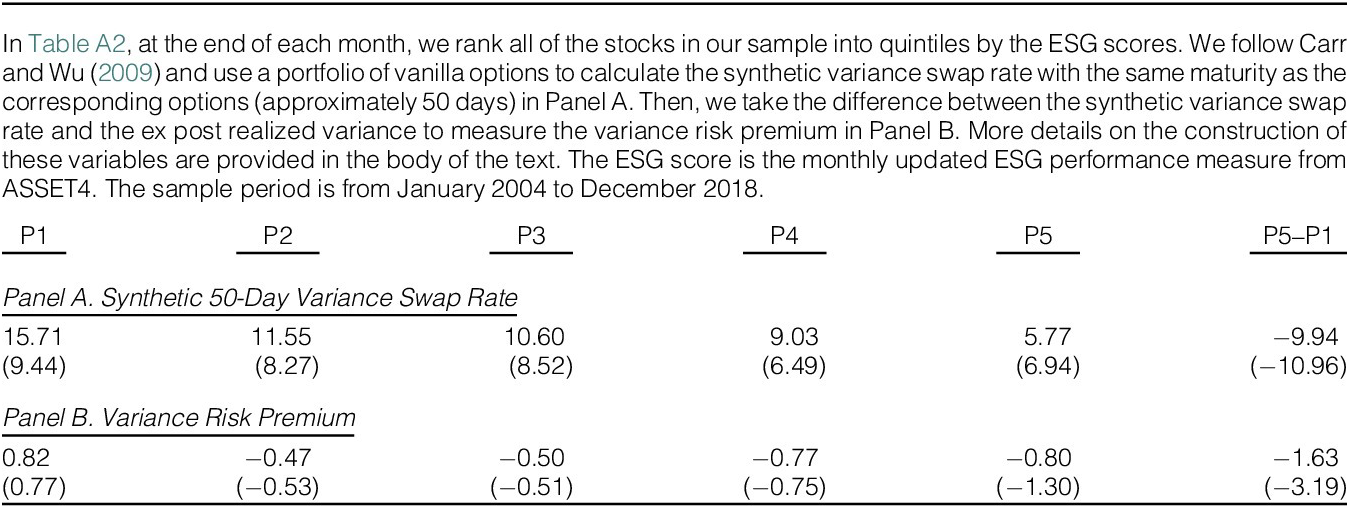
As a further robustness check, we analyze variance swaps, which provide a straightforward strategy to place a directional bet on future variances. We follow Carr and Wu (Reference Carr and Wu2009) to create synthetic variance swaps from options.Footnote 12 We then investigate whether the variance swap rate and the variance risk premium are related to the ESG scores. Because the variance swap rate is similar to prices, we analyze the contemporaneous relation between the ESG scores and the variance swap rate in this analysis. The results are reported in Table A2. We find that the synthetic variance swap rate with the same maturities as the options in our sample (approximately 50 days) is higher for low-ESG stocks (Panel A), and the variance risk premium is also higher for low-ESG stocks (Panel B), indicating that investors are willing to pay a higher premium to hedge against the variance risks associated with low-ESG stocks. Although we acknowledge that there are approximation errors inherent in the procedure of synthesizing variance swaps from vanilla options (Carr, Lee, and Wu (Reference Carr, Lee and Wu2012)), the evidence using variance swaps nonetheless corroborates the evidence using delta-hedged options.
B. E, S, or G
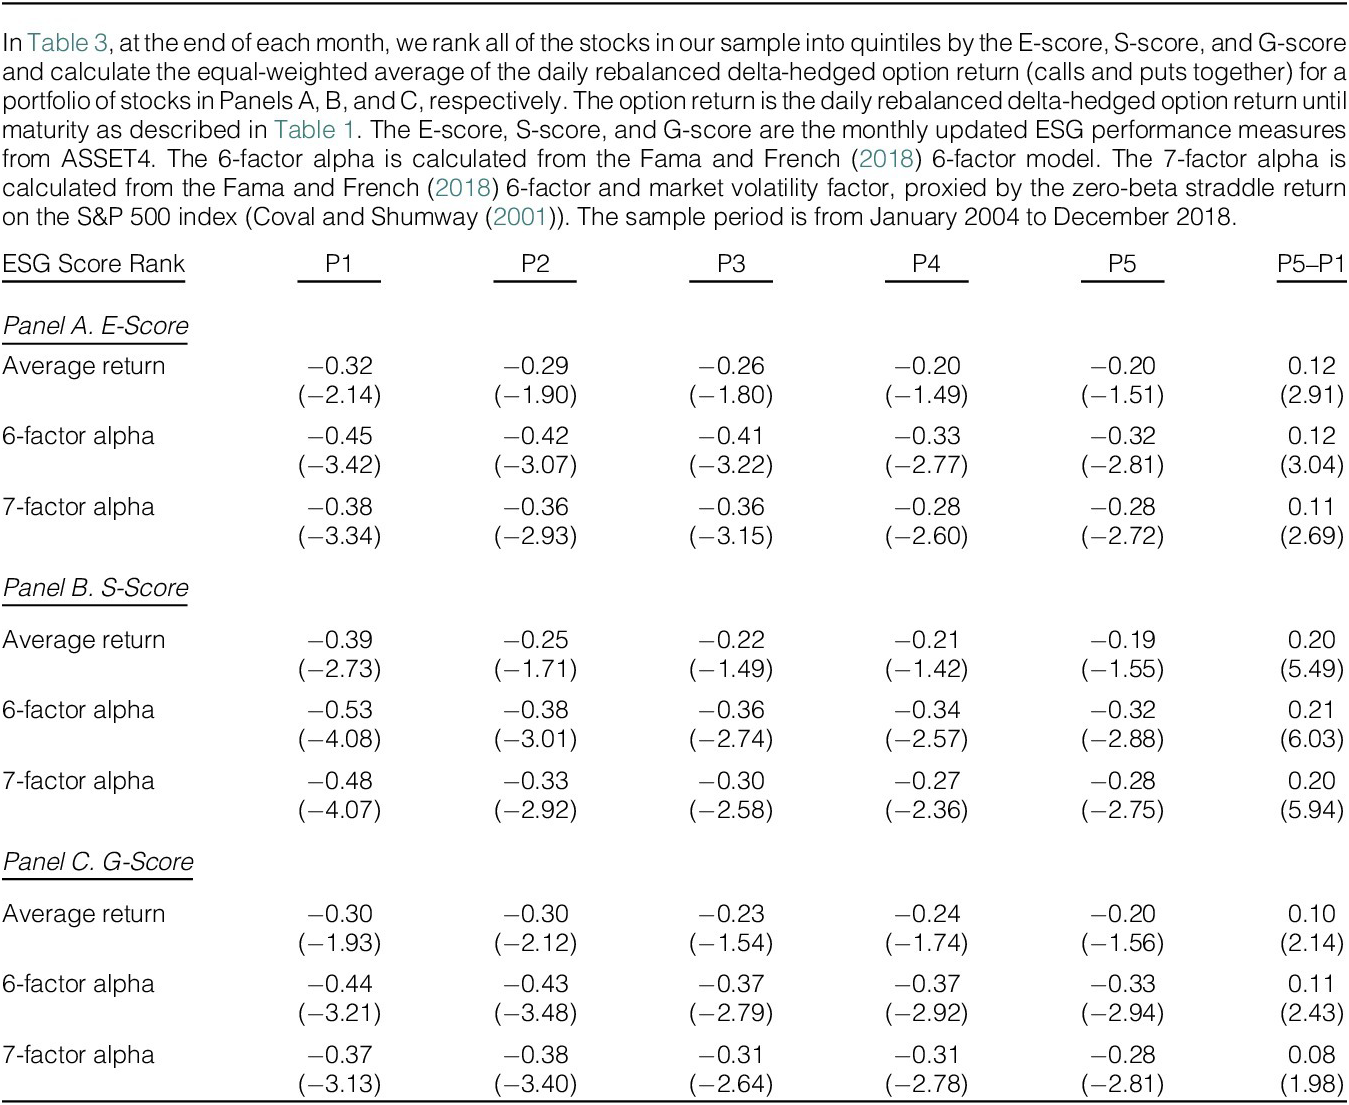
In this subsection, we examine the effects of environmental (E-score), social (S-score), and corporate governance (G-score) performance on option pricing separately. This investigation allows us to understand whether some ESG components are relatively more important for option pricing. We repeat the portfolio sort analyses similarly to those in Table 2, using the E-score, the S-score, and the G-score as the sorting variables separately. Table 3 shows the results for the daily rebalanced delta-hedged option returns for the call and put options together.Footnote
13 When sorting on the E-score, Panel A shows that the H
$ - $
 L portfolio alpha is 0.12% (0.11%) based on the 6-factor (7-factor) model, which is significant at the 1% level. The H
$ - $
 L spread for the S-score has a larger magnitude than that for the E-score, with a 6-factor (7-factor) alpha of 0.21% (0.20%). The average return of H
$ - $
 L drops to 0.10% for the G-score. Comparisons of the three scores show that the E-score and S-score are stronger determinants of option returns than the G-score. Taken together, the results in Table 3 show that option pricing depends on all three kinds of risks. Although environmental (or climate) risks have drawn considerable attention in recent academic literature, social and governance performance and environmental performance are important drivers of our results.

TABLE 3 Long description
The table is divided into three sections: Panel A for E-Score, Panel B for S-Score, and Panel C for G-Score. All panels share a header with columns labeled E S G Score Rank: P 1, P 2, P 3, P 4, P 5, and P 5 minus P 1.
Panel A. E-Score:
* Average return: Starts at minus 0.32 for P 1 and increases to minus 0.20 for P 5. The P 5 minus P 1 difference is 0.12 with a t-stat of 2.91.
* 6-factor alpha: Starts at minus 0.45 for P 1 and increases to minus 0.32 for P 5. The P 5 minus P 1 difference is 0.12 with a t-stat of 3.04.
* 7-factor alpha: Starts at minus 0.38 for P 1 and increases to minus 0.28 for P 5. The P 5 minus P 1 difference is 0.11 with a t-stat of 2.69.
Panel B. S-Score:
* Average return: Starts at minus 0.39 for P 1 and increases to minus 0.19 for P 5. The P 5 minus P 1 difference is 0.20 with a t-stat of 5.49.
* 6-factor alpha: Starts at minus 0.53 for P 1 and increases to minus 0.32 for P 5. The P 5 minus P 1 difference is 0.21 with a t-stat of 6.03.
* 7-factor alpha: Starts at minus 0.48 for P 1 and increases to minus 0.28 for P 5. The P 5 minus P 1 difference is 0.20 with a t-stat of 5.94.
Panel C. G-Score:
* Average return: Starts at minus 0.30 for P 1 and increases to minus 0.20 for P 5. The P 5 minus P 1 difference is 0.10 with a t-stat of 2.14.
* 6-factor alpha: Starts at minus 0.44 for P 1 and increases to minus 0.33 for P 5. The P 5 minus P 1 difference is 0.11 with a t-stat of 2.43.
* 7-factor alpha: Starts at minus 0.37 for P 1 and increases to minus 0.28 for P 5. The P 5 minus P 1 difference is 0.08 with a t-stat of 1.98.
The results also suggest that ESG risks are likely to be systematic, especially environmental and social risks. There are different potential sources of systematic ESG risks. For example, pro-environmental regulations may subsidize high-ESG products or handicap low-ESG products, leading to a greater difference in customer demand between high-ESG firms and low-ESG firms. The impact of regulation shocks on individual firms depends on their ESG risk exposure, which is proxied by ESG performance. It could also come from social movements, which may change public awareness and investors’ perceptions. For example, #MeToo is a social movement against sexual abuse and sexual harassment.Footnote 14 After #MeToo, firms performing badly on workplace harassment were exposed to significant monetary penalties and reputational harm. This shock affects the whole market systematically, while the impact depends on the firm’s ESG risk exposure (i.e., performance on workplace harassment). At the same time, it is possible that some ESG risks are idiosyncratic. This is most likely the case with governance risks. We do find that the risk premium associated with the G-score is smaller and less significant.
C. Sources of Risk Premia
Delta-hedged option returns and straddle returns embed various kinds of risk premia, such as volatility risk and tail risk premia. Many studies document a nonzero volatility risk premium (see, e.g., Buraschi and Jackwerth (Reference Buraschi and Jackwerth2001), Coval and Shumway (Reference Coval and Shumway2001)). Bakshi and Kapadia (Reference Bakshi and Kapadia2003) show that priced volatility risk is an important source of underperformance of delta-hedged portfolios. Similarly, option prices reflect the risk of potential unforeseen tail events (Jackwerth and Rubinstein (Reference Jackwerth and Rubinstein1996), Bakshi and Kapadia (Reference Bakshi and Kapadia2003)). Accordingly, in this subsection, we investigate whether the positive relationship between ESG and the delta-hedged option return is driven by exposure to these various kinds of risks.
A delta-hedged option position is essentially a volatility position whose payoff is based on the volatility of the underlying stock (similar to, albeit not exactly the same as, a variance swap, as noted in Section III.A). Since the seminal study of Bakshi and Kapadia (Reference Bakshi and Kapadia2003), variance risk premia have been known to be negative—an increase in volatility is typically regarded as corresponding to bad states. If an increase in the volatility of low-ESG firms corresponds to an increase in aggregate volatility, then these positions pay off when the world is in a bad state, and investors are willing to pay for this insurance. We find evidence consistent with this. Specifically, we calculate the volatility betas of firms by regressing the physical volatility of stocks (or changes in volatility) against aggregate volatility (or its changes), where volatility is calculated as the standard deviation of daily returns over the past month, and we use the past year to estimate the betas. In unreported results, we find that the volatility betas of low-ESG firms are higher than those of high-ESG firms (the difference is statistically significant). This rationalizes the insurance premia in options on low-ESG firms.
To further directly test whether risk premia associated with volatility and jump risks are related to ESG scores, we use tradable portfolios. We follow Cremers et al. (Reference Cremers, Halling and Weinbaum2015) and use two beta-neutral straddles with different maturities to construct a jump risk portfolio and a volatility risk portfolio. In particular, the jump risk portfolio is a beta-neutral, vega-neutral, and gamma-positive strategy consisting of i) a long position in one beta-neutral ATM straddle with maturity
$ {T}_1 $
 and ii) a short position in
$ y $
 market-neutral ATM straddles with maturity
$ {T}_2 $
 , where
$ {T}_2>{T}_1 $
 and
$ y $
 are chosen to make the overall portfolio vega-neutral. Similarly, the volatility risk portfolio is a market-neutral, gamma-neutral, and vega-positive strategy consisting of i) a long position in one market-neutral ATM straddle with maturity
$ {T}_2 $
 and ii) a short position in
$ y $
 market-neutral ATM straddles with maturity
$ {T}_1 $
 , where
$ {T}_2>{T}_1 $
 and
$ y $
 are chosen to make the gamma of the overall strategy zero. Considering option liquidity, we choose
$ {T}_2 $
 to be 80 days and
$ {T}_1 $
 to be 50 days. The rest of the procedure is the same as described in Section III.A. Following Cremers et al. (Reference Cremers, Halling and Weinbaum2015), we rebalance these portfolios daily to maintain its intended exposures. Higher portfolio returns indicate lower exposure to volatility risk or jump risk.
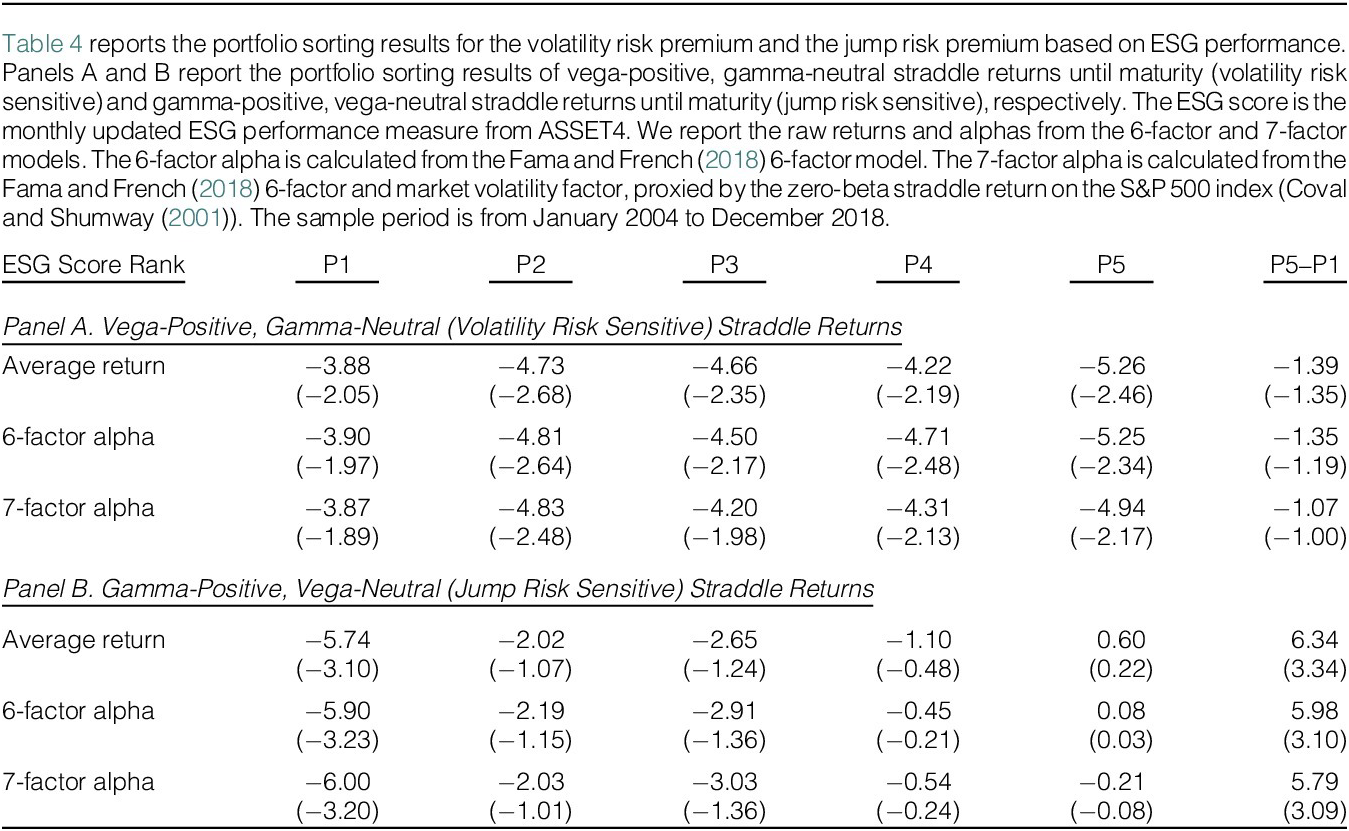
We use these two straddle returns as dependent variables in the portfolio sort analysis, similar to those in Table 2. The results are reported in Table 4. Somewhat surprisingly, we find weaker evidence for the pricing of volatility risks, as the H
$ - $
 L spread returns or alphas are not significantly different from 0 for straddle portfolios exposed to only volatility risk (gamma-neutral and vega-positive) in Panel A. In contrast, the H
$ - $
 L spread returns and alphas are large in economic magnitude and highly statistically significant for straddle portfolios exposed to only jump risks in Panel B (gamma-positive and vega-neutral). The H
$ - $
 L jump straddle portfolio is 5.79% using the 7-factor alpha.

TABLE 4 Long description
The table is organized into two main sections: Panel A and Panel B. The columns are labeled E S G Score Rank, P 1, P 2, P 3, P 4, P 5, and P 5 minus P 1.
Panel A: Vega-Positive, Gamma-Neutral (Volatility Risk Sensitive) Straddle Returns.
* Average return: P 1 is minus 3.88, P 2 is minus 4.73, P 3 is minus 4.66, P 4 is minus 4.22, P 5 is minus 5.26, and P 5 minus P 1 is minus 1.39.
* 6-factor alpha: P 1 is minus 3.90, P 2 is minus 4.81, P 3 is minus 4.50, P 4 is minus 4.71, P 5 is minus 5.25, and P 5 minus P 1 is minus 1.35.
* 7-factor alpha: P 1 is minus 3.87, P 2 is minus 4.83, P 3 is minus 4.20, P 4 is minus 4.31, P 5 is minus 4.94, and P 5 minus P 1 is minus 1.07.
Panel B: Gamma-Positive, Vega-Neutral (Jump Risk Sensitive) Straddle Returns.
* Average return: P 1 is minus 5.74, P 2 is minus 2.02, P 3 is minus 2.65, P 4 is minus 1.10, P 5 is 0.60, and P 5 minus P 1 is 6.34.
* 6-factor alpha: P 1 is minus 5.90, P 2 is minus 2.19, P 3 is minus 2.91, P 4 is minus 0.45, P 5 is 0.08, and P 5 minus P 1 is 5.98.
* 7-factor alpha: P 1 is minus 6.00, P 2 is minus 2.03, P 3 is minus 3.03, P 4 is minus 0.54, P 5 is minus 0.21, and P 5 minus P 1 is 5.79.
Values in parentheses representing t-statistics are provided below each main entry, showing significant positive results for the P 5 minus P 1 difference in Panel B but not in Panel A.
Overall, this subsection shows strong evidence that options with higher ESG scores have lower jump risks, while the evidence for volatility risk is much weaker. We return to this issue in Section IV.E to further understand the pricing of different risks.
D. The Effect of Public Awareness: Time-Series Variation
The perceived uncertainty of low-ESG stocks is expected to be more important when public awareness of ESG issues is high. We corroborate our baseline results by further examining the role of public awareness of/attention to ESG, which is proxied by three measures: the Google search volume index (SVI), the announcement of the Paris Agreement, and aggregate ESG news in the market. We first construct the H
$ - $
 L portfolio based on the ESG score each month and then investigate how the H
$ - $
 L return spread changes with time series variation in public awareness/attention to ESG. Specifically, we run the following regression for different proxies of ESG public awareness/attention:

where
$ {D}_t $
 is an indicator variable indicating the period of high-ESG public awareness/attention. Our variable of interest is
$ {\alpha}_1 $
 , which captures the average return/alpha differences between high-awareness and low-awareness periods. For the first proxy, Google SVI, we divide our sample into two subperiods based on the logarithm of monthly change in the Google SVI (DGSVI) of “Environmental, Social and Corporate Governance.” Periods with higher values are indicated as high-awareness periods.Footnote
15 For the second proxy, the Paris Agreement, we focus on the window around the announcement of the Paris Agreement (July 2014 to December 2018) and designate the period from January 2016 to June 2017 as the high-ESG-awareness period.Footnote
16 We use the number of aggregate ESG news stories in the market as the last proxy for ESG awareness. Each month, we count the number of ESG news stories from RepRisk scaled by the total number of news stories in the market from RavenPack to get the relative amount of ESG news. Then, we divide our sample into two subperiods based on the relative amount of ESG news, and the periods with higher values are identified as high-awareness periods.
Our null hypothesis is that when, for example, Google SVI is high in month
$ t $
 , which may be due to a political summit on environmental issues or social events related to equality, investors pay more attention to ESG risks and pay a higher price to hedge against these uncertainties. This makes options on low-ESG stocks more expensive at the end of month
$ t $
 , leading to a larger alpha of the H
$ - $
 L spread over the approximately 50 days following the end of month
$ t $
 .
We report the results for the Google SVI, the announcement of the Paris Agreement, and the aggregated ESG news in Panels A, B, and C, respectively, of Table 5. We find that the H
$ - $
 L return spread is more prominent when public ESG awareness/attention is higher. In Panel A, the H
$ - $
 L 7-factor alpha is 0.11% (t-stat = 1.68) during the low-awareness period, while the H
$ - $
 L 7-factor alpha is 0.29% during the high-awareness period, and the difference between the two subperiods is 0.18% (significant at the 5% level). Panel B shows that during the Paris Agreement period, the ESG premium is significantly higher than in the periods before the announcement of the Paris Agreement and after the U.S. withdrawal. Panel C demonstrates similar patterns. We conclude that given higher awareness of ESG risks, investors are willing to pay a higher ESG premium.Footnote
17

TABLE 5 Long description
The table is organized into three vertical panels, each with columns for alpha sub 0 and alpha sub 1. Values in parentheses are t-statistics.
Panel A. Impact of Google Search Volume Index
* Average return: alpha sub 0 is 0.10 (1.73), alpha sub 1 is 0.18 (2.19).
* 6-factor alpha: alpha sub 0 is 0.10 (1.61), alpha sub 1 is 0.18 (2.23).
* 7-factor alpha: alpha sub 0 is 0.11 (1.68), alpha sub 1 is 0.18 (2.26).
Panel B. Impact of Paris Agreement
* Average return: alpha sub 0 is minus 0.03 (minus 0.31), alpha sub 1 is 0.30 (2.09).
* 6-factor alpha: alpha sub 0 is minus 0.02 (minus 0.21), alpha sub 1 is 0.29 (1.86).
* 7-factor alpha: alpha sub 0 is minus 0.01 (minus 0.10), alpha sub 1 is 0.34 (1.96).
Panel C. Impact of Aggregated E S G News
* Average return: alpha sub 0 is 0.07 (0.94), alpha sub 1 is 0.19 (1.96).
* 6-factor alpha: alpha sub 0 is 0.07 (0.90), alpha sub 1 is 0.18 (1.90).
* 7-factor alpha: alpha sub 0 is 0.08 (1.01), alpha sub 1 is 0.17 (1.80).
E. Quantity of Risk Versus Price of Risk
The risk premium is the product of the quantity of risk and the market price of risk. To investigate which of these two terms accounts for the higher premiums associated with options with low-ESG scores during the high-awareness period, we test whether the risk of rising volatility and jump intensity are higher for low-ESG stocks. To measure the risk of increasing volatility, we follow Cao et al. (Reference Cao, Titman, Zhan and Zhang2023) and rely on intra-day trading data to calculate the volatility of volatility increases (VOV+), which is the standard deviation of the positive (percentage) change in volatility over option maturity, which is approximately 50 days.Footnote 18 Following Bollerslev et al. (Reference Bollerslev, Li and Zhao2020), we proxy jump intensity by the relative signed jump (RSJ), which is the difference between the negative and positive realized semi-variance over the option maturity, scaled by the sum of the positive and negative realized semi-variance.Footnote 19
We then define the risk spread as the VOV+ or the RSJ difference between the portfolio with the highest ESG score and the portfolio with the lowest ESG score, and we run the following regression to investigate how the risk spread varies with ESG attention:

where
$ {D}_t $
 is defined the same way as in equation (4). The coefficient
$ {\alpha}_0 $
 measures whether the quantity of risk is different between low- and high-ESG stocks on average. The coefficient
$ {\alpha}_1 $
 measures how the quantity of risk varies with ESG-related events.
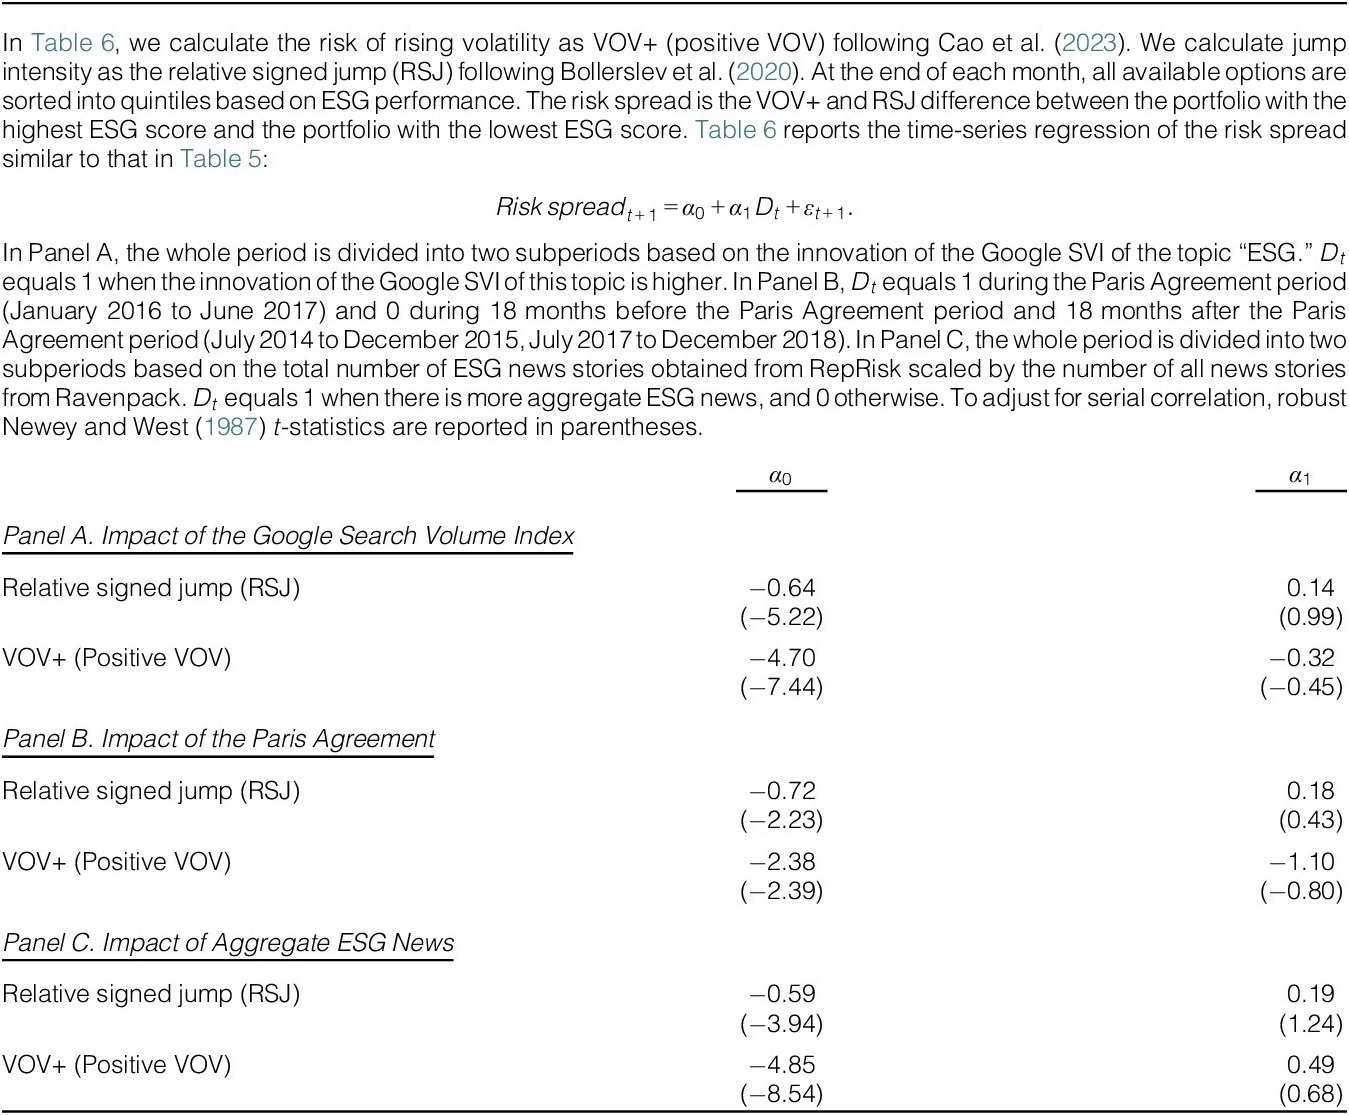
Table 6 shows that
$ {\alpha}_0 $
 is generally negative (and statistically significant in almost all specifications), showing that low-ESG stocks have a higher jump intensity and a higher risk of increasing volatility. The fact that low-ESG stocks are “riskier” (insofar as risk is measured by VOV+ and RSJ) is consistent with the quantity of risk driving the higher risk premium on options on low-ESG stocks. However, this evidence is unconditional and does not rule out that the price of risk also varies systematically with ESG awareness.

TABLE 6 Long description
The table is divided into three sections: Panel A, Panel B, and Panel C. Each panel contains two rows of data for Relative signed jump (R S J) and V O V plus (Positive V O V), with columns for alpha sub 0 and alpha sub 1. Values in parentheses represent t-statistics.
Panel A. Impact of the Google Search Volume Index:
* R S J: alpha sub 0 is -0.64 (-5.22), alpha sub 1 is 0.14 (0.99).
* V O V plus: alpha sub 0 is -4.70 (-7.44), alpha sub 1 is -0.32 (-0.45).
Panel B. Impact of the Paris Agreement:
* R S J: alpha sub 0 is -0.72 (-2.23), alpha sub 1 is 0.18 (0.43).
* V O V plus: alpha sub 0 is -2.38 (-2.39), alpha sub 1 is -1.10 (-0.80).
Panel C. Impact of Aggregate E S G News:
* R S J: alpha sub 0 is -0.59 (-3.94), alpha sub 1 is 0.19 (1.24).
* V O V plus: alpha sub 0 is -4.85 (-8.54), alpha sub 1 is 0.49 (0.68).
We find that the coefficient
$ {\alpha}_1 $
 in Table 6 is statistically insignificant in all our specifications. Thus, the quantity of risk does not vary with ESG-related events. Since Table 5 shows that the risk premium is higher in these periods, we conclude that the increase in the ESG premium during these periods comes from the increase in the market price of risks. For example, when Google SVI on ESG topics increases, investors pay more attention to ESG issues, and the market price of ESG risks increases while the difference in the quantity of risks between low- and high-ESG stocks does not change.
In summary, we find that both the quantity of risks and the market price of risks matter for the return spreads that we document.
IV. ESG Performance and Delta-Hedged Option Returns: Regression Evidence
A. Baseline Results
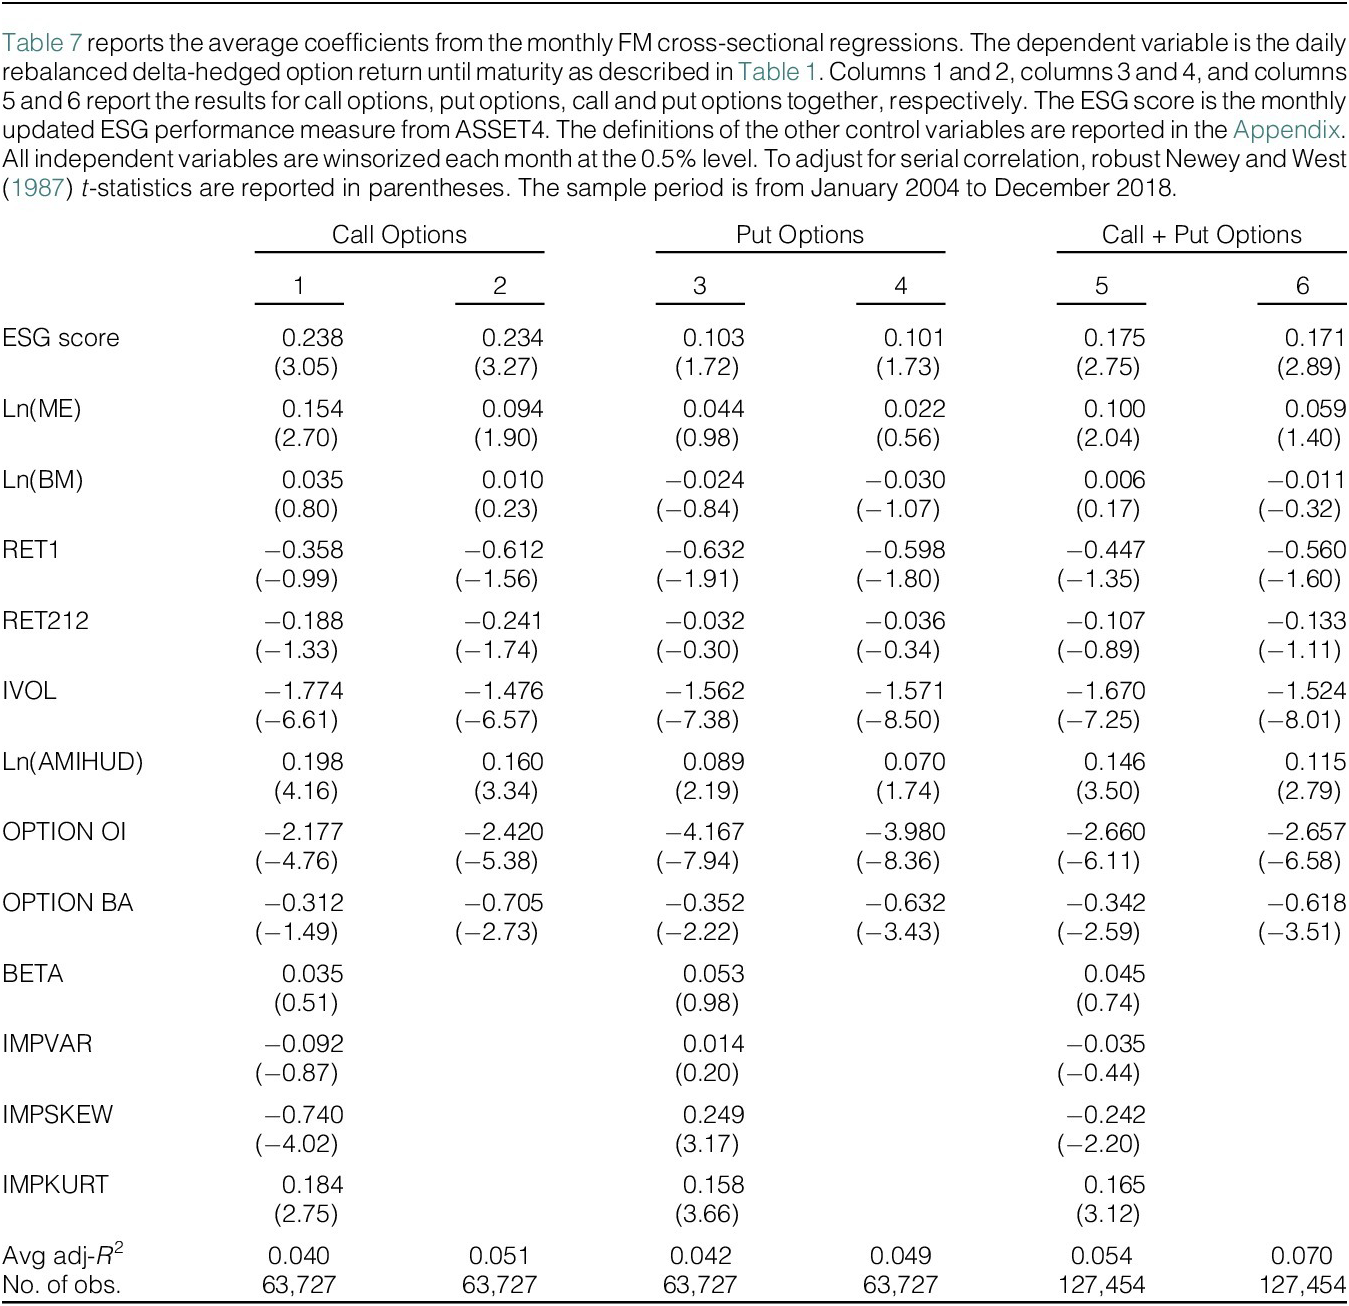
To better control for the confounding effects of other firm characteristics and option characteristics, we next study the effect of ESG performance on the cross section of delta-hedged option returns using monthly FM regressions. The dependent variable is the daily rebalanced delta-hedged option return until maturity as described in Section II.B.
We tabulate the results in Table 7 for call options, put options, and call and put options together. In columns 1, 3, and 5, the control variables are market capitalization, book-to-market ratio, reversal, momentum, idiosyncratic volatility, and stock illiquidity. We also include two option-related variables as controls. Option open interest (OPTION IO) is the total number of option contracts that are open at the end of the previous month scaled by the stock trading volume of the previous month. The option bid–ask spread (OPTION BA) is the ratio of the difference between the bid and ask quotes of options to the midpoint of the bid and ask quotes at the end of the previous month. For call options, the coefficient on ESG is 0.238 (t-stat = 3.05). This coefficient shows that delta-hedged call returns increase by 0.109% each month from the lower quartile of the ESG score (0.40) to the upper quartile of the ESG score (0.86). Given that the mean of delta-hedged call returns is −0.21%, the economic significance of ESG on option returns is substantial. Columns 3 and 4 report the results for put options, and columns 5 and 6 report the results for call and put options together. These results are largely similar to those for calls. In addition, we control for different types of risk measures, including lagged model-free option implied variance, skewness, and kurtosis in our baseline FM regressions, to examine whether these risks could explain the positive relationship between delta-hedged option returns and ESG scores. We find that the ESG score is still significant in explaining delta-hedged call option returns even when we control for volatility and jump risks. The coefficient estimate merely changes for delta-hedged option returns after the inclusion of lagged risk measures. These results indicate that investors perceive that stocks with lower ESG scores have higher risks beyond those stock characteristics, option characteristics, and risk proxies.Footnote 20

TABLE 7 Long description
A table with 6 columns of regression results. The columns are grouped into Call Options (1 and 2), Put Options (3 and 4), and Call plus Put Options (5 and 6).
Key variables and their coefficients (with t-statistics in parentheses):
* E S G score: Shows positive coefficients across all models, ranging from 0.101 to 0.238, with t-statistics between 1.72 and 3.27.
* Ln M E: Coefficients range from 0.022 to 0.154.
* Ln B M: Coefficients range from -0.030 to 0.035.
* R E T 1: Negative coefficients across all models, ranging from -0.358 to -0.632.
* R E T 2 1 2: Negative coefficients ranging from -0.032 to -0.241.
* I V O L: Highly significant negative coefficients ranging from -1.476 to -1.774.
* Ln A M I H U D: Positive coefficients ranging from 0.070 to 0.198.
* O P T I O N O I: Negative coefficients ranging from -2.177 to -4.167.
* O P T I O N B A: Negative coefficients ranging from -0.312 to -0.705.
* B E T A: Coefficients between 0.035 and 0.053 (only in models 1, 3, and 5).
* I M P V A R: Coefficients between -0.092 and 0.014 (only in models 1, 3, and 5).
* I M P S K E W: Negative for calls (-0.740) and positive for puts (0.249).
* I M P K U R T: Positive coefficients between 0.158 and 0.184.
Bottom rows:
* Average adjusted R-squared: Ranges from 0.040 to 0.070.
* Number of observations: 63,727 for individual option types and 127,454 for combined models.
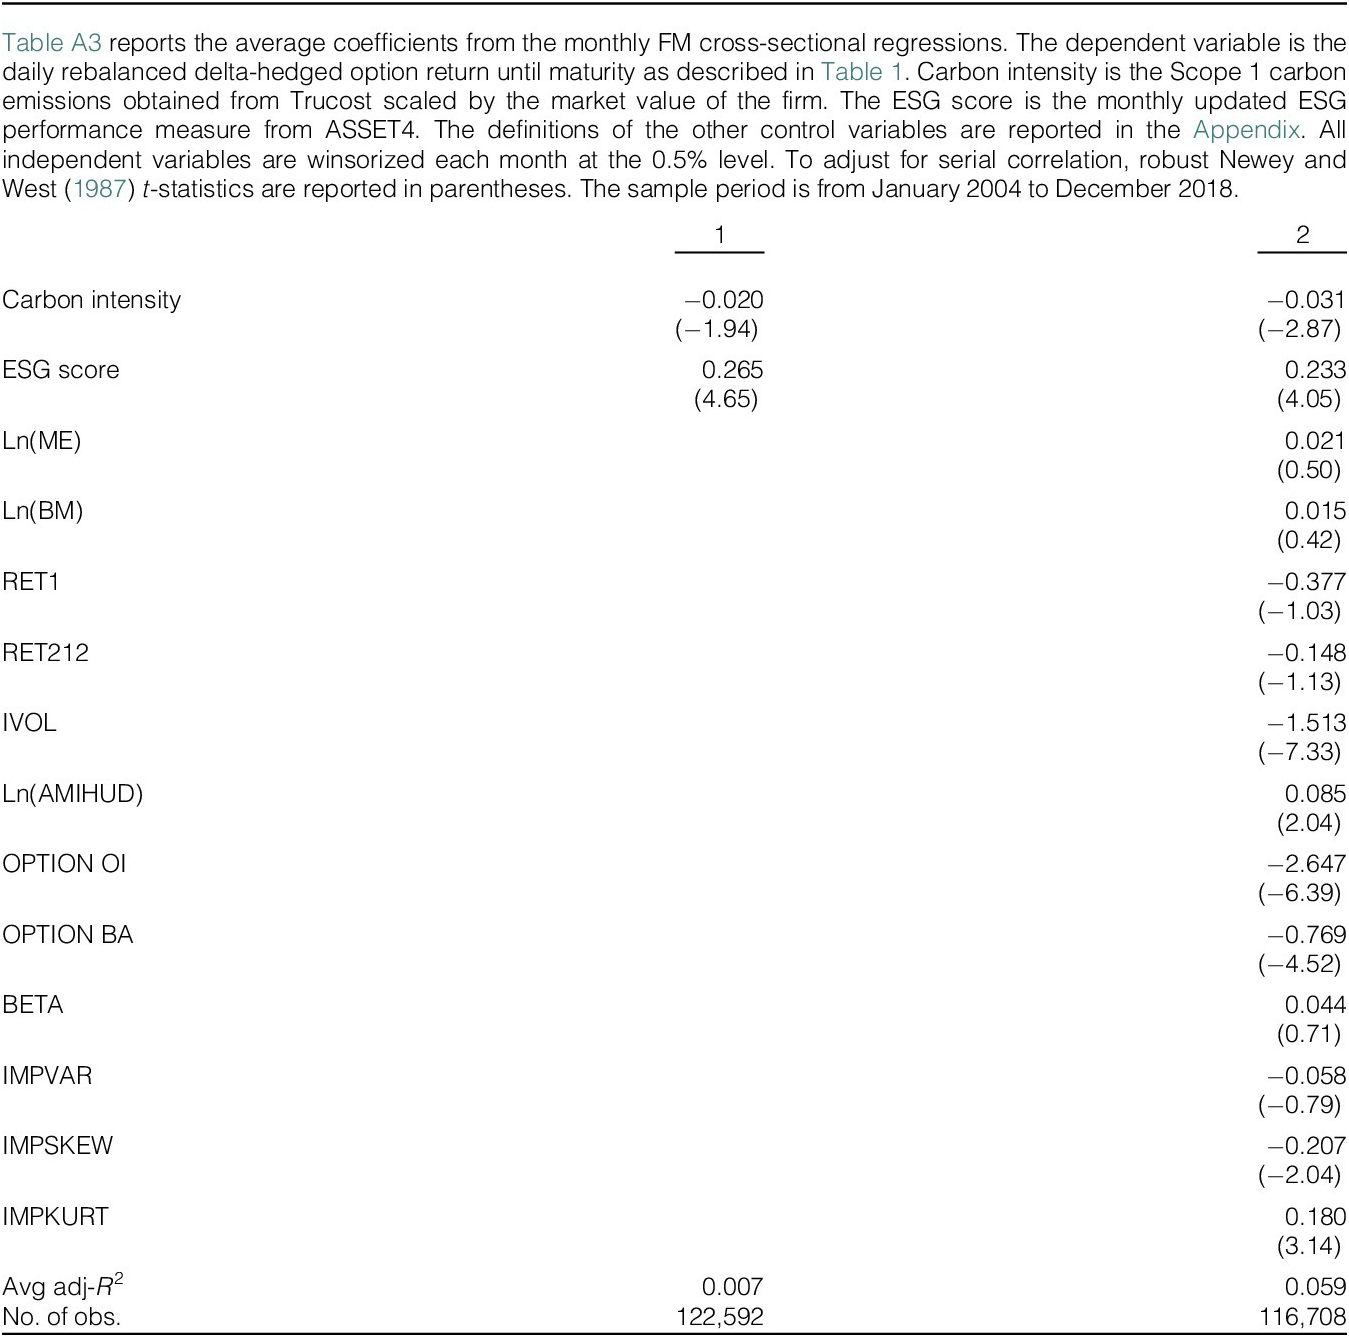
Finally, to disentangle the effect of climate risks from broader ESG risks, we run FM regressions of delta-hedged option returns on both ESG performance and carbon intensity. Carbon intensity is the Scope 1 carbon emissions obtained from Trucost scaled by the market value of the firm.Footnote 21 We report the results of regressions controlling for the carbon emission score in Table A3. Consistent with higher tail risks documented by Ilhan et al. (Reference Ilhan, Sautner and Vilkov2021), we find that firms with the more carbon-intensive business model have more negative delta-hedged option returns. However, when we control for carbon intensity, the ESG score still plays an important role. This evidence indicates that our results are not purely driven by the carbon emission intensity of the firm but also depend on other aspects of the ESG score.
B. Possible Endogeneity
ESG scores are likely to be correlated with other characteristics of the firm, which may also be important for option returns. Alternatively, firms may learn from option prices and adjust their ESG performance accordingly. To mitigate these endogeneity concerns, we use RepRisk, a news-based data provider, to identify sudden increases in ESG risk and investigate how the options market reacts to those shocks. RepRisk uses RepRisk Index (RRI) to estimate ESG risk. RepRisk screens over 90,000 public sources daily, including print and online media, government bodies, regulators, and other online sources. When there are material ESG risks, such as violations of international standards that can have reputational, compliance, and financial impacts on the company, RRI increases. We use the RRI trend, which is the difference in RRI between the current date and the 30 days before, to identify sudden increases in firms’ ESG risk.Footnote 22
Identification based on changes in RRI is not perfect because large jumps in RRI are due to severe ESG-related incidents, which are endogenous outcomes of firms’ operations and strategies. Nevertheless, the exact timing of such ESG risk incidents cannot be predicted. We use such exogenous variations over time as quasi-natural experiments and rely on multiple shocks to firms’ ESG risk to alleviate omitted variable concerns. In particular, for each treated stock (for which RRI increases), we identify control stocks via propensity score matching according to size, book-to-market ratio, reversal, momentum, and idiosyncratic volatility. We expect that the options of treated firms that experience a sudden increase in ESG risk will become more expensive (as indicated by a drop in the delta-hedged option return) compared with those of matched control firms after the events. The main specification of the DiD test is as follows:

where
$ {R}_{it+1} $
 is the delta-hedged option return,
$ TREATED $
 is an indicator variable that equals 1 for treated stocks and 0 for control firms, and
$ X $
 is the same control variables as in Table 7. The event window is from 5 months before the event to 6 months after the event.
$ POST $
 is an indicator variable that is equal to 1 after the events, and 0 otherwise. Because we have limited events each month, we rely on panel regressions instead of FM regressions. We add firm and time fixed effects and cluster standard errors by firm.
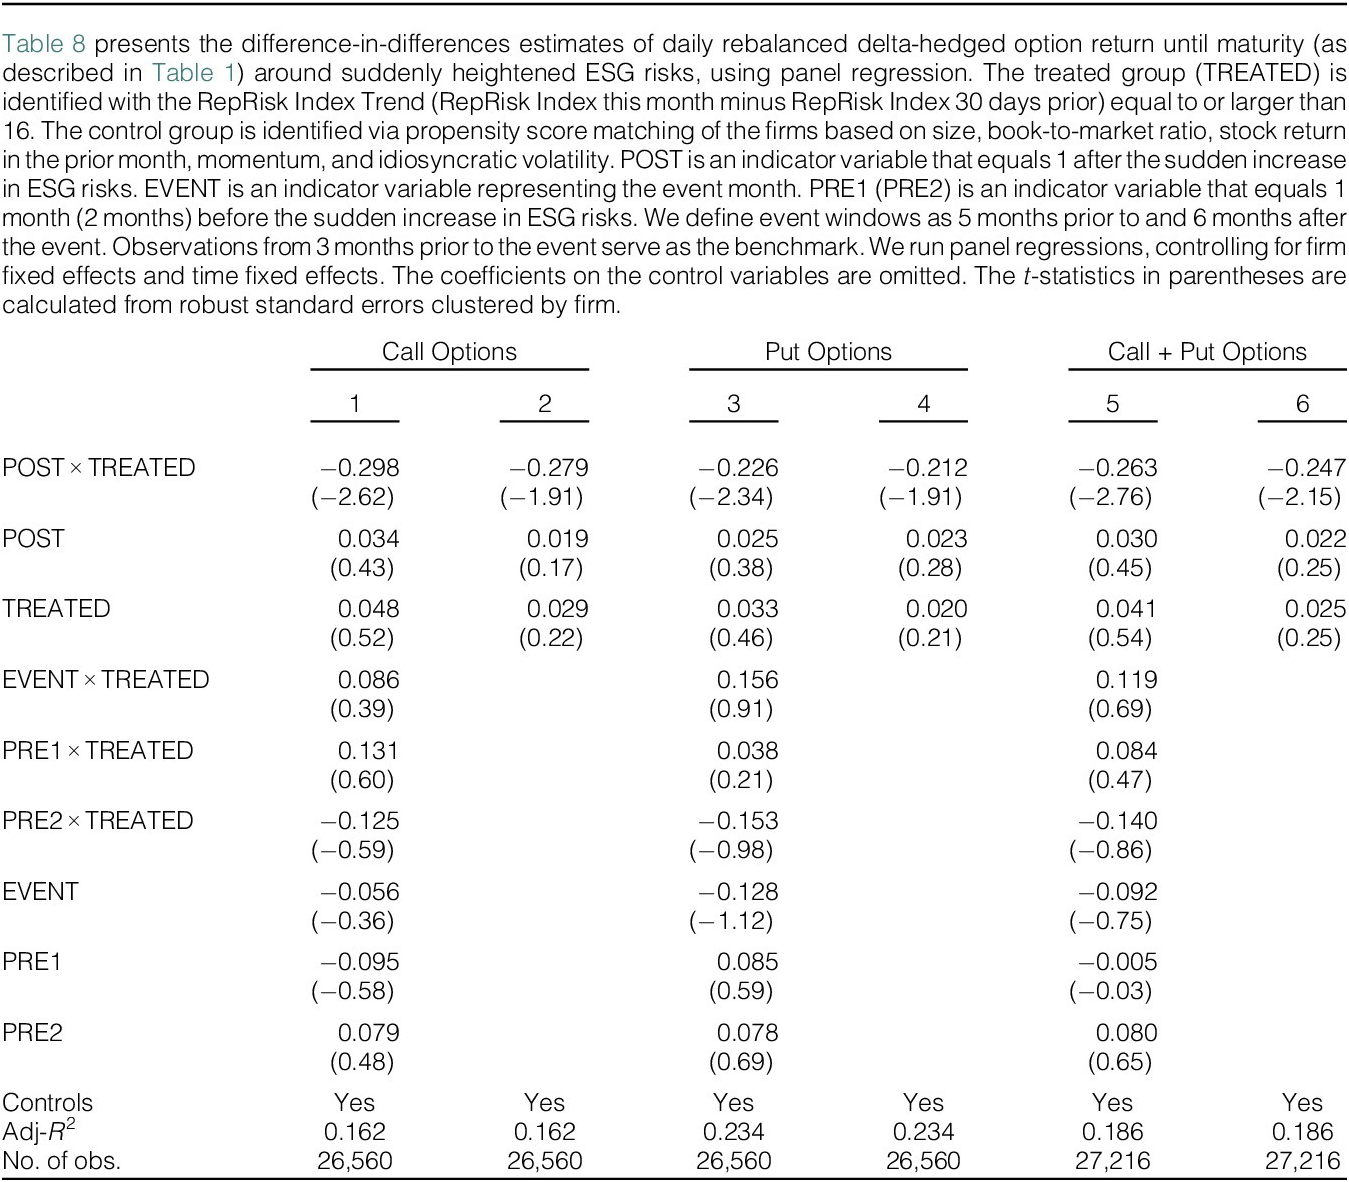
Table 8 shows the results. Column 1 shows that after a sudden increase in ESG risk, the call option returns of treated firms drop by 0. 295% compared to those of the control group. The results are very similar for put options in column 3 and call and put options combined in column 5.

TABLE 8 Long description
The table displays regression coefficients with t-statistics in parentheses.
Columns are grouped into three categories:
* Call Options (Models 1 and 2)
* Put Options (Models 3 and 4)
* Call plus Put Options (Models 5 and 6)
Key Row Variables and Coefficients:
* P O S T times T R E A T E D: Shows negative coefficients across all models. Model 1: -0.298 (-2.62). Model 2: -0.279 (-1.91). Model 3: -0.226 (-2.34). Model 4: -0.212 (-1.91). Model 5: -0.263 (-2.76). Model 6: -0.247 (-2.15).
* P O S T: Coefficients range from 0.019 to 0.034, all with t-statistics below 0.50.
* T R E A T E D: Coefficients range from 0.020 to 0.048, all with t-statistics below 0.55.
* E V E N T times T R E A T E D: Model 1: 0.086 (0.39). Model 3: 0.156 (0.91). Model 5: 0.119 (0.69).
* P R E 1 times T R E A T E D: Model 1: 0.131 (0.60). Model 3: 0.038 (0.21). Model 5: 0.084 (0.47).
* P R E 2 times T R E A T E D: Model 1: -0.125 (-0.59). Model 3: -0.153 (-0.98). Model 5: -0.140 (-0.86).
* E V E N T: Model 1: -0.056 (-0.36). Model 3: -0.128 (-1.12). Model 5: -0.092 (-0.75).
* P R E 1: Model 1: -0.095 (-0.58). Model 3: 0.085 (0.59). Model 5: -0.005 (-0.03).
* P R E 2: Model 1: 0.079 (0.48). Model 3: 0.078 (0.69). Model 5: 0.080 (0.65).
Model Statistics:
* Controls: Yes for all models.
* Adjusted R-squared: 0.162 for Call Options, 0.234 for Put Options, and 0.186 for Call plus Put Options.
* Number of observations: 26,560 for Call and Put models; 27,216 for Call plus Put models.
To validate the robustness of our DiD matching model, we present evidence of parallel trends in columns 2, 4, and 6, corresponding to call options, put options, and a combined analysis of call and put options, respectively. Specifically, we construct a series of relative-time indicators for the months leading up to the sudden increase in ESG risks: EVENT represents the event month, while PRE1 and PRE2 denote 1 and 2 months before the event, respectively. Observations from 3 months prior to the event serve as the benchmark. The results indicate no significant pretrend before the event, further supporting the exogeneity of the shocks.
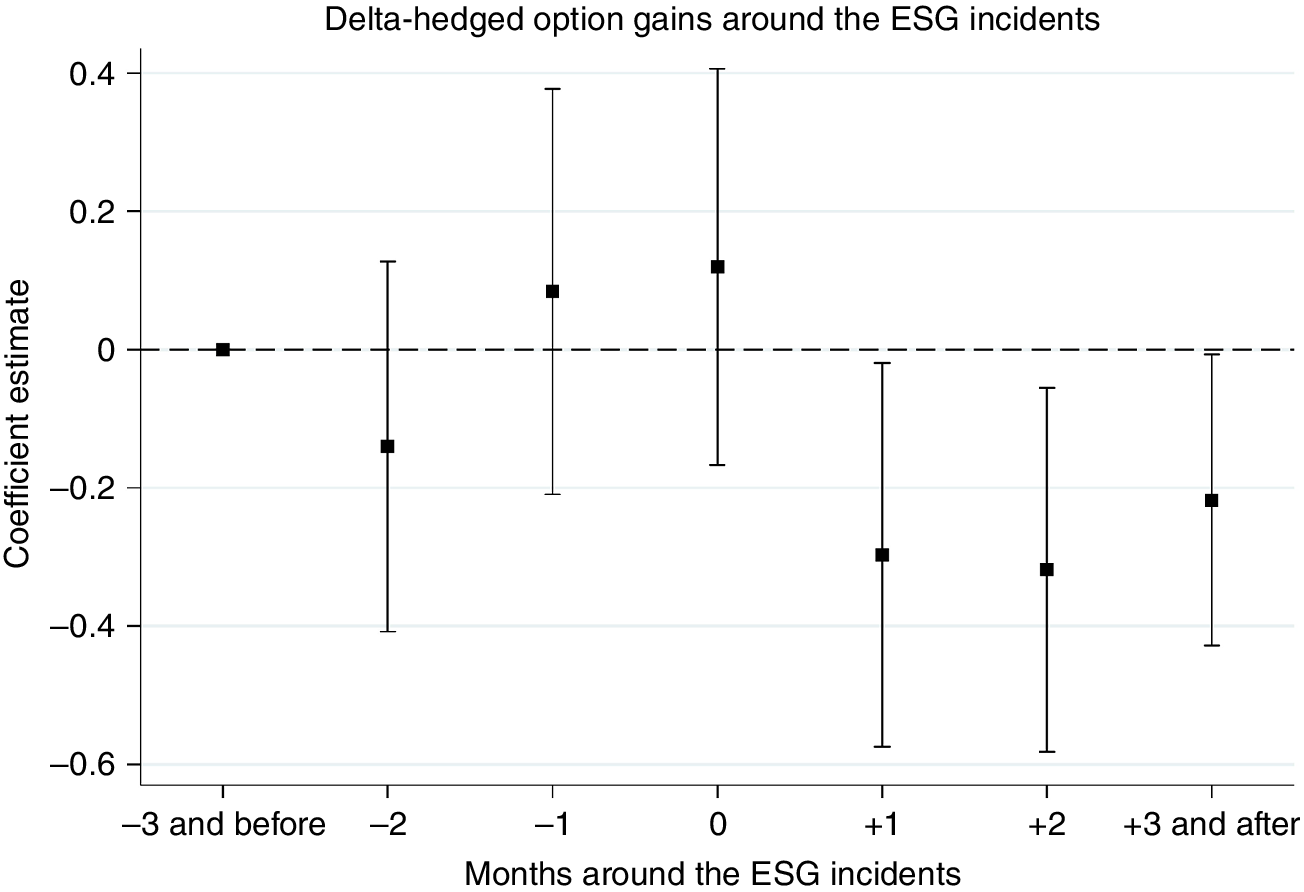
We plot the point estimates and their 90% confidence intervals for the coefficients in Figure 1. This figure shows that the coefficient estimates for the relative-time indicators prior to the sudden increase in ESG risks are not statistically significant at the 10% level. This finding further confirms that our DiD matching model satisfies the parallel trends assumption.
Figure 1 plots the regression coefficient estimates of DiD analysis about the impact of sudden increase in ESG risks on delta-hedged option returns. The event window is from 5 months before the event to 6 months after the event. We construct a series of relative-time indicators for the months around sudden increase in ESG risks:
$ t=0 $
 represents the event month, and
$ t=-1 $
 and
$ -2 $
 denote 1 and 2 months before the event, respectively.
$ t=+1,+2, $
 and +3 denote 1, 2, and 3 months after the event, respectively. Observations from 3 months prior to the event serve as the benchmark. All regressions control for year and firm fixed effects. For each coefficient estimate, we plot the point estimate in dark squares and the 90% confidence interval in vertical lines clustered at the firm level.

FIGURE 1 Long description
A line graph titled Delta-hedged option gains around the E S G incidents.
* The horizontal X-axis is labeled Months around the E S G incidents, with markers at -3 and before, -2, -1, 0, +1, +2, and +3 and after.
* The vertical Y-axis is labeled Coefficient estimate, ranging from -0.6 to 0.4 in increments of 0.2.
* A horizontal dashed reference line is set at 0 on the Y-axis.
Data flow from left to right:
* At -3 and before: The point estimate is exactly on the zero line with no visible error bar.
* At -2: The point estimate drops to approximately -0.15 with a wide vertical confidence interval spanning from -0.4 to 0.1.
* At -1: The point estimate rises to approximately 0.08 with a confidence interval from -0.2 to 0.38.
* At 0 (the event month): The point estimate is at its peak of approximately 0.12 with a confidence interval from -0.18 to 0.4.
* At +1: There is a sharp drop to a point estimate of -0.3 with a confidence interval from -0.58 to -0.02.
* At +2: The point estimate remains low at approximately -0.32 with a confidence interval from -0.58 to -0.05.
* At +3 and after: The point estimate recovers slightly to -0.22 with a confidence interval from -0.42 to 0.
To the extent that our propensity matching provides adequate control firms, our DiD analysis suggests that the relation between returns and ESG scores is not confounded by omitted variables. However, we acknowledge that we do not have a cleaner exogenous shock to rule out all sources of endogeneity. Therefore, we take the evidence from this subsection only as suggestive causal evidence.
C. Alternative ESG Data Providers
Given the complexity of measuring ESG information, the ESG ratings of different providers can differ substantially. The validity of these ratings has been debated critically (Eccles and Stroehle (Reference Eccles and Stroehle2020), Gibson, Krueger, and Schmidt (Reference Gibson, Krueger and Schmidt2021), Berg, Koelbel, and Rigobon (Reference Berg, Koelbel and Rigobon2022), Christensen, Serafeim, and Sikochi (Reference Christensen, Serafeim and Sikochi2022), and Berg et al. (Reference Berg, Koelbel, Pavlova and Rigobon2024)). For example, Berg et al. (Reference Berg, Koelbel and Rigobon2022) find that the correlation between the ESG ratings of six rating providers is quite weak. They decompose the divergence into contributions of scope, measurement, and weights, where measurement contributes most of the divergence. Their results indicate that research conclusions (including ours) are potentially dependent on the choice of rating providers.
In this subsection, we perform three robustness tests to mitigate the concern that our empirical results are only significant based on the ESG data from a particular provider. We use ESG data from four alternative ESG rating providers: KLD, MSCI, Sustainalytics, and RepRisk. i) KLD scores measure firm-level social performance, including community relations, product characteristics, environmental impact, employee relations, workforce diversity, and corporate governance, which covers both the social benefits and harms of a firm.Footnote 23 ii) MSCI ESG rating identifies both ESG risks and opportunities that are most material to an industry. Within each industry, MSCI identifies industry leaders and laggards according to their exposure to ESG risks and how well they manage those risks relative to their peers and then assigns ratings accordingly. iii) Sustainalytics identifies key ESG issues for different industry peer groups based on an analysis of the peer group and its broader value chain, a review of companies’ business models, and key activities associated with environmental and/or social impacts. It collects data via corporate disclosure, media, and NGO reporting to analyze ESG information according to key ESG issues and assigns scores accordingly. iv) RepRisk is a news-based data provider. It screens over 90,000 public sources each day, including print and online media, government bodies, regulators, and other online sources. When there are material ESG risks, such as violations of international standards that can have reputational, compliance, and financial impacts on the company, the RepRisk index increases.
All ratings are organized such that the higher the scores, the better the ESG performance (we invert the signs of the RepRisk scores, which are designed to measure risks). We include KLD because it is the data set that has been used most frequently in academic studies. We include RepRisk because it relies mainly on news and media reporting, which has markedly different information compared with other raters that rely on a blend of data sources (Berg et al. (Reference Berg, Koelbel, Pavlova and Rigobon2024)). ASSET4, MSCI, and Sustainalytics are widely recognized and used by sustainable finance professionals.Footnote 24
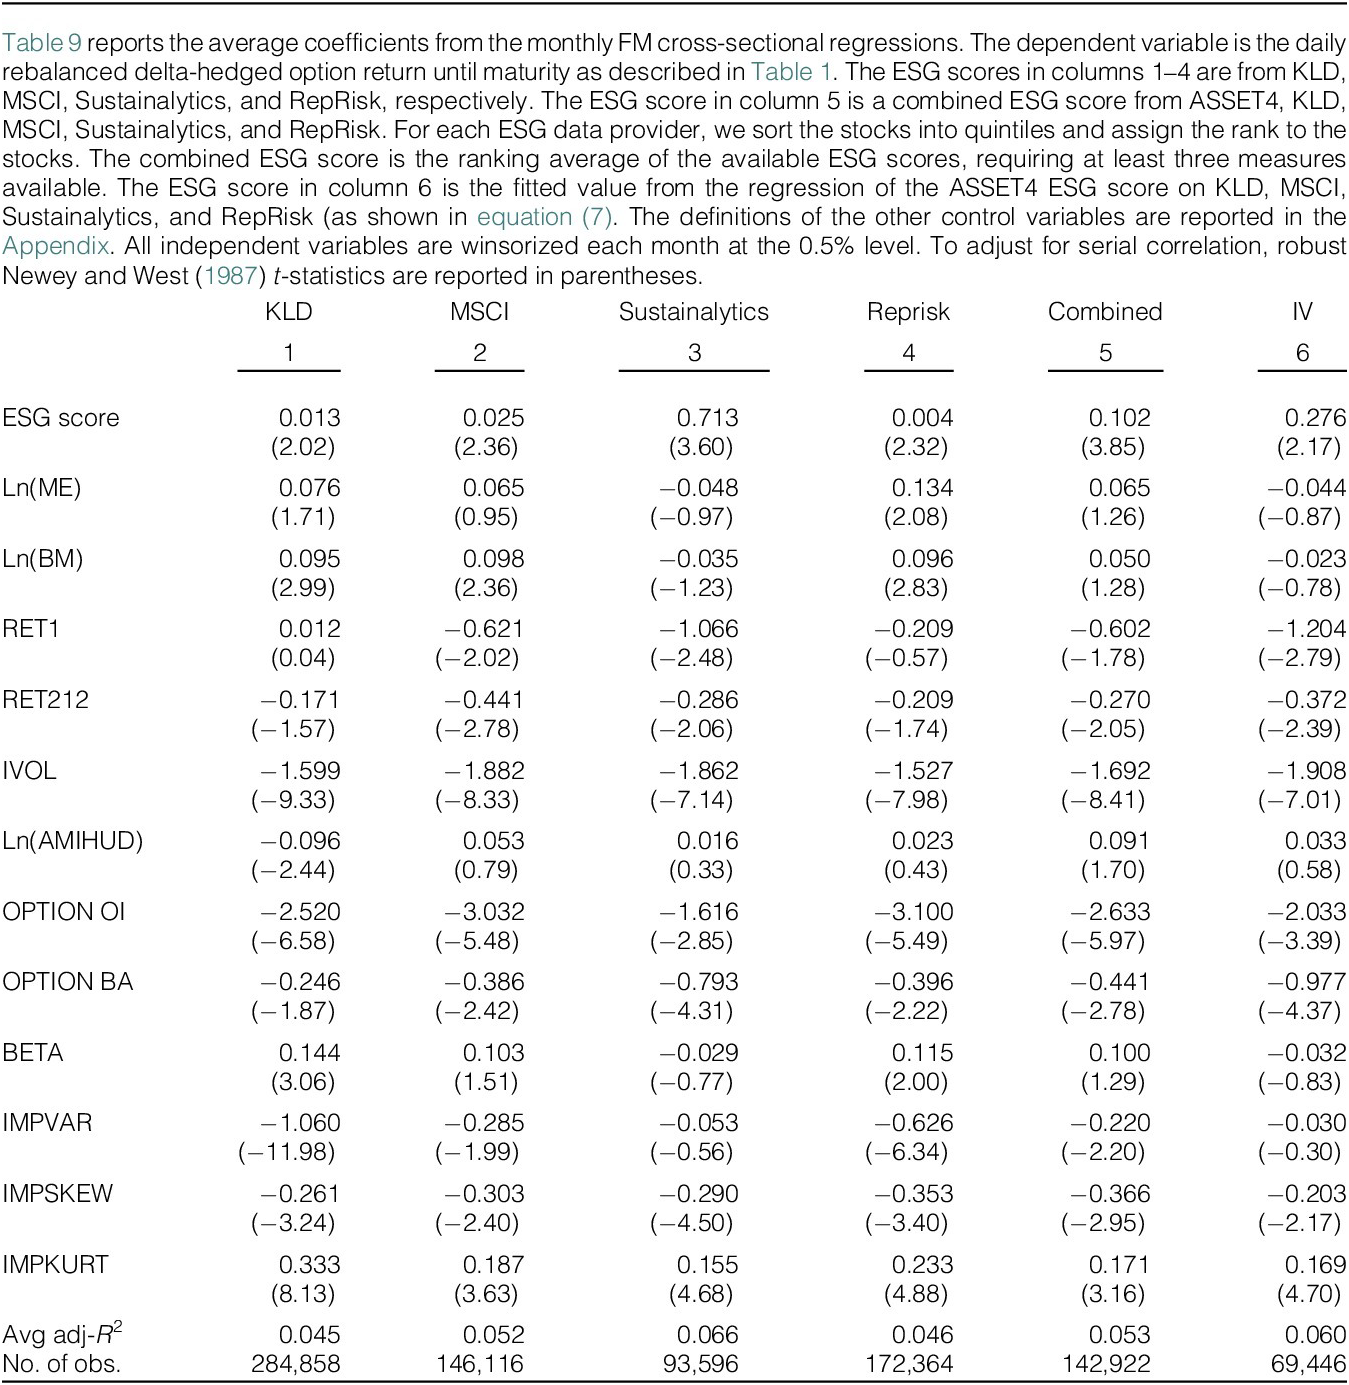
We first repeat our baseline FM regression for call and put options together using four alternative ESG data sets. The results are reported in columns 1–4 of Table 9 for call and put options together. To save space, we only report the results with all the controls used in Table 7. We find that the coefficient on the ESG score is significant for the four alternative ESG data sets. Options with higher KLD scores, MSCI scores, Sustainalytics scores, and RepRisk scores have higher delta-hedged option returns. These results demonstrate that our results are not overly dependent on the choice of ESG rating providers.

TABLE 9 Long description
The table presents average coefficients from monthly F M cross-sectional regressions.
Columns are numbered 1 through 6:
1. K L D
2. M S C I
3. Sustainalytics
4. RepRisk
5. Combined
6. I V
Key data rows include:
* E S G score: Coefficients range from 0.004 (RepRisk) to 0.713 (Sustainalytics). All models show positive coefficients with t-statistics in parentheses ranging from 2.02 to 3.85.
* L n (M E): Coefficients are 0.076, 0.065, minus 0.048, 0.134, 0.065, and minus 0.044.
* L n (B M): Coefficients are 0.095, 0.098, minus 0.035, 0.096, 0.050, and minus 0.023.
* R E T 1: Coefficients are 0.012, minus 0.621, minus 1.066, minus 0.209, minus 0.602, and minus 1.204.
* I V O L: Shows strong negative correlation across all columns, ranging from minus 1.527 to minus 1.908, with t-statistics between minus 7.01 and minus 9.33.
* O P T I O N O I: Negative coefficients across all columns, ranging from minus 1.616 to minus 3.100.
* I M P V A R: Negative coefficients across all columns, with the strongest in K L D at minus 1.060 (t-stat minus 11.98).
* I M P K U R T: Positive coefficients across all columns, ranging from 0.155 to 0.333.
Bottom rows:
* Average adjusted R-squared: Values range from 0.045 to 0.066.
* Number of observations: Ranges from 69,446 (I V) to 284,858 (K L D).
An ESG score from a single rater has limited information and might be noisy. Therefore, our second robustness test is to construct a combined ESG score using a simple average of available ESG scores for a particular stock. Specifically, for each ESG data provider, we sort all of the stocks into deciles according to that ESG score and assign the rank to each stock. Then, we define the combined ESG score as the average of the rankings, requiring there to be at least three ESG ratings available for a particular stock. This approach aggregates ESG information from different data providers while maintaining a reasonably large sample. Using this combined ESG score, we show the results in column 5 of Table 9. Options with higher combined ESG scores have significantly higher delta-hedged option returns.
Following Berg et al. (Reference Berg, Koelbel, Pavlova and Rigobon2024), we use a noise-correction procedure as our third robustness test, in which we instrument ASSET4 ESG scores with ratings from other ESG rating agencies, as in the classical errors-in-variables problem. Specifically, we use two-stage least squares regression to tackle the measurement error problem in ESG scores. The first-stage regression uses the ESG scores of the four alternative data providers as instruments for the ASSET4 ESG score and includes the same controls as in Table 7:

We run the aforementioned regression each month, where
$ ASSET{4}_{it} $
 is the ASSET4 ESG score for stock
$ i $
 in period
$ t $
 . We denote
$ {\hat{ASSET4}}_{it} $
 be the fitted value from estimating equation (7). Then, we run the second-stage regression using the standard FM regression. Column 6 in Table 9 shows the results for the combined call and put options. After correction of the ASSET4 ESG score using other ESG data providers, our results are still significant for both call and put options.
Taken together, these results indicate that our findings are not purely driven by a particular ESG data provider and are robust to alternative ESG data sources, although they may be noisy and contain different ESG information.
D. Robustness Tests
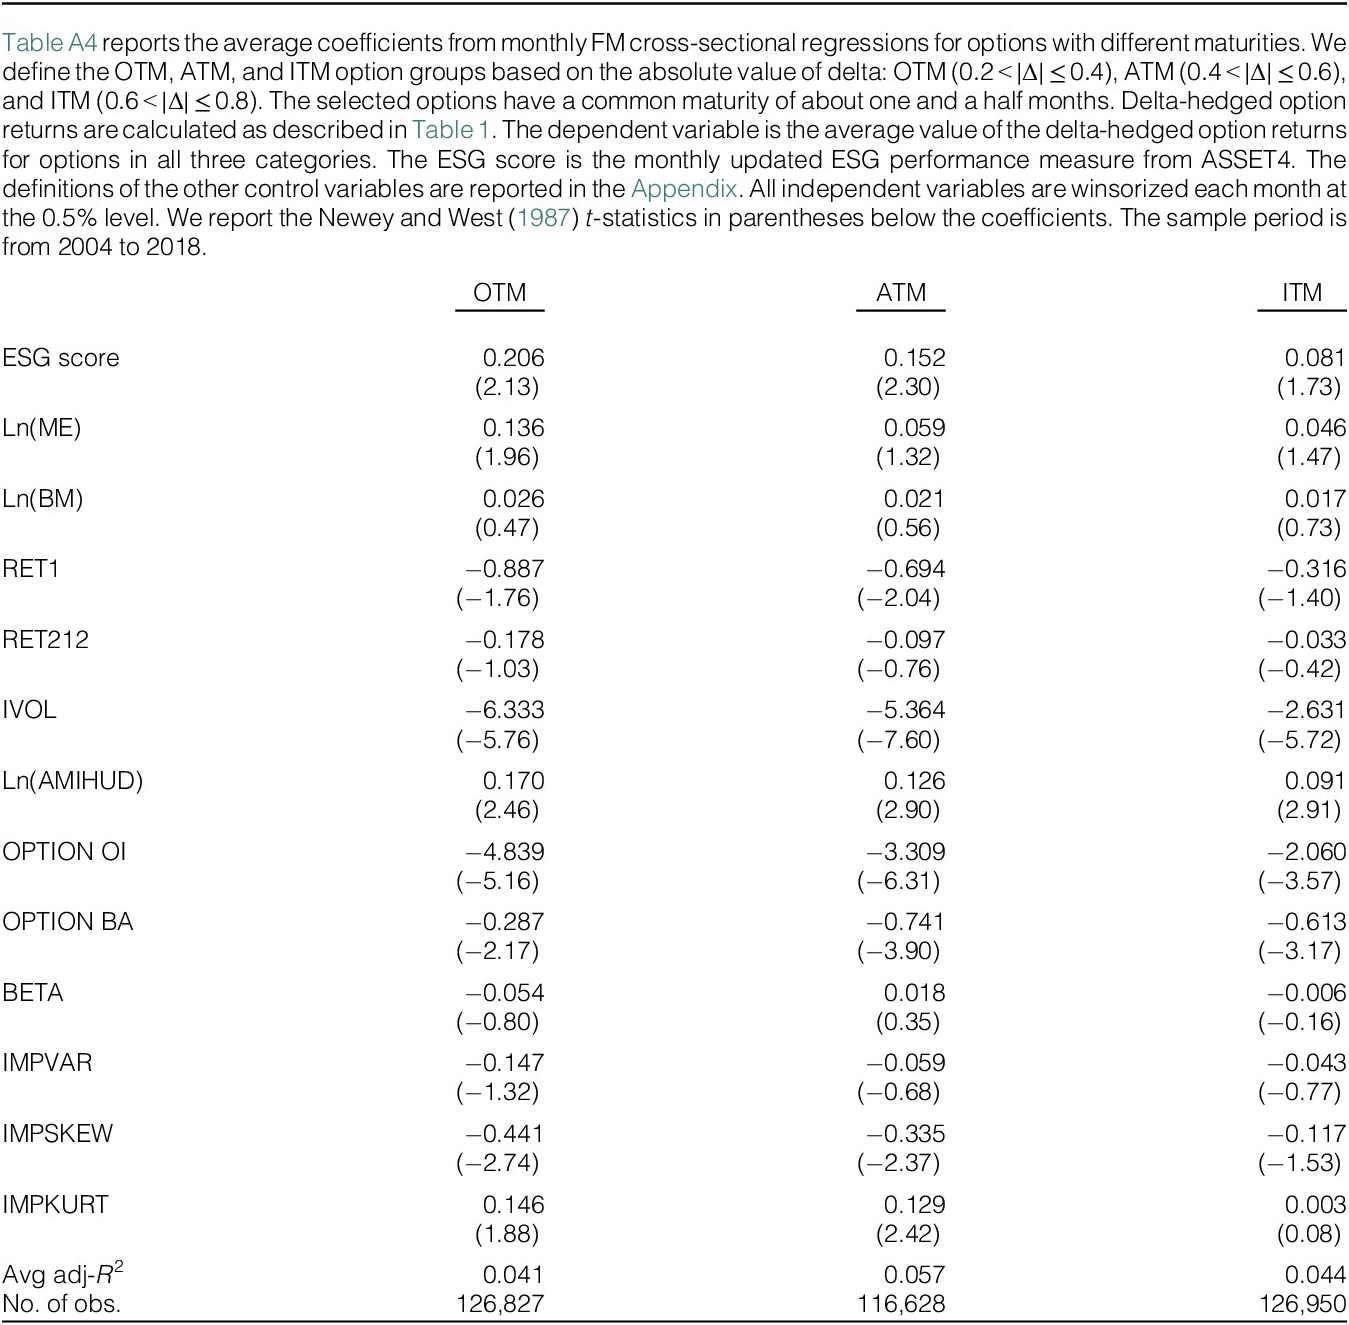
Our main results are based on ATM options. To explore the effect of ESG performance on options with different levels of moneyness, we define out-of-the-money (OTM) and in-the-money (ITM) options based on the absolute value of delta. Options with an absolute delta value ranging from 0.2 to 0.4, 0.4 to 0.6, and 0.6 to 0.8 are classified into the OTM, ATM, and ITM option groups, respectively. We restrict options to have the same maturity as in our main tests, about 50 days. Next, we calculate the average value of the delta-hedged returns for all of the options in these three categories. FM regressions of delta-hedged returns on ESG performance and other controls are reported in Table A4.Footnote 25 The effect of ESG on option returns is significant across the three moneyness groups. We observe the largest economic magnitude for the coefficient of ESG performance on OTM option returns, which is consistent with the argument that ESG is relevant to downside risks because OTM options are usually used to hedge downside risks.
We focus on short-term options because they are traded more frequently and with lower effective transaction costs than long-term derivatives. Therefore, their prices adjust more quickly to changes in perceived uncertainty and risks (Cont and Tankov (Reference Cont and Tankov2004), Ilhan et al. (Reference Ilhan, Sautner and Vilkov2021)). To investigate how our results might be affected by the maturity options, we also examine the longer-term options that are relatively liquid as a robustness check. Specifically, we define options with maturity between 90 days and 180 days (180–360 days) as medium-term (long-term) options. For each stock at the end of each month, we calculate the average delta-hedged option returns of all mid- and long-term options separately. To mitigate the impact of liquid long-term options, we remove options with bid–ask spreads greater than 50%. We then explore the relationship between the delta-hedged option returns of the mid- and long-term options and ESG performance. In unreported results, we find that the ESG premium also exists in longer-term options with maturities between 90 days and 360 days that are relatively liquid.
We also perform a placebo test. ESG investing has become increasingly important for investors only in the last two decades. We posit that prior to 2004, ESG investing influenced only a relatively small part of the investment industry, and thus, its impact on the options market should be much less significant. We conduct two tests of this conjecture. First, we backfill ASSET4 ESG data from 2004 to the period from 1996 to 2003, as ASSET4 ESG data are not available for the earlier sample period. We find that ESG does not have a significant impact on delta-hedged option returns in this earlier sample period. Second, we use the KLD data from 1996 to 2003 to repeat the placebo test, and we again find insignificant results. These results support our conjecture that the significant impact of ESG on option pricing in the 2004–2018 period is related to the growing (perceived) risks associated with ESG issues.
E. ESG Performance and Different Risk Measures
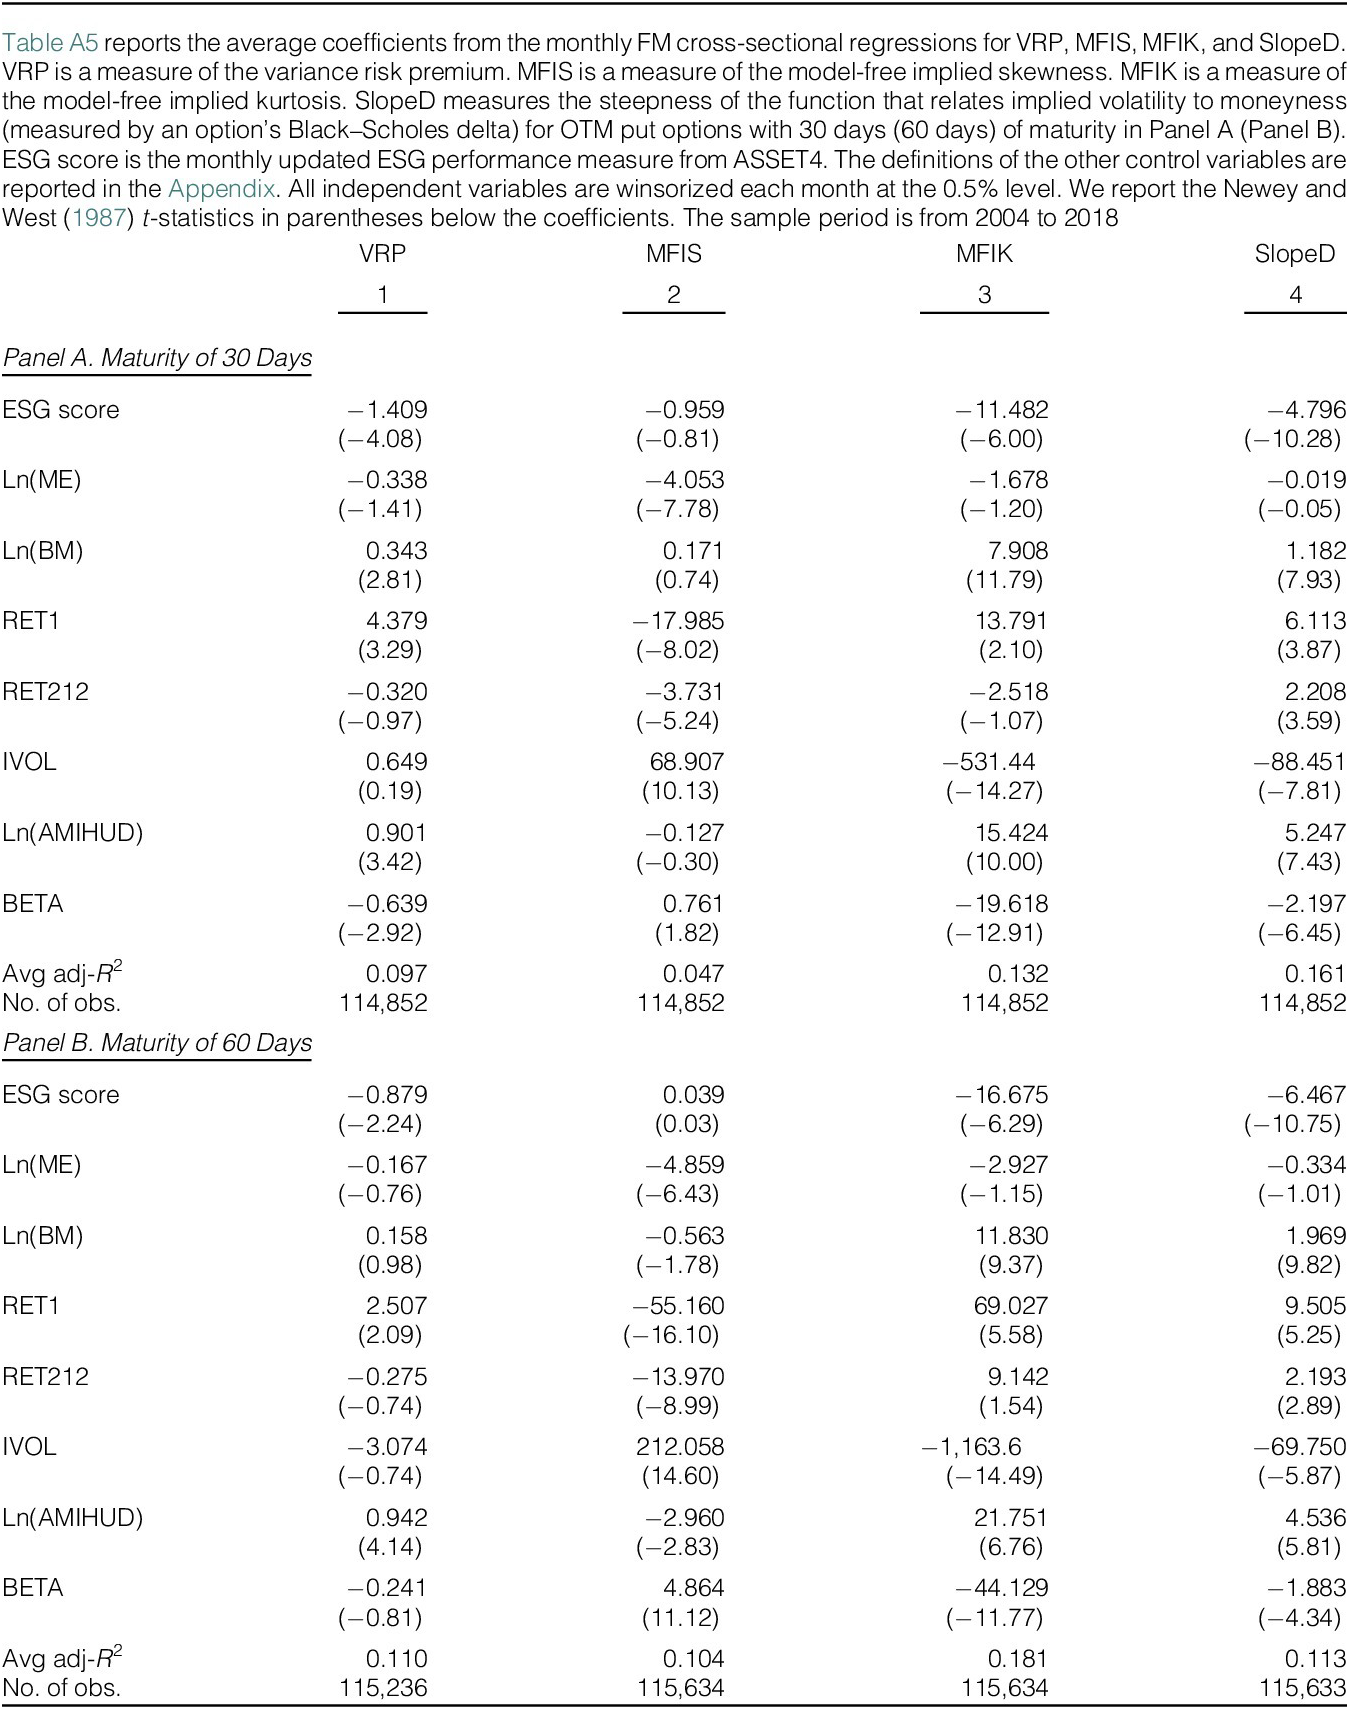
In this subsection, we provide further evidence on how ESG performance is related to different option-implied risks. Following Ilhan et al. (Reference Ilhan, Sautner and Vilkov2021), we use four measures of risks implied by option prices, including VRP, MFIS, MFIK, and SlopeD.
VRP is computed as the difference between the risk-neutral expected variance and the realized variance (Bollerslev, Tauchen, and Zhou (Reference Bollerslev, Tauchen and Zhou2009), Carr and Wu (Reference Carr and Wu2009)). As a proxy for the risk-neutral expected variance, we use the model-free implied variance
$ {MFIV}_{t,t+\tau } $
 computed on day
$ t $
 for the period
$ \tau $
 . The realized variance
$ \left({RV}_{t,t+\tau}\right) $
 is computed from daily log returns over a future window from
$ t $
 to
$ t+\tau $
 , that is, with a length corresponding to the period of the options used for the risk-neutral variance. Following Ilhan et al. (Reference Ilhan, Sautner and Vilkov2021) and Kelly et al. (Reference Kelly, Pástor and Veronesi2016), the variance risk premium
$ {VRP}_{t,t+\tau } $
 for period
$ t $
 to
$ t+\tau $
 is computed in the ex post version on each day
$ t $
 as
$ \left({MFIV}_{t,t+\tau }-{RV}_{t,t+\tau}\right) $
 and expressed in annual terms. It captures the cost of protection against general uncertainty-related volatility changes in downward and upward directions. MFIS and MFIK are constructed following Bakshi, Kapadia, and Madan (Reference Bakshi, Kapadia and Madan2003) and quantify the asymmetry of the risk-neutral distribution and heaviness of the tail in the risk-neutral distribution, respectively. By being normalized, MFIS and MFIK provide information about the expensiveness of protection against left-tail events and extreme events. We follow Kelly et al. (Reference Kelly, Pástor and Veronesi2016) and Ilhan et al. (Reference Ilhan, Sautner and Vilkov2021) to calculate SlopeD. Specifically, SlopeD is the slope coefficient from regressing the implied volatilities of OTM puts (deltas between −0.5 and −0.1) on the corresponding deltas and a constant. A greater positive value of SlopeD indicates that deeper OTM puts are relatively more expensive, suggesting a relatively higher cost of protection against downside tail risks.
We then investigate how ESG performance is related to these risks implied from the options market, and we report the results in Table A5. VRP, MFIK, and SlopeD are negatively related to ESG performance, significant at the 1% level. The results indicate that the options of low-ESG firms have higher costs of protection against uncertainty-related volatility changes, jump risks, and downside tail risks. We do not find significant results for MFIS, which captures information about the expensiveness of protection against left-tail events relative to right-tail events. One possibility is that the options of low-ESG firms may also have upside jump opportunities (Cohen, Gurun, and Nguyen (Reference Cohen, Gurun and Nguyen2026)).
V. Additional Cross-Sectional Results
Thus far, we have documented that the ESG scores of the underlying firms affect the cross section of option returns and that there is a significant ESG premium in the options market. In this section, we further explore heterogeneity between firms and investigate the impact of ESG conditional on different industries, product competition intensity, investors’ awareness, and corporate hedging activity. We focus on the sample that contains call and put options together.
A. Different Business Models
The proximity to end-consumers potentially influences the impacts of ESG on the firm and on investors’ perceptions. The intuition is that private end consumers or individuals show more social concern in their consumption. End consumers could simply choose not to buy the products if the firm has poor ESG performance. Such firms, therefore, face greater uncertainty when their ESG performance is poorer. Baron et al. (Reference Baron, Harjoto and Jo2011) and Curcio and Wolf (Reference Curcio and Wolf1996) find that there is a stronger impact of social performance on firms’ financial performance in industries serving end consumers than in other industries. Lev, Petrovits, and Radhakrishnan (Reference Lev, Petrovits and Radhakrishnan2010) also find that charitable contributions lead to significant sales growth only in consumer industries.
Following these studies, we hypothesize that the impact of ESG scores on delta-hedged option returns is stronger for firms that are closer to end consumers. To test this hypothesis, we follow Lev et al. (Reference Lev, Petrovits and Radhakrishnan2010) in using 4-digit SIC industry codes and classifying our sample firms into two groups based on their proximity to end consumers. We provide details of the classification in the Appendix, Variable Definitions. We then test whether the effect of social performance on option returns differs between these two groups via FM regressions of delta-hedged option returns.
Panel A of Table 10 reports the regression results. CONSUMER is an indicator variable that equals 1 if a firm is in industries classified as closer to end consumers, and 0 otherwise. Our focus is on the interaction term CONSUMER
$ \times $
 (ESG score), which captures the incremental impact of ESG performance on option returns for firms that are closer to consumers. We include the same control variables as those in Table 7 (column 6) but do not report them in Table 10 to avoid clutter. The estimated coefficient on the interaction term is positive and statistically significant at the 1% level. Our results indicate that among firms that are closer to end consumers, the social performance of the firm has a larger impact on the cross section of option returns in the sense that options on low-ESG firms, which are closer to end consumers, are relatively more expensive than options on high-ESG firms, which are farther from end consumers.

TABLE 10 Long description
The table is divided into three vertical panels.
Panel A, Product Market, contains two columns. Column 1 shows the interaction of C O N S U M E R and E S G score with a coefficient of 0.250 (t-stat 2.24) and C O N S U M E R at -0.254 (t-stat -2.71). Column 2 shows the interaction of F L U I D I T Y and E S G score at 0.051 (t-stat 2.91) and F L U I D I T Y at -0.046 (t-stat -3.75). The E S G score alone is 0.083 in column 1 and -0.196 in column 2.
Panel B, Attention to E S G, contains two columns. Column 1 shows the interaction of B L U E and E S G score at 0.259 (t-stat 2.10) and B L U E at -0.199 (t-stat -2.13). Column 2 shows the interaction of C O N F E N V and E S G score at 0.019 (t-stat 1.95) and C O N F E N V at -0.018 (t-stat -2.45). The E S G score alone is -0.020 in column 1 and 0.113 in column 2.
Panel C, Firms’ Hedging Activity, contains one column. It shows the interaction of H E D G E R and E S G score at -0.390 (t-stat -3.37), H E D G E R at 0.288 (t-stat 3.21), and E S G score at 0.336 (t-stat 4.09).
All panels include controls, average adjusted R-squared values ranging from 0.054 to 0.057, and observation counts between 119,486 and 127,440.
In addition to proximity to end-consumers, product/service differentiation can also influence our documented relationship between ESG scores and option returns. ESG performance is one strategy for firms to differentiate themselves from their competitors (McWilliams and Siegel (Reference McWilliams and Siegel2001), Chih, Chih, and Chen (Reference Chih, Chih and Chen2010), and Cao, Liang, and Zhan (Reference Cao, Liang and Zhan2019)). By investing in corporate social goods and differentiating itself from others, a firm can benefit from higher profit margins and lower risk (Albuquerque et al. (Reference Albuquerque, Koskinen and Zhang2019)). Such benefits are particularly important for firms operating in competitive industries, as they are more vulnerable to potential risks in the future than firms in concentrated industries. We, therefore, conjecture that when firms face more severe product competition, social performance will have a greater impact on perceived uncertainty and on option pricing.
We use product market fluidity (Hoberg, Phillips, and Prabhala (Reference Hoberg, Phillips and Prabhala2014)) as a proxy for product market competition. This measure assesses the degree of competitive threat and product market change surrounding a firm using computational linguistics and analyzing individual firm business descriptions from 10-Ks. A higher FLUIDITY measure indicates more intense competition from peers offering similar products. Column 2 in Panel A of Table 10 reports the results of the FM regressions for delta-hedged returns. The coefficient of interest is the interaction term FLUIDITY
$ \times $
 (ESG score). We find that this coefficient is positive and statistically significant at the 5% level. Consistent with the product market competition and product differentiation argument, we find that the impact of ESG performance on option pricing is stronger for firms facing heightened competition. In summary, the results in Panel A of Table 10 indicate that the influence of ESG performance on perceived uncertainty and option pricing depends on the nature of a firm’s business and its competitive landscape.
B. Cross-Sectional Variation in ESG Attention
Evidence suggests that Democratic-leaning voters care more about CSR than Republican-leaning voters. For example, Di Giuli and Kostovetsky (Reference Di Giuli and Kostovetsky2014) find that firms headquartered in Democratic-leaning states are more likely to spend resources on CSR. Gromet, Kunreuther, and Larrick (Reference Gromet, Kunreuther and Larrick2013) demonstrate that more politically conservative individuals are less in favor of investment in energy-efficient technology than those who are more politically liberal (see also Costa and Kahn (Reference Costa and Kahn2013)). When the electorate is more Democratic, companies may be more susceptible to pressure from activists to adopt CSR policies (Baron (Reference Baron2001)). We use the political affiliation of the state where the company is headquartered as a proxy for ESG attention.
Specifically, we divide all states into two groups based on whether the Democratic candidates won the state in the most recent presidential election. We then construct an indicator variable BLUE that equals 1 for the firms headquartered in these states if voters predominantly chose the Democratic candidate (referred to as “blue states”) and 0 for firms headquartered in other states. We include BLUE and the interaction term BLUE
$ \times $
 (ESG Score) in FM regressions to investigate whether the effect of the ESG score on option pricing differs across firms that are subject to different levels of ESG awareness due to the political leanings of different states. Panel B of Table 10, column 1, shows the results. As expected, we find that the interaction term is positive and statistically significant at the 5% level for calls. This evidence suggests that when firms are headquartered in Democratic-leaning states, their option pricing is more influenced by their ESG performance than those in Republican-leaning states.
Our second proxy for firm-level variation in ESG attention is proposed by Hassan et al. (Reference Hassan, Hollander, van Lent and Tahoun2019).Footnote 26 They textually analyze quarterly earnings conference calls and measure the portion of content devoted to environment-related political topics as CONFENV. Some firms with poor ESG performance may attract more attention from investors during conference calls, and one may think of this as an alternative measure of ESG performance. However, firms with good ESG performance may also draw more attention if there is ESG-related news. Empirically, we find that the correlation between CONFENV and ESG score is only −0.02. We run FM regressions of the delta-hedged option return on CONFENV and its interaction with the ESG score. Panel B of Table 10, column 2, shows that the coefficients on the interaction term are positive and statistically significant. These results suggest that when investors and firms discuss ESG-related topics more during conference calls, the effect of ESG performance on option pricing becomes stronger, as investors pay more attention to these issues and are willing to pay a higher premium to hedge against heightened perceived uncertainties.
C. Corporate Hedging Activities
Next, we examine whether corporate hedging policy reduces the effect of ESG performance on option pricing. Firms can actively manage risks related to various dimensions, such as interest rates, foreign exchange, and operations. Risks from poor ESG performance may mainly be related to firm operations, such as potential lawsuits and loss of revenue. Specific hedging policies for such risks are not readily available. However, one can infer a firm’s ability to manage ESG risk from other hedging policies. For example, if a firm is concerned about financial risk and hedges such risk using derivatives, we conjecture that such a firm is more likely to manage ESG risks as well. We test this hypothesis by dividing firms into two groups based on whether they have nonzero hedge gains/losses according to income statement data from COMPUSTAT. We define an indicator variable, HEDGER, that equals 1 for firms with nonzero gains/losses from hedging, and 0 otherwise.Footnote 27 We run FM regressions of the delta-hedged option return on HEDGER and its interaction with the ESG score. Panel C of Table 10 reports the results for calls and puts together. We find that the coefficients on HEDGER are positive. This suggests that these firms have relatively lower risk and their options are relatively cheaper. The coefficient of interest is again that on the interaction term. We find that it is negative and statistically significant. These results indicate that among firms with hedging activities, the effect of the ESG score on option pricing is weaker, consistent with the argument that these firms may actively manage ESG risk.
VI. Conclusion
With increasing awareness of ESG issues in recent years, firms with poor ESG performance face higher uncertainty from different perspectives, such as when and how ESG-related regulatory policies will be implemented, investors’ divestment policies, and fluctuations in revenues. Are such uncertainties and risks perceived by investors and priced in the options market?
Our analysis suggests that ESG-related uncertainty is priced in the options market and that option prices reflect the market consensus on this uncertainty. Via quintile portfolio sorts, we find the magnitude of the ESG premium to be about 0.2% over 50 days. These results are robust to alternative ESG data providers and methods of constructing option returns. All components of ESG contribute to option expensiveness. We find that this premium mainly derives from jump risks. The ESG risk premium in the options market increases when public attention to ESG issues increases. However, there is substantial heterogeneity between firms in multiple dimensions, such as proximity to end consumers, product market competition intensity, investors’ awareness, and corporate hedging activities.
Appendix. Variable Definitions
Option Variables
- Daily rebalanced delta-hedged option return
-
The daily rebalanced delta-hedged option gain is the change (until option maturity) in the value of a portfolio consisting of one contract of a long option position and delta shares of the underlying stock, re-hedged daily. The call option delta-hedged gain is scaled by $ {\Delta}_cS-C $
 , where
$ {\Delta}_c $
is the Black–Scholes option delta,
$ S $
is the underlying stock price, and
$ C $
is the price of the call option. The put option delta-hedged return is defined analogously, except that we scale it by
$ P-{\Delta}_pS $
.
- Daily rebalanced beta-neutral straddle return
-
For each stock at the end of each month, following Coval and Shumway (Reference Coval and Shumway2001), we select $ \theta $
units of call options and
$ 1-\theta $
units of put options that are approximately ATM and have a maturity of around 1 month and a half (50 days).
$ \theta $
is determined to make the straddle beta-neutral. The position is rebalanced daily. Then, we calculate the daily rebalanced beta-neutral straddle return by summing the daily gains over the holding period and scaling the total by the portfolio’s initial cost. - Variance swap rate
-
We follow Carr and Wu (Reference Carr and Wu2009) to create synthetic variance swaps from options. Specifically, at the end of each month for each stock, we choose the two nearest maturities. For each maturity, we linearly interpolate the implied volatilities at different moneyness levels to obtain a fine grid of implied volatilities. We compute the out-of-the-money call option prices using the Black–Scholes formula and replicate the variance swap rate using a series of option prices. Then, we interpolate the synthetic variance swap rates at the two maturities to obtain the variance swap rate at a fixed 50-day horizon.
- Gamma-positive vega-neutral straddle return
-
For each stock at the end of the previous month, we take i) a long position in one beta-neutral ATM straddle with a maturity around 1 month and a half (50 days), and ii) a short position in $ y $
beta-neutral at-the-money straddles with a maturity around 2 months and a half (80 days), and
$ y $
is chosen to make the vega of the overall strategy zero. We rebalance the portfolio daily until maturity. - Vega-positive gamma-neutral straddle return
-
For each stock at the end of the previous month, we take i) a long position in one beta-neutral ATM straddle with a maturity around 2 months and a half (80 days), and ii) a short position in $ y $
beta-neutral at-the-money straddles with a maturity around 1 month and a half (50 days), and
$ y $
is chosen to make the gamma of the overall strategy zero. We rebalance the portfolio daily until maturity. - RSJ
-
The relative signed jump is the difference between the negative and positive realized semi-variance scaled by the sum of the positive and negative realized semi-variance (Bollerslev et al. (Reference Bollerslev, Li and Zhao2020)).
- VOV+
-
We follow Cao et al. (Reference Cao, Titman, Zhan and Zhang2023) to calculate the volatility of volatility increases as the standard deviation of the positive (percentage) change of volatility over a month. We use the historical tick-by-tick quote data from the TAQ database to record prices every 5 minutes starting at 9:30 EST and construct 5-minute log returns for a total of 78 daily returns. We use the last recorded price within each 5-minute period to calculate the log return. Then, we calculate the daily percentage change in volatility (volatility-return). We define the monthly VOV+ (positive VOV) measure as the standard deviation of the positive percentage change of volatility within each month.
- IMPVAR/IMPSKEW/IMPKURT:
-
Following Bakshi et al. (Reference Bakshi, Kapadia and Madan2003), the model-free implied risk-neutral variance/skewness/kurtosis is calculated for options with expiration of 50 days at the end of each month, using the implied volatility of 30 days and 60 days from the Volatility Surface to perform the linear interpolation.
- OPTION OI
-
The total number of option contracts that are open at the end of the previous month scaled by the stock trading volume of last month.
- OPTION BA
-
The ratio of the difference between the bid and ask quotes of the option to the midpoint of the bid and ask quotes at the end of the previous month.


ESG Performance Measures
- ESG score
-
The ESG score is from the ASSET4 database and is based on 250+ key performance indicators (KPIs) and 750+ individual data points from three pillars (E, S, and G). The ESG score ranges between 0 and 1 after scaling by 100.
- RRI trend
-
Difference in the RepRisk Index (RRI) between the current date and 30 days prior. The RepRisk data vendor recommends monitoring the development of the risk exposure of a company related to ESG issues or as an indicator of when a risk incident has appeared for a company.
Stock Characteristics
- Ln(ME)
-
The natural logarithm of the market value of the firm’s equity at the end of the previous year.
- Ln(BM)
-
The natural logarithm of book equity for the fiscal year-end in a calendar year divided by market equity at the end of December of that year, as in Fama and French (Reference Fama and French1992).
- RET212
-
The cumulative stock return from the prior second through twelfth months.
- RET1
-
The stock return in the previous month.
- Ln(AMIHUD)
-
The logarithm of the Amihud (Reference Amihud2002) stock illiquidity measure of the previous month.
- INSTOWN
-
The percentage of common stocks owned by institutions in the previous quarter.
- ANLST
-
The number of analysts following the firm in the previous month.
- IVOL
-
The standard deviation of the regression residual of individual stock returns on the Fama and French (Reference Fama and French1993) 3 factors using daily data in the previous month, as in Ang et al. (Reference Ang, Hodrick, Xing and Zhang2006).
- BETA
-
Market beta of rolling 60-month FF-3 monthly return regressions.
- CONSUMER
-
Indicator variable for stocks in the industry that are close to end consumers. Industry classifications are based on Sharpe (Reference Sharpe1982). The following 4-digit SIC codes are assigned to each group. i) Basic industries: 1000–1299, 1400–1499, 2600–2699, 2800–2829, 2870–2899, 3300–3399; ii) Capital goods: 3400–3419, 3440–3599 excluding 3523, 3670–3699, 3800–3849, 5080–5089, 5100–5129, 7300–7399; iii) Construction: 1500–1599, 2400–2499, 3220–3299, 3430–3439, 5160–5219; iv) Consumer goods: 0000–0999, 2000–2399, 2500–2599, 2700–2799, 2830–2869, 3000–3219, 3420–3429, 3523, 3600–3669, 3700–3719, 3751, 3850–3879, 3880–3999, 4813, 4830–4899, 5000–5079, 5090–5099, 5130–5159, 5220–5999, 7000–7299, 7400–9999; v) Energy: 1300–1399, 2900–2999; vi) Finance: 6000–6999; vii) Transportation: 3720–3799 excluding 3751, 4000–4799; viii) Utilities: 4800–4829 excluding 4813, 4900–4999; ix) Others: all other SIC codes. Finally, firms in the consumer goods and finance sectors are classified as closer to end consumers.
- FLUIDITY
-
The degree of competitive threat and product market change surrounding a firm, based on Hoberg et al. (Reference Hoberg, Phillips and Prabhala2014).
- BLUE
-
Indicator variable (referring to blue states) refers to states where voters predominantly choose the Democratic Party.
- CONFENV
-
Share of the conversations in the quarterly earnings conference calls centering on risks associated with environment-related political topics, proposed by Hassan et al. (Reference Hassan, Hollander, van Lent and Tahoun2019).
- HEDGER
-
Indicator variable equal to 1 if the firm has a nonzero record of cash flow hedge gains/losses in COMPUSTAT, and 0 otherwise.

TABLE A1 Long description
Panel A: Time-Series Distribution (180 Monthly Observations). Columns include Mean, Standard Deviation, 10th percentile, Lower quartile, Median, Upper quartile, and 90th percentile. Key rows: Number of stocks in the sample (Mean 384); Stock percentage coverage of stock universe E W (Mean 5.58); Stock percentage coverage of stock universe V W (Mean 34.40); Stock percentage traded at N Y S E or A M E X (Mean 72.98); Stock percentage in S and P 500 index (Mean 72.68).
Panel B: Time-Series Average of Cross-Sectional Distributions (69,058 Stock-Month Observations). Key rows: Size C R S P percentile (Mean 0.90); Book-to-market C R S P percentile (Mean 0.36); I N S T O W N (Mean 0.80); A N L S T (Mean 16.43).
Panel C: Time-Series Average of Industry Distribution comparing ‘This Sample’ to ‘C R S P Sample’. Top industries in this sample include Business equipment (17.98 percent), Others (12.94 percent), Finance (12.48 percent), and Wholesale (11.99 percent). Other categories include Consumer nondurables, Consumer durables, Manufacturing, Energy, Chemicals, Telecom, Utilities, and Healthcare.

TABLE A2 Long description
The table consists of six columns labeled P 1, P 2, P 3, P 4, P 5, and P 5 minus P 1.
Panel A. Synthetic 50-Day Variance Swap Rate:
- P 1: 15.71 with a t-statistic of 9.44.
- P 2: 11.55 with a t-statistic of 8.27.
- P 3: 10.60 with a t-statistic of 8.52.
- P 4: 9.03 with a t-statistic of 6.49.
- P 5: 5.77 with a t-statistic of 6.94.
- P 5 minus P 1: minus 9.94 with a t-statistic of minus 10.96.
Panel B. Variance Risk Premium:
- P 1: 0.82 with a t-statistic of 0.77.
- P 2: minus 0.47 with a t-statistic of minus 0.53.
- P 3: minus 0.50 with a t-statistic of minus 0.51.
- P 4: minus 0.77 with a t-statistic of minus 0.75.
- P 5: minus 0.80 with a t-statistic of minus 1.30.
- P 5 minus P 1: minus 1.63 with a t-statistic of minus 3.19.

TABLE A3 Long description
The table presents coefficients with robust Newey and West t-statistics in parentheses.
* Carbon intensity: Model 1 is -0.020 (-1.94); Model 2 is -0.031 (-2.87).
* E S G score: Model 1 is 0.265 (4.65); Model 2 is 0.233 (4.05).
* Ln(M E): Model 2 is 0.021 (0.50).
* Ln(B M): Model 2 is 0.015 (0.42).
* R E T 1: Model 2 is -0.377 (-1.03).
* R E T 2 1 2: Model 2 is -0.148 (-1.13).
* I V O L: Model 2 is -1.513 (-7.33).
* Ln(A M I H U D): Model 2 is 0.085 (2.04).
* O P T I O N O I: Model 2 is -2.647 (-6.39).
* O P T I O N B A: Model 2 is -0.769 (-4.52).
* B E T A: Model 2 is 0.044 (0.71).
* I M P V A R: Model 2 is -0.058 (-0.79).
* I M P S K E W: Model 2 is -0.207 (-2.04).
* I M P K U R T: Model 2 is 0.180 (3.14).
* Average adjusted R-squared: Model 1 is 0.007; Model 2 is 0.059.
* Number of observations: Model 1 is 122,592; Model 2 is 116,708.

TABLE A4 Long description
The table consists of three columns: O T M (Out-of-the-Money), A T M (At-the-Money), and I T M (In-the-Money). For each variable, the coefficient is listed first, followed by the Newey-West t-statistic in parentheses.
* E S G score: O T M 0.206 (2.13), A T M 0.152 (2.30), I T M 0.081 (1.73).
* L n (M E): O T M 0.136 (1.96), A T M 0.059 (1.32), I T M 0.046 (1.47).
* L n (B M): O T M 0.026 (0.47), A T M 0.021 (0.56), I T M 0.017 (0.73).
* R E T 1: O T M minus 0.887 (minus 1.76), A T M minus 0.694 (minus 2.04), I T M minus 0.316 (minus 1.40).
* R E T 2 1 2: O T M minus 0.178 (minus 1.03), A T M minus 0.097 (minus 0.76), I T M minus 0.033 (minus 0.42).
* I V O L: O T M minus 6.333 (minus 5.76), A T M minus 5.364 (minus 7.60), I T M minus 2.631 (minus 5.72).
* L n (A M I H U D): O T M 0.170 (2.46), A T M 0.126 (2.90), I T M 0.091 (2.91).
* O P T I O N O I: O T M minus 4.839 (minus 5.16), A T M minus 3.309 (minus 6.31), I T M minus 2.060 (minus 3.57).
* O P T I O N B A: O T M minus 0.287 (minus 2.17), A T M minus 0.741 (minus 3.90), I T M minus 0.613 (minus 3.17).
* B E T A: O T M minus 0.054 (minus 0.80), A T M 0.018 (0.35), I T M minus 0.006 (minus 0.16).
* I M P V A R: O T M minus 0.147 (minus 1.32), A T M minus 0.059 (minus 0.68), I T M minus 0.043 (minus 0.77).
* I M P S K E W: O T M minus 0.441 (minus 2.74), A T M minus 0.335 (minus 2.37), I T M minus 0.117 (minus 1.53).
* I M P K U R T: O T M 0.018 (0.35), A T M 0.018 (0.35), I T M 0.018 (0.35).

TABLE A5 Long description
The table is divided into two main sections: Panel A for a maturity of 30 days and Panel B for a maturity of 60 days. The columns represent four dependent variables: 1 V R P, 2 M F I S, 3 M F I K, and 4 Slope D.
Panel A (30 Days):
- E S G score: Coefficients are -1.409 (t-stat -4.08) for V R P, -0.959 (-0.81) for M F I S, -11.482 (-6.00) for M F I K, and -4.796 (-10.28) for Slope D.
- Control variables include Ln(M E), Ln(B M), R E T 1, R E T 2 1 2, I V O L, Ln(A M I H U D), and B E T A.
- Average adjusted R-squared values range from 0.047 to 0.161.
- Number of observations is 114,852 for all columns.
Panel B (60 Days):
- E S G score: Coefficients are -0.879 (t-stat -2.24) for V R P, 0.039 (0.03) for M F I S, -16.675 (-6.29) for M F I K, and -6.467 (-10.75) for Slope D.
- Control variables follow the same structure as Panel A.
- Average adjusted R-squared values range from 0.104 to 0.181.
- Number of observations is approximately 115,236 to 115,634.
Across both panels, E S G scores generally show a negative and statistically significant relationship with V R P, M F I K, and Slope D.
Funding Statement
Cao acknowledges grants from the Research Grant Council of the Hong Kong Special Administrative Region, China (Projects GRF 14501720, 14500621, 15500023, 15500224), as well as support from The Hong Kong Polytechnic University (P0046074) and the PolyU Research Centre for Quantitative Finance (P0050344). Zhan acknowledges grants from the National Natural Science Foundation of China (Grants 72271061 and 2022hwyq15). Zhang gratefully acknowledges IE Business School for financial support and research facilities, and a grant by Ministerio de Ciencia, Innovación y Universidades/Agencia Estatal de Investigación Fonds Européen De développement Régional, Unión Europea (Grant PID2023-152707NA-I00).