
I. INTRODUCTION
Development of anode materials for high performance lithium-ion batteries has been driven by the recognition of mitigating the adverse effects of pulverization in high-capacity materials, such as silicon (Si) and tin (Sn). Significant progress has been made since 2008Reference Chan, Peng, Liu, McIlwrath, Zhang, Huggins and Cui1 toward improving capacity retention in Si. Si is an attractive anode candidate because of its high theoretical capacity of 4200 mAh/g, corresponding to Li22Si5 composition with a lattice constant of 18.66 Å and 3580 mAh/g for Li15Si4 with a lattice constant of 10.777 Å.Reference Dębski, Zakulski, Major, Góral and Gąsior2,Reference Hatchard and Dahn3 As a result, a large volume change (∼400%) from Si (lattice constant 5.431 Å and four silicon atoms in a unit cell)Reference Dismukes, Ekstrom and Paff4 to Li22Si5 during the lithiation process (alloying with Li) results in a loss of capacity, attributed to the pulverization of the anode particles, loss of electrical contacts with the current collector and/or neighboring electrode particles and subsequent delamination from the current collector.Reference Wang, Wu, Chen, McDowell, Cui and Bao5 Recent in situ electron microscopy study detailed an orientation-dependence of the lithiation process in silicon which caused the anisotropic swelling.Reference Liang, Yang, Fan, Liu, Liu, Huang, Zhu and Zhang6 Theoretical calculations based on continuum mechanics show that the diffusion-induced stress during the electrochemical reaction depends upon the particle size of anodes, while the critical size for Si is ∼130 nm.Reference Zhao, Pharr, Vlassak and Suo7 When the anode particles are smaller than the critical size, the surface energy is hypothesized to be capable of balancing diffusion-induced stresses, thus enabling a stable cycle performance. Indeed, some promising experimental strategies have shown feasibility of reducing the detrimental effects of structural changes in anodes, including (i) reduction of the characteristic size of Si by synthesizing nanosized materials, which can provide short lithium diffusion distances and accommodate large strain without pulverization to maintain good electronic contact with the substrate,Reference Chan, Peng, Liu, McIlwrath, Zhang, Huggins and Cui1 (ii) reduction of the total volume expansion effects by tailoring the nano/microstructures, crystallinity (amorphous, coatings), and the integrated network between anodes and binder,Reference Murugesan, Harris, Korgel and Stevenson8–Reference Guo, Sun, Chen, Wang and Manivannan11 and (iii) tuning the chemical composition, including alloyingReference Abel, Chockla, Lin, Holmberg, Harris, Korgel, Heller and Mullins9 or composite with SiO for instanceReference Munao, Valvo, van Erven, Kelder, Hassoun and Panero10,Reference Guo, Sun, Chen, Wang and Manivannan11 to improve the fracture toughness of the materials.Reference Yang, Yu, Li, Wang and Wang12,Reference Wang, Yu, Li and Yang13
While the nanosized materials as anodes show the promise, there is a need to utilize submicro/micro-sized materials for large-scale battery applications (e.g., electric vehicle) because of their cost-effective process, high package density, ease to scale-up, and less undesirable side reactions between submicro/micro-sized anodes and the electrolyte. To improve the electrochemical performance of submicro-sized Si while keeping its high capacity, a solid solution consisting of Ge (1620 mAh/g) and Si is an optimal choice. The addition of Ge has been shown to improve the capacity retention in Si–Ge nanowiresReference Song, Cheng, Choi, Lee, Han, Lee, Yoo, Kwon, Choi, Doo, Chang, Xiao, Huang, Park, Chung, Kim, Rogers and Paik14 and mechanically milled powders.Reference Duveau, Fraisse, Cunin and Monconduit15 However, more studies on process–structure–property relations in the materials from a new synthetic route are needed to fully exploit their potential. The mechanism still remains elusive. It is known that the addition of a solute (Ge) into silicon creates a local stress field during the formation of solid solution, which interacts with resident dislocations and subsequently impedes their motion. As a result, an increase in yield stress in silicon-based anodes can be obtained, which are capable of withholding greater stresses to initiate slip and the attendant yielding. Despite the volume change of ∼260%, the fracture toughness of lithiated Ge is much larger than that of lithiated Si.Reference Wang, Yang and Xia16 Additionally, in comparison with Si, Ge exhibits both higher electrical conductivity (104 times than that of Si)Reference Gao, Luo, Zhong, Wexler, Chou, Liu, Shi, Chen, Ozawa and Wang17 and higher ionic diffusivity for lithium ions (400 times of Si).Reference Graetz, Ahn, Yazami and Fultz18 Here we report that a complete miscible Si–Ge solid solution series in a bulk form. The solid solution synthesis is a simple single-step process, which is easily scalable and cost-effective. Electrochemical performance-tested results show that the crystalline Si–Ge solid solution electrodes delivered much better stability than that of Si or Ge alone, particularly in Si0.50Ge0.50. In situ X-ray diffraction (XRD) technique was also used to investigate the phase evolution during the electrochemical cycling.
II. EXPERIMENTAL
A. Materials preparation and characterization
Silicon (laser synthesized, US Research Nanomaterials, Houston, Texas) and germanium (Alfa Aesar, Ward Hill, Massachusetts) powders were mixed with a proper ratio to form Si1−xGex. Boron powders (2 wt%) were added to Si1−xGex. The mixed powders were added to isopropanol and then kept for ultrasonic dispersion for 30 min. The mixture was vacuum dried at 120 °C for 2 h, followed by heating the mixture up to the temperature of 1140 °C for 4 h in the presence of continuous flow of hydrogen gas (200 sccm). X-ray diffraction (XRD; Rigaku X-ray diffractometer, Rigaku Corporation, The Woodlands, Texas, Cu Kα) analysis was performed to study the phase structure and crystallinity. The particle size and the morphology of the anode materials were studied by using a scanning electron microscope (Zeiss Ultraplus Thermal Field Emission SEM, Carl Zeiss AG, Jena, Germany). Elemental mapping was carried out by using the aberration corrected scanning TEM (STEM FEI Titan 80-300, FEI Company, Hillsboro, Oregon) with an energy dispersive spectrometer (EDS).
B. Electrochemical measurements
The slurry for the working electrode consisting of 80 wt% of active materials, 10 wt% of carbon black (1400 m2/g, Akzo Nobel Surface Chemistry, Inc., Houston, Texas), and 10 wt% of sodium alginate binder, dispersed in deionized water (MP Biomedicals, LLC, Solon, Ohio) were mixed together followed by ball milling for eight hours. Finally, the slurry was casted on a copper foil using a doctor blade, followed by vacuum drying at 90 °C for 16 h and stored inside a glove box under argon atmosphere. The total mass loadings of the electrodes were in between 0.5 and 0.7 mg/cm2.
Coin cells were assembled inside the argon-filled glove box with 1 M LiPF6 in dimethyl carbonate and fluoroethylene carbonate (1:1 by volume) as the electrolyte and lithium metal (Alfa Aesar, Ward Hill, Massachusetts, 99.9%) as the reference/counter electrode and Celgard 2400 as the separator. The cells were galvanostatically discharged and charged on a battery test system (Arbin BT2000, Arbin Instruments, College Station, Texas) between 0.02 and 2.0 V at room temperature. The specific capacities were calculated based on the total mass of the electrode materials including the binder and the conductive agent.
III. RESULTS AND DISCUSSION
A. Theoretical analysis of strengthening in Si–Ge solid-solutions
Material fracture occurs when the energy available for the crack growth is sufficient to overcome the fracture resistance of the materials. The fracture toughness of a material represents the resistance of a material (e.g., surface energy and plastic work) to the propagation of defects such as dislocations. A number of mathematical expressions were developed to estimate the critical particle size below which the fracture of the particles could be prevented. Huggins et al. carried out an early attempt to estimate the critical size (d c) of the anode particlesReference Huggins and Nix19:
 $${d_{\rm{c}}} = {{23} \over \pi }{\left( {{{3{K_{{\rm{IC}}}}} \over {B{\varepsilon _{\rm{T}}}}}} \right)^2}\quad ,$$
where K IC is the fracture toughness of the material, εT = (ΔV/V), representing transformation strain, and B is the biaxial elastic modulus. The common parameters for silicon are as follows: εT = 3, B = 170 GPa,Reference Abel, Chockla, Lin, Holmberg, Harris, Korgel, Heller and Mullins9 K IC = 1.06 MPa m1/2.Reference Chasiotis, Cho and Jonnalagadda20 The critical size is calculated to be ∼0.28 nm, which is not congruent with the experimental observations for silicon (up to 150 nm).Reference Liang, Yang, Fan, Liu, Liu, Huang, Zhu and Zhang6 The selection of proper parameters is a ubiquitous challenge in some mathematic models to predict the critical size.
More than often, the models of lithiation-induced deformation and fracture assumed the elastic behavior of the electrodes. Recently, Zhao et al. argued that the observation of large morphological changes clearly indicates that charge/discharge cycles caused inelastic deformation.Reference Zhao21 A new model based on the assumption of inelastic electrodes was developed by considering elastic–plastic deformation and fracture. This model works well for high-capacity materials because of their large volume expansion during lithiation. Center to the development of mathematic models for Si–Ge alloys is the consideration of pre-existing flaws, e.g., constraints at the local solute atoms. For a nonlinear elastic body, the energy release rate can be obtained by J contour integral, defined as the change in the potential energy of the material with respect to the change in crack area. For the lithiation-induced cracks, the mode I fracture (i.e., the tensile stress acts normal to the plane of the crack) may be assumed. The concept of J integral applies equally well to structures failing in elastic conditions and in fully plastic conditions, therefore, K IC is related to J IC asReference Zhu and Joyce22
 $$J{}_{{\rm{JC}}} = {{K_{{\rm{IC}}}^2\left( {1 - \nu } \right)} \over E}\quad ,$$
where ν is the Poisson’s ratio and E is the Young’s modulus of the materials. For the inelastic host materials, Zhao et al. proposed a mathematical relation to estimate the critical size of the inelastic hosts as electrodes for the lithium-ion battery by considering diffusion, elastic–plastic deformation, and fracture asReference Zhao, Pharr, Vlassak and Suo7
 $$d{}_{\rm{c}} = {{\Gamma E} \over {Z{\sigma ^2}}}\quad ,$$
where Γ is the fracture energy of the particle, σ is a yield stress, and Z is the dimensionless number of order unity. We now can estimate the critical size of Si1−xGex by considering J JC = K and using proper values of E, K IC, and ε. Equation (3) becomes
 $${d_{\rm{c}}} = {{\Gamma E} \over {Z{\sigma ^2}}} = {{K_{{\rm{IC}}}^2\left( {1 - \nu } \right)} \over E}{E \over {Z{\sigma ^2}}} = {{K_{{\rm{IC}}}^2\left( {1 - \nu } \right)} \over {Z{E^2}{\varepsilon ^2}}}\quad .$$
Mechanical properties, e.g., Young’s modulus, of Si–Ge alloys have been reported, particularly in Yonenaga’s series of publications for the alloys at high temperatures (>500 °C).Reference Yang, Yu, Li, Wang and Wang12,Reference Wang, Yu, Li and Yang13,Reference Yonenaga23–Reference Yonenaga25 The stress–strain for the germanium rich alloy was similar to Ge, likewise silicon-rich alloy similar with Si. The unique behavior occurs in compositions with x ∼ 0.50 at which an athermal stress is in its maximum.Reference Yonenaga25 Below the athermal stress, dislocations are pinned due to the dynamic interaction between a solute and surrounding dislocations, thus strengthening Si–Ge alloys. Although much work was done at high temperatures, these results are consistent with our electrochemical measurements.
B. Structure, strain, and critical size of Si–Ge solid solutions
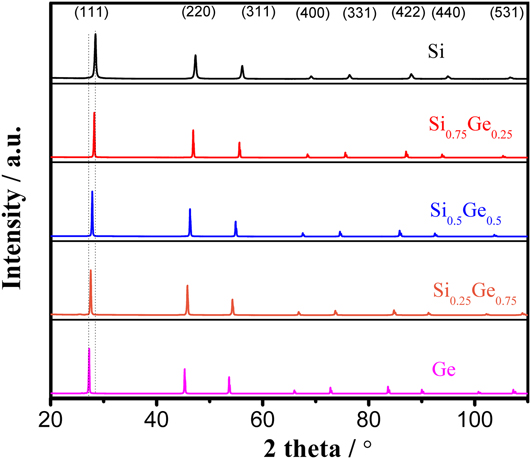
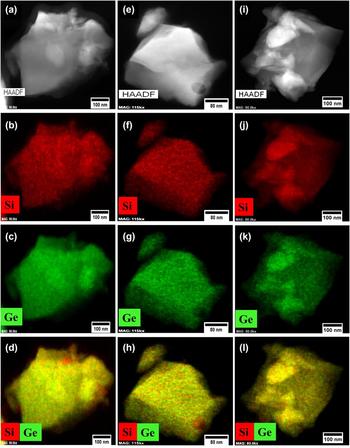
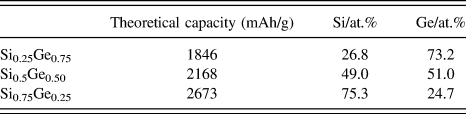
Silicon and germanium are fully miscible to form crystalline alloys due to their similar chemical properties, including valence structure, bonding orbitals (sp 3), crystal structure (diamond FCC), and indirect band gap. Our initial experiment focused on the refinement of diffraction patterns of the Si–Ge alloys. Figure 1 shows XRD patterns of Si1−xGex (x = 0–1), suggesting the formation of single phase solid solutions. To confirm the composition, elemental distribution of Ge and Si in the solid solutions were examined by elemental mapping, which are presented in Fig. 2. Homogenous distribution of Si and Ge in the all solid solutions can be observed. The atomic compositions obtained by quantitative analysis of the elemental mapping results were close to the feed ratio (Table I). Theoretical specific capacities of the alloys based on the weight fractions and theoretical specific capacities of SiReference Mishra, Zheng, Patel, Estevez, Jia, Luo, El-Khoury, Li, Zhou and Zhang26 and GeReference Ke, Mishra, Jamison, Peng, Ma, Huang, Sun and Zhou27 are also provided in the same table.
XRD patterns of Si, Ge, and Si–Ge solid solution series.

TEM images and elemental mapping for Si, Ge, and both components for Si0.25Ge0.75 (a–d), Si0.5Ge0.5 (e–h), and Si0.75Ge0.25 (i–l).

EDS analysis for the chemical composition of Si–Ge solid solutions. The theoretical specific capacity of each alloy is calculated based on the corresponding weight fractions and the theoretical specific capacities of Si (3579 mAh/g) and Ge (1623 mAh/g).

Refinement was carried out to calculate lattice parameters and residual lattice strain. Williamson–Hall plots were used to obtain the residual strain in the solid solution, assuming that the diffraction peaks follow a Lorentzian distribution, as
 $${\beta _{{\rm{total}}}} = {\beta _{{\rm{size}}}} + {\beta _{{\rm{strain}}}} = {{0.9\lambda } \over {t\cos \theta }} + {{4\left( {\Delta d} \right)\sin \theta } \over {d\cos \theta }}\quad ,$$
where βtotal is the full-width half-maximum of the XRD peak after a subtraction of a systematic broadening, λ is the incident X-ray wave length, θ is the diffraction angle, t is the crystal size, and Δd is the difference of the d spacing corresponding to a typical peak. A plot of βtotal versus 4 sin(θ)/cos(θ) yields the crystal size from the intercept value, and the strain (ε = Δd/d) from the slope (Supplementary Material Fig. S1). The lattice parameter was calculated from a linear regression analysis of the measured lattice constant, obtained from each peak, against Nelson–Riley function:
 $${{\left( {{{{{\cos }^2}\;\theta } / {\sin \;\theta }} + {{{{\cos }^2}\;\theta } / \theta }} \right)} / 2}\quad .$$
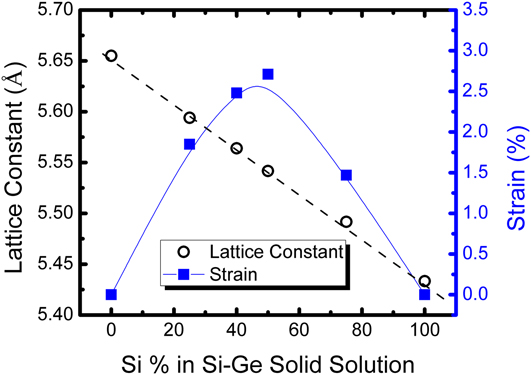
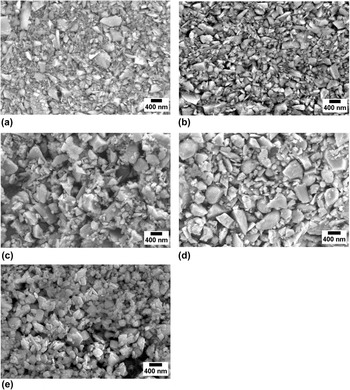
Figure 3 shows the lattice constant and residual strain as a function of germanium content (x). The lattice constant follows Vegard’s law, thus exhibits a tread of linear dependence of x. The subject of the deviation from Vegard’s law in the vicinity of x = 0.50 was extensively studied by the semiconductor physics community.Reference Aubry, Tyliszczak, Hitchcock, Baribeau and Jackman28–Reference Yu, Jayanthi, Drabold and Wu31 The residual strain in Si–Ge solid solution was simulated by ab initio molecular dynamics calculation, indicating that the bond lengths between Si–Si, Si–Ge, and Ge–Ge pairs were a function of composition thus resulting in local stress field.Reference Martins and Zunger29,Reference Yu, Jayanthi, Drabold and Wu31 X-ray absorption fine structure (XAFS) measurements,Reference Aubry, Tyliszczak, Hitchcock, Baribeau and Jackman28 however, found the bond-angle relaxation in the vicinity of Si0.50Ge0.50, resulting in a deviation from Vegard’s law. Moreover, XAFS results showed that the Si–Si bond length was only weakly dependent on composition, whereas there was a significant change in the Si–Ge bond length and an even larger change in the Ge–Ge bond length. Hence, the addition of Si into Ge is expected to significantly influence Ge–Ge bond, thus creating greater residual strain, as we observed here, as shown in Fig. 3. The parameters obtained from the literature for germanium are as follows: ν = 0.28, K IC = 1.004 MPa m1/2, Z = 0.91, and E = 102 GPa,Reference Wortman and Evans32 and its critical size can then be estimated from Eq. (4) ∼400 nm with a measured strain of 1.4%. For a particle of a given size at fixed values of fracture energy and young’s modulus, the critical particle size to avert the fracture is inversely proportional to the square of the lattice mismatch strain as given by Eq. (4). The strain values would be much greater during lithiation. In this research, the average particle size for these electrodes is in the range of 0.3–0.5 micrometers, as shown in Fig. 4.
Lattice constant and strain in Si–Ge solid solution series.

SEM images of (a) Si, (b) Si0.25Ge0.75, (c) Si0.50Ge0.50, (d) Si0.75Ge0.25, and (e) Ge before cycling.

C. Electrochemical performance of Si–Ge solid solutions
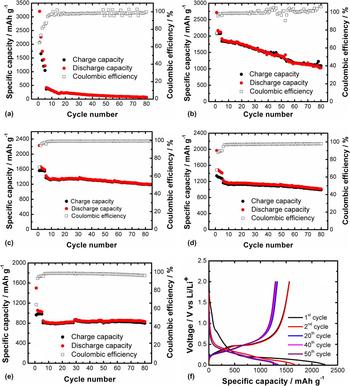
Coin cells were used to evaluate the electrochemical performance of the Si–Ge solid solutions. To embody the unique properties of the solid solutions, control experiments were carried out on Si and Ge electrodes under same conditions. Figure 5 shows the cycling performance of the Si, Ge, and Si–Ge solid solution electrodes at a current density of 500 mA/g after 5 cycles of activation at 100 mA/g. It is worthwhile to note that all of the capacity is based on the total weight of electrodes, which include active materials, binders, and conductive agents. The first discharge (lithiation) capacities of Si, Si0.75Ge0.25, Si0.50Ge0.50, Si0.27Ge0.75, and Ge electrodes were 3197.9, 2715.7, 2228.4, 1968.2, and 1499.8 mAh/g, and their first charge (delithiation) capacities were 2066.3, 2073.4, 1561.1, 1338.9, and 963.6 mAh/g, respectively. The coulombic efficiencies for all the electrodes during the first cycle were less than 80%. Besides the irreversible capacity loss due to the formation of the solid electrolyte interphase (SEI), the coulombic efficiency for first few cycles depend upon the amount of native oxides formed on the electrodes during the synthesis and storage. Therefore, the low coulombic efficiency for the first few cycles may be attributed to the irreversible capacity loss during the formation of the SEI and reduction of native oxides in Si and Ge electrodes.
Cyclic capacity performance of (a) Si, (b) Si0.75Ge0.25, (c) Si0.50Ge0.50, (d) Si0.25Ge0.75, and (e) Ge. (f) Voltage profiles of the Ge0.50Si0.50 electrode. The first 5 cycles were measured at the current density of 100 mA/g while the rest were obtained at 500 mA/g. Capacity is based on total weight of the electrode.

After five cycles of activation at 100 mA/g, the initial capacity was 417.9, 1869.1, 1425.0, 1277.7, and 844.9 mAh/g for Si1−xGex (x = 0, 0.25, 0.50, 0.75, and 1), corresponding to coulombic efficiencies of 87.1, 98.6, 96.1, 94.9, and 95.4%, at a higher current density of 500 mA/g. Additionally, the cyclic performance and the corresponding coulombic efficiencies of Ge and Ge-rich alloys are more stable compared to Si or Si-rich alloys, suggesting more robust electrode and the SEI. The capacity retentions of the five samples in the 80th cycle are 16.0, 55.2, 84.6, 79.2, and 98.2% for Si1−xGex (x = 0, 0.25, 0.50, 0.75, and 1). As shown in Figure 5(a), a rapid decrease in capacity was observed in silicon (0.3–0.5 micrometers), consistent with the literature reporting the fracture of the silicon electrode with an average particle size >150 nm.Reference Liang, Yang, Fan, Liu, Liu, Huang, Zhu and Zhang6 With Ge added into the submicro-sized Si, the capacity retention and cyclic performance are clearly improved. More interestingly, with increasing the composition of Ge, the capacity retention increases at first, then decreases. This indicates that the different component of Si–Ge solid solutions has a different structural stability. As we discussed above, the Si–Ge solid solution with different ratios exhibits a different strain, which is likely the key part to affect the cyclability of Si–Ge solid solutions. According to the strain analysis in Si–Ge solid solutions (Fig. 3), the strain of Si0.5Ge0.5 solid solution is the highest. As it is known, the residual strain of the solid solution provides the resistance for the movement of dislocations, due to interaction between the stress field of the solute and the dislocation. Compared to the Ge and Si0.5Ge0.5 solid solution electrodes, although the capacity retention of Ge is higher than that of Si0.5Ge0.5 solid solution, the capacity of Si0.5Ge0.5 solid solution is 1.5 times higher than that of the Ge electrode. Meanwhile, the coulombic efficiency of the solid solution is 99.4%, which is higher than that of Ge (96.2%) at the 80th cycle. It is clear that the Si0.5Ge0.5 solid solution electrode exhibited the best cycling performance and the highest capacity amongst the five electrodes, which can be attributed to the highest residual strain.
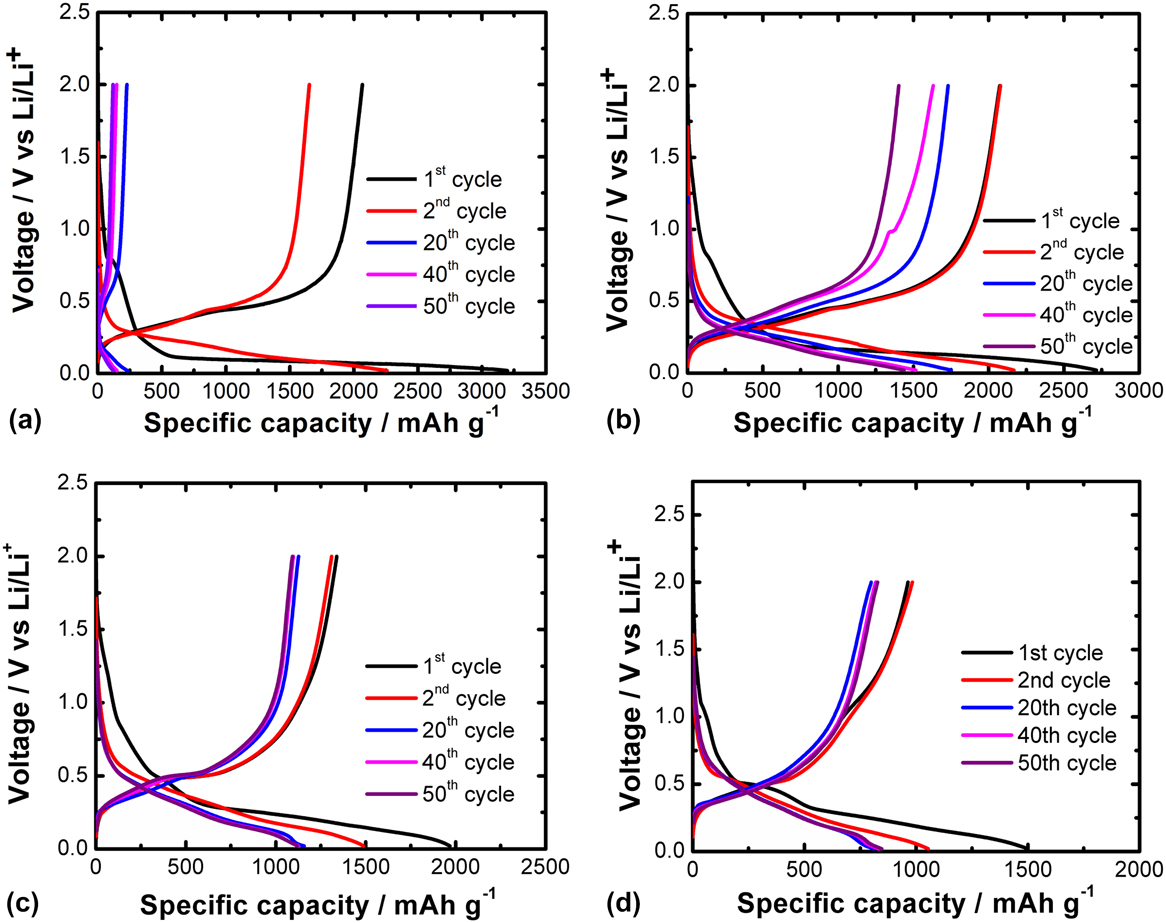
The selected voltage profile of the Si, Ge, and Si–Ge solid solutions are displayed in Figs. 6(a)–6(d). Compared to the Si electrode [Fig. 6(a)], the Si–Ge solid solutions and Ge electrodes exhibited improved capacity retention, suggesting structural stability of these materials compared to the Si electrode. With an increase in Ge fraction, the length of a small sloping region between 0.125 and 0.02 V versus Li/Li+ increases. This sloping region is attributed to the conversion of LixGe to Li15Ge4, which is consistent with in situ XRD studies discussed in later section.
Voltage profiles for 1st, 2nd, 20th, 40th, and 50th cycle for (a) Si, (b) Si0.75Ge0.25, (c) Si0.25Ge0.75, and (d) Ge electrodes.

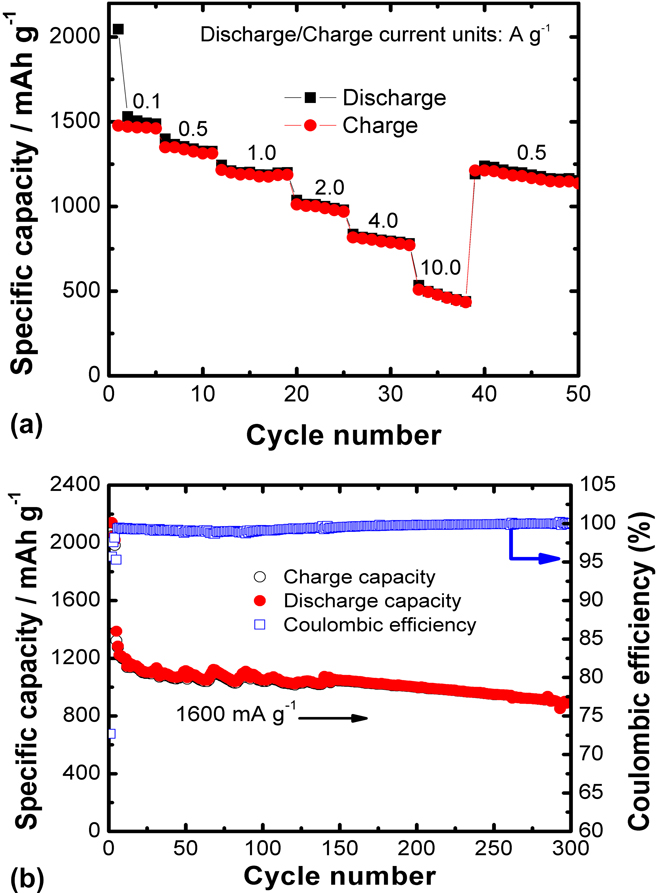
Further research was carried out to investigate the rate capability of the best performing Si0.50Ge0.50 electrode at various current densities, as shown in Fig. 7(a). The rate capability of the solid solution is plotted at the current rates of up to 10 A/g for the voltage range of 0.02–2.0 V versus Li/Li+. The specific capacities based on the total electrode mass are ∼1475, 1324, 1171, 982, 789, and 453 mAh/g at 0.1, 0.5, 1, 2, 4, and 10 A/g, respectively. The subsequent cyclic capacity was measured again at 0.5 A/g, which was 1209 mAh/g, indicating that the capacity was recovered 91.3% after rate-performance test. The electrode exhibited highest capacity fading at 10 A/g, with the 15% capacity loss during a five-cycle operation. Such a rapid capacity degradation during charging/discharging at 10 A/g could be explained by the inhomogeneity in Li distribution caused by crowded Li in the outer shell of the particles because of the lithiation rate being faster than diffusion of lithium ions in the active anodes, resulting in large stress in the particle, as reported by Zhao et al.Reference Zhao, Pharr, Vlassak and Suo33 Furthermore, it has been reported that such high stress could lead to the growth of pre-existing cracks. The inhomogeneity of Li distribution is higher at greater lithiation rates, resulting in a large lattice mismatch and implying that the charging rate (alloying with lithium) is the driving force for the fracture of materials. The slight loss in capacity when the current rate is brought back to 0.5 A/g compared to previous cycles at the same discharge rate could also be explained by the loss of active materials due to some materials being fractured at a high discharge rate of 10 A/g.
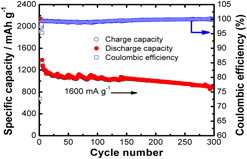
(a) Rate capability of the Si0.50Ge0.50 solid solution at different current densities (0.1, 0.5, 1, 2, 4, and 10 A/g). (b) Cyclic capacity performance of the Si0.50Ge0.50 electrode at the current density of 1600 mA/g, after 5 formation cycles at 200 mA/g.

To further assess the stability of the Si0.50Ge0.50 solid solution electrode at high rates, we evaluated the rate dependence of specific capacity of this solid solution, as presented in Fig. 7(b). The discharge capacity of the Si–Ge solid solution electrode is 895 mAh/g after 300 cycles at a current density of 1600 mA/g. The capacity retention of the electrode after 300 cycles is as high as 70%. The specific capacity is still over twice its theoretical value for the graphite electrode. This result illustrates that the Si0.50Ge0.50 solid solution electrode has excellent capacity retention and a long cycle life at high rate.
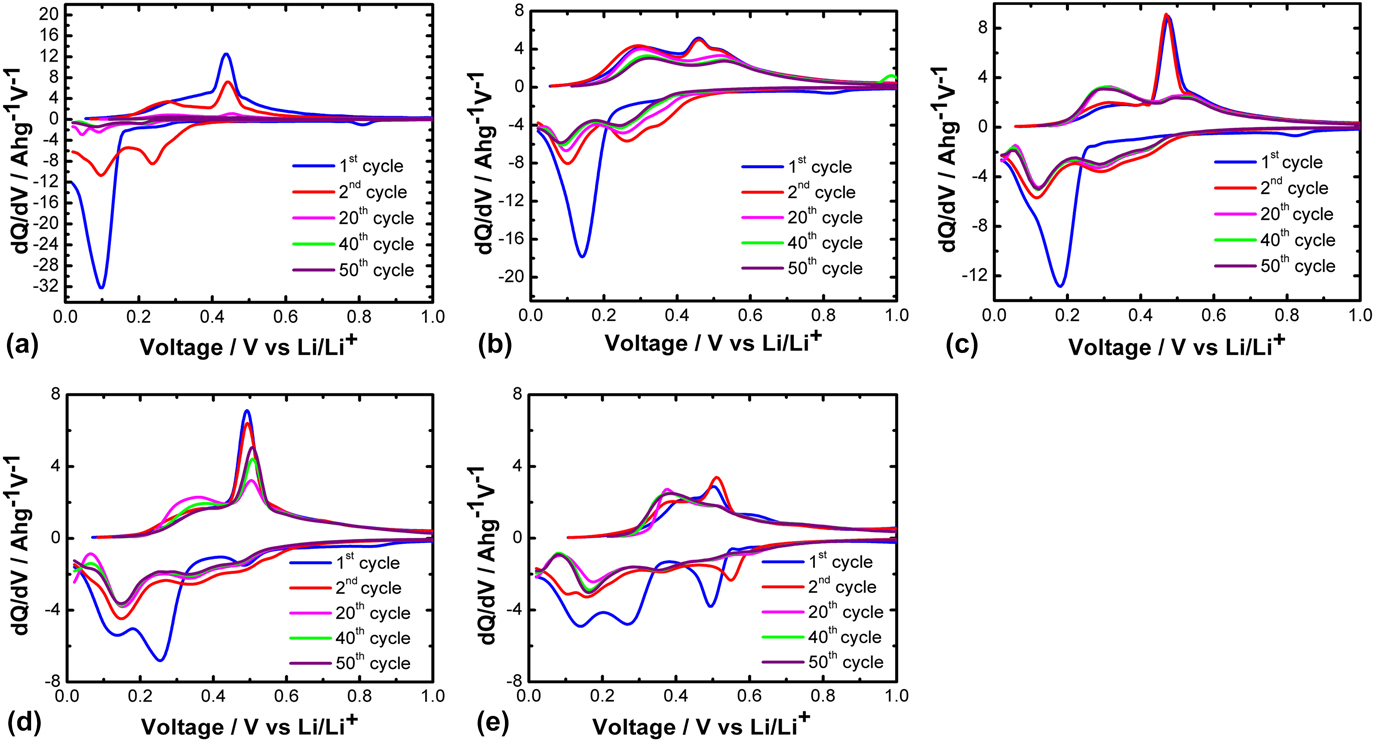
To understand why the Si0.50Ge0.50 solid solution electrode exhibits excellent electrochemical performance, we analyzed the differential capacity of the Si, Ge, and Si–Ge solid solution electrodes. Differential capacity analysis was used to study the mechanism of the electrochemical reactions during the lithiation and delithiation processes. Each peak generally represents an electrochemical reaction or phase transition in the active material.Reference Ke, Mishra, Jamison, Peng, Ma, Huang, Sun and Zhou27 Figures 8(a)–8(e) show the differential capacity plots for solid solution electrodes. For pure germanium, three peaks are initially observed at 0.14, 0.27, and 0.49 V. After first few cycles, they centered at 0.16 and 0.36 V, suggesting a two-step alloying process. For the delithiation process, the two peaks were initially observed at ∼0.38 and ∼0.51 V. Ultimately, after a few cycles, a single prominent peak was observed at ∼0.39 V, suggesting a single-step delithiation (dealloying) process. Figure 8(a) presents the dQ/dE plots for the silicon anode showing a single lithiation and delithiation peak at ∼0.1 V and ∼0.44 V, respectively, for the 1st cycle. Starting from the 2nd cycle, two lithiation peaks were observed at the ∼0.23 and ∼0.1 V. Similarly, two delithiation peaks were observed at ∼0.27 and ∼0.43 V. Figures 8(b)–8(d) show the dQ/dV plots for the Si0.75Ge0.25, Si0.50Ge0.50, and Si0.25Ge0.75 solid solution electrodes, respectively, corresponding to voltage–capacity relations shown in Figs. 6(a)–6(d). For the Si0.25Ge0.75 electrode [Fig. 8(d)], the major lithiation peaks can be observed at ∼0.34 and 0.15 V, and the delithiation process appears to be a two-step process at ∼0.36 and ∼0.5 V. For the Si0.50Ge0.50 electrode, apart from the first cycle, the three lithiation peaks are developed at ∼0.42, 0.29, and 0.12 V for rest of the cycles while the delithiation peaks were observed at ∼0.30 and 0.5 V. These results are consistent with the previous work reported by Abel et al. on thin film Si/Ge alloys.Reference Abel, Chockla, Lin, Holmberg, Harris, Korgel, Heller and Mullins9 More discussion is provided below. It may be interesting to note that the position of lithiation peaks are found to shift to the slightly lower voltages as the concentration of Si increases in the Ge electrode, indicating the formation of homogeneous solid solutions due to the absence of separate peaks for pure Si and Ge. Furthermore, post cycling TEM and the corresponding elemental mapping of the Si0.50Ge0.50 electrode are presented in Fig. S2, which revealed Si and Ge elements in the solid solution still keep uniform distribution, without aggregation after cycling. This result corroborates the stable cyclic performance of the Si0.05Ge0.50 solid solution electrode.
Differential capacity plots for solid solution electrodes for 1st, 2nd, 20th, 40th, and 50th cycle. (a) Si, (b) Si0.75Ge0.25, (c) Si0.50Ge0.50, (d) Si0.25Ge0.75, and (e) Ge electrodes.

It is commonly known that the ability of metals subject to plastic deformation can be suppressed by reducing the mobility of dislocations. Alloying a metal with solute atoms has been known to restrict the movement of dislocations and ultimately resulting in the increase in tensile and yield strengths. Enhancement of the mechanical strength of silicon by doping with germanium has been reported in semiconductor community, primarily at elevated temperatures >500 °C.Reference Yang, Yu, Li, Wang and Wang12,Reference Wang, Yu, Li and Yang13 Yonenaga, in several of his publications, reported that Si/Ge alloys showed a maximum yield stress in Si0.50Ge0.50.Reference Yonenaga23,Reference Yonenaga25 This finding is consistent with the more stable cyclic capacity observed in Si0.50Ge0.50 solid solution in our work. Germanium (atomic radius 122 pm) is larger than silicon (111 pm) in size, hence when the larger solute atoms (Ge) is added to the solvent atoms (Si), a compressive stress is generated near Ge atoms. This additional compressive stress can relieve strain created during lithiation/delithiation, thus enables more stable cyclic performance. From the differential capacity plots, it is apparent that the largest peak during lithiation of Ge is formed ∼0.16 V, suggesting most volume expansion around that voltage. For Si, however, the first peak of lithiation forms at ∼0.1 V, lower than that of Ge. The first peak of lithiation for solid solutions largely overlaps with that of Ge. Hence, the presence of Ge atoms in the Si can prevent from fracturing even at the particle sizes larger than the critical size (<150 nm) reported for Si by several other scholars.Reference Liang, Yang, Fan, Liu, Liu, Huang, Zhu and Zhang6,Reference Weker, Liu, Misra, Andrews, Cui and Toney34
D. Phase evolution investigated by in situ XRD during electrochemical cycling
In situ XRD was used to understand the processes of lithiation and delithiation of the Si–Ge solid solution anode. In this work, a high power (9 kW) diffractometer enabled us to determine structures during the first two cycles between 0.01 and 3.0 V at the current density of 0.15 A/g. In addition to its high power, a significant advantage of this diffractometer is its fast scan rate which allows one to gather sufficient structural details during the electrochemical reaction. In addition, the XRD spectra exhibit higher resolution than those obtained from a synchrotron setup.Reference Silberstein, Lowe, Richards, Gao, Hanrath and Abruña35,Reference Misra, Liu, Nelson, Hong, Cui and Toney36 Organic solvent N-methylpyrrolidone-based binder polyvinylidene fluoride was used to reduce the extent of electrode oxidation. As shown in Fig. S3, the peak intensity of Si0.5Ge0.5 reflections initially increased during the 1st lithiation cycle, then decreased [Fig. S3(c)]. Such an increase in intensity is attributed to the reaction of the residual Ge or Si oxides with Li ions, which are converted to Ge or Si. When discharging to ∼0.165 V (scan number 20), the intensity of reflection, (220) and (311), is at its maximum; while the intensity of (111) reflection continued to increase until 0.138 V (scan number 40), then decreased again. This observation shows that Li ions react with Si0.5Ge0.5 starting from higher index facets, i.e., (220) and (311), which exhibit more open structure than that of (111) facet. With more lithium diffusing into the solid solution, the intensity of all peaks of Si0.5Ge0.5 decreases. Further discharge to 0.112 V (scan number 75), a broad peak appeared at 2θ ∼ 41°, corresponding to nanosized or amorphous Lix(Ge,Si). Another broad peak appeared at 2θ ∼ 23° when discharged to 0.038 V (scan number 120). When the cell was fully discharged (scan number 154), the presence of crystalline Li15(Ge,Si)4 was observed, along with a few broad reflections, suggesting the presence of cluster-size Lix(Ge,Si). Interestingly, the (111) peak of Si0.5Ge0.5 was still seen after the full discharge which could be due to the high mass loading (∼7 mg/cm2) of the working electrode. Upon charging, the reflections of the lithiated phases began to diminish. When charged to 0.608 V (scan number 249), all peaks of Li15(Ge,Si)4 disappeared. During the delithiation process, the crystalline phase was converted to nano or amorphous Si0.5Ge0.5 solid solution. In the second cycle, a similar phenomenon was observed, in which all of the crystalline Si0.5Ge0.5 disappeared at the end of discharge while the intensity of crystalline Li15(Ge,Si)4 was stronger than that observed during the 1st cycle.
To better understand the function of Si and Ge in the Si0.5Ge0.5 solid solution, a comparison of lithiation behavior of Si0.5Ge0.5 (Fig. S3) was carried out on the parent Si and Ge anodes, as shown in Figs. S4 and S5, respectively. The Si anode behaved in a similar manner with Si0.5Ge0.5, as shown in Fig. S4 with the formation of cluster-type LixSi, which is then converted to Li15Si4 phase, and finally all of the crystalline phases disappeared. It was surprising to observe that the intensity of all Si peaks decreased at the beginning [Fig. S4(a)], indicating that there is no preferential lithiation facet for Si. For the Ge anode (Fig. S5), the first step involved with the conversion of surface GeO2 to Ge, shown by the increase of the intensity of Ge peaks. The second step was the lithiation process of Ge to form nanosized LixGe, and Li15Ge4 phase, and then the formation of the Li11Ge6 phase. To the best of our knowledge, the formation of Li11Ge6 was observed for the first time during the in situ characterization,Reference Liu, Huang, Picraux, Li, Zhu and Huang37,Reference Baggetto and Notten38 likely attributed to the use of high power diffractometer. Finally, the Li11Ge6 phase was converted to cluster-type Ge. According to the selected scan XRD patterns [Fig. S5(b)], the intensity of Ge(111) and (220) peaks increased at the beginning (scan number 80) due to the conversion of GeO2 to Ge. However, the intensity of the Ge(311) peak decreased, which means that the Li ions react preferentially with Ge at the (311) facet. Based on the in situ XRD of Si and Ge anodes, the addition of Ge into Si changed the direction of lithiation, resulting in improving the stability of the Si anode.
Finally, a comparison of the intensities of XRD reflections of the lithiated phases in Figs. S3(a), S4(a), and S5(a) reveals that the crystallinity of the final lithiated phase in Si is amorphous while it is crystalline in Ge or Si0.50Ge0.50. Formation of crystalline Li15Si4 has been reported to be kinetically slow, often requires current density below C/100.Reference Datta and Kumta39,Reference Zhang, Wang, Xiao, Xu, Graff, Yang, Choi, Wang, Li, Liu and Brodd40 Therefore, there appears a relation between the crystallinity of the lithiated phase and the electrochemical stability. Further work may be required to unravel the role of crystallinity on the electrochemical performance of these electrodes.
IV. CONCLUSIONS
A series of Si–Ge solid solutions was synthesized from a facile single-step process. Strain analysis and electrochemical measurements showed the presence of Ge solute strengthening in Si–Ge solid solutions. The results revealed that Si0.50Ge0.50 exhibits a stable discharge capacity of 1210 mAh/g at a current density of 500 mA/g after 80 cycles, 895 mAh/g at 1600 mA/g after 300 cycles based on the total mass of the electrode. The observed electrochemical performance offers a new perspective for the possibility of utilizing the submicron-sized SixGe1−x as an advanced anode material of lithium-ion batteries. It can be inferred from the obtained results that doping Si with Ge enhances the fracture resistance of Si. Solid solutions with equimolar compositions of Si and Ge produced the stable capacity performance, which is most likely due to the yield strength being highest at that composition as reported in the literature, implying its better structural stability. In situ XRD studies were used to understand the phase evolution in the Si0.50Ge0.50 electrode during the first two cycles, which possessed three steps during the discharge process and one-step during the charge process. More interestingly, it revealed that the lithiation process is faster from the higher index facets than that of the low index facets.
Supplementary Material
To view supplementary material for this article, please visit https://doi.org/10.1557/jmr.2018.145.
ACKNOWLEDGMENTS
This work was also partially supported by National Science Foundation under Grant No. CBET1408751. Part of the work was sponsored by National Nature Science Foundation of China (21403157) and Natural Science Foundation of Jiangsu Province of China (ZXG201446 and BK20140410) and the Fundamental Research Funds for the Central Universities (2042017kf0232). FSK acknowledges the New Faculty Startup Fund of Wuhan University, Large-scale Instrument and Equipment Sharing Foundation of Wuhan University.