Introduction
Entamoeba histolytica, a protozoan parasite belonging to the phylum Amoebozoa, is the causative agent for amoebiasis. Amoebiasis is a global public health problem owing to its high morbidity and mortality rates (Ralston and Petri, Reference Ralston and Petri2011; Watanabe and Petri, Reference Watanabe and Petri2015). Most individuals infected with E. histolytica are asymptomatic and do not require medical treatment. However, asymptomatic individuals are important because they unconsciously spread the disease via cysts excreted in their feces. The principal source of amoebiasis is water or food contaminated by feces with mature cysts from infected individuals (Watanabe and Petri, Reference Watanabe and Petri2015; Zulfiqar et al., Reference Zulfiqar, Mathew, Horrall and Horrall2020). Currently, clinical options are inadequate; only a few drugs are available and an effective vaccine has not been developed (Quach et al., Reference Quach, St-Pierre and Chadee2014; Zulfiqar et al., Reference Zulfiqar, Mathew, Horrall and Horrall2020).
Entamoeba histolytica survives drastic environmental changes outside as well as inside its human host by alternating its form between a proliferative trophozoite and a dormant cyst. The cyst is the sole form able to transmit the parasite to a new host. Cysts orally ingested by an individual can pass through the strong acidic conditions of the stomach to reach the small intestine where they hatch into trophozoites. This process is called excystation. Trophozoites then colonize the large intestine and proliferate there. Some of them differentiate into cysts in a process is called ‘encystation’. Encystation is a parasitic strategy involving a fundamental cell differentiation process. This process is closely associated with the transmission of amoebiasis; therefore, inhibition of encystation is an effective strategy against amoebiasis (Mi-ichi et al., Reference Mi-ichi, Yoshida and Hamano2016). Hence, E. histolytica encystation is an important subject from a medical as well as a biological perspective.
Entamoeba histolytica laboratory strains do not encyst after adaptation to in vitro cultures. However, studies using in vitro E. histolytica cultures have explored the conditions and chemicals that can induce the formation of cysts or cyst-like structures (Osada, Reference Osada1959; Campos-Gongora et al., Reference Campos-Gongora, Viader-Salvado, Martinez-Rodriguez, Zuniga-Charles, Galindo and Said-Fernandez2000; Gonzalez-Salazar et al., Reference Gonzalez-Salazar, Viader-Salvado, Martinez-Rodriguez, Campos-Gongora, Mata-Cardenas and Said-Fernandez2000; Said-Fernandez et al., Reference Said-Fernandez, Campos-Gongora, Gonzalez-Salazar, Martinez-Rodriguez, Vargas-Villarreal and Viader-Salvado2001; Aguilar-Díaz et al., Reference Aguilar-Díaz, Díaz-Gallardo, Laclette and Carrero2010). Meanwhile, in vitro culture of Entamoeba invadens, a reptilian parasite, has been used as a model system for encystation study (Eichinger, Reference Eichinger1997; Mi-ichi et al., Reference Mi-ichi, Yoshida and Hamano2016). Furthermore, the cysts formed in this model system can excyst to trophozoites (Mitra et al., Reference Mitra, Pradel, Frevert and Eichinger2010; Suresh et al., Reference Suresh, Ehrenkaufer, Zhang and Singh2016). During E. invadens encystation, cell morphology changes; amoeboid cells become rounded dormant cells. Substantial changes occur concurrently in cell components. For example, a single nucleus becomes four and ribosomes become aggregated into chromatoid bodies (Tanyuksel and Petri, Reference Tanyuksel and Petri2003). Chitins, a major component of the cyst wall, are synthesized and layered around the cell to resist environmental assault (Chatterjee et al., Reference Chatterjee, Ghosh, Jang, Bullitt, Moore, Robbins and Samuelson2009; Samanta and Ghosh, Reference Samanta and Ghosh2012; Samuelson et al., Reference Samuelson, Bushkin, Chatterjee and Robbins2013). Various Entamoeba encysting cell ultrastructures, such as precysts and mature cysts, have been observed by electron microscopy (Deutsch and Zaman, Reference Deutsch and Zaman1959; Osada, Reference Osada1959; Proctor and Gregory, Reference Proctor and Gregory1973; Eichinger, Reference Eichinger1997; Chavez-Munguia et al., Reference Chavez-Munguia, Cristobal-Ramos, Gonzalez-Robles, Tsutsumi and Martinez-Palomo2003). However, it is difficult to predict the dynamics of ultrastructural changes during Entamoeba encystation by linking the results from different studies because a single time point sample was used in each study.
In this study, to overcome this limitation, we used transmission electron microscopy to analyse a series of samples collected over a short interval time course from an in vitro encystation-inducing E. invadens culture. The serial samples were also analysed by a flow cytometry method using premixed calcofluor (CF) and Evans blue (EB) dyes to confirm the progress of the encystation process (Mi-Ichi et al., Reference Mi-Ichi, Miyake, Tam and Yoshida2018).
Materials and methods
Parasite culture and sample preparations for electron microscopy and flow cytometry
In vitro cultures of E. invadens (IP-1) were routinely maintained, and cyst formation was induced as described (Mi-Ichi et al., Reference Mi-Ichi, Miyake, Tam and Yoshida2018). Briefly, E. invadens trophozoites suspended in encystation medium (6 × 10⁵ cells mL−1) were seeded in 96-well culture plates (240 μL per well) and sealed as described using PARAFILM® (Bemis Company, Inc., Oshkosh, WI) (Suresh et al., Reference Suresh, Ehrenkaufer, Zhang and Singh2016). Then plates were incubated at 26°C for the period indicated. Cells were pelleted by centrifuging the 96-well plates at the indicated time at 440 g for 5 min at 4°C.
For electron microscopy, cell pellets from 24 wells of a 96-well plate were collected in a single 1.5 mL tube using 1 mL phosphate-buffered saline (PBS), and were then centrifuged at 1330 g for 5 min at 4°C. The cell pellet was fixed with 2% glutaraldehyde (25% stock, Nacalai Tesque, Kyoto, Japan) in cacodylate buffer [0.1 m sodium cacodylate containing 1 mm CaCl2 and 1 mm MgCl2 (pH 7.4)] (vol/vol) with rotation for 60 min at 4°C. Cells were then rinsed with cacodylate buffer, and post-fixed with 1% OsO4 (Nacalai Tesque) in cacodylate buffer (wt/vol) for 60 min at 4°C. They were then washed with cacodylate buffer and then dehydrated in a series of ethanol solutions [50, 70, 80 and 90% in deionized water (vol/vol)] followed by acetone solutions [90, 95 and 100% in deionized water (vol/vol)] for 5 min each. Cells were further dehydrated in anhydrous acetone for 40 min, incubated in propylene oxide for 10 min, and embedded in Quetol 651 epoxy resin (Nisshin EM, Tokyo, Japan). The resin-embedded samples were trimmed and sectioned using a diamond knife on an ultramicrotome (Reichert-Jung, Austria). Ultra-thin sections were collected on grids and stained with uranyl acetate and lead citrate. The resulting samples were examined at 80 kV under a transmission electron microscope (JEM-1230; JEOL, Tokyo, Japan). Cells showing ultrastructural characteristics were manually counted in randomly selected images (20 sections, each of which includes one cell, per sampling time).
For flow cytometry, cells pelleted in 96-well plates were treated and processed, and the obtained data were analysed as previously described (Mi-Ichi et al., Reference Mi-Ichi, Miyake, Tam and Yoshida2018).
Excystation was induced as described (Mitra et al., Reference Mitra, Pradel, Frevert and Eichinger2010) with slight modification. In detail, encysted cells in 96-well plates were harvested 72 h post-induction by centrifugation, resuspended in sterile water (240 μL per well), and left at 26°C for 6 h to lyse trophozoites. Cells were then pelleted by centrifugation, resuspended in excystation medium (5 mg/mL bile and 40 mm sodium bicarbonate in LYI-S; 240 μL per well), and incubated at 26°C for 8 h. Excystation rates were determined by counting trophozoites vs total intact cells using a phase-contrast microscope.
Results
The dynamics of ultrastructural changes during E. invadens encystation
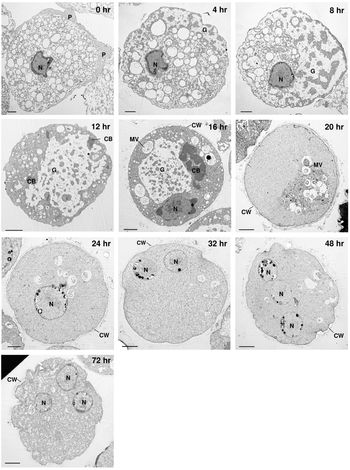
A series of transmission electron microscopy images were obtained from short interval time course samples of in vitro encystation-inducing E. invadens cultures. These images showed that at the 0 h time point, amoeboid cells with pseudopods were trophozoites, which were similar in structure to those described by (Proctor and Gregory, Reference Proctor and Gregory1972) (0 h in Fig. 1), and that after 72 h, cells had become cysts, being surrounded by a thick wall (72 h in Fig. 1). The excysting rate was 55–60%. In addition, the images revealed remarkable ultrastructure, including nuclei (Deutsch and Zaman, Reference Deutsch and Zaman1959; Osada, Reference Osada1959; Ludvik and Shipstone, Reference Ludvik and Shipstone1970), chromatid bodies (Barker and Deutsch, Reference Barker and Deutsch1958; Barker and Svihla, Reference Barker and Svihla1964), cyst walls (Chavez-Munguia et al., Reference Chavez-Munguia, Omana-Molina, Gonzalez-Lazaro, Gonzalez-Robles, Cedillo-Rivera, Bonilla and Martinez-Palomo2007; Chavez-Munguia and Martinez-Palomo, Reference Chavez-Munguia and Martinez-Palomo2011), cytoplasmic glycogen (Deutsch and Zaman, Reference Deutsch and Zaman1959; Osada, Reference Osada1959) and vesicles (Osada, Reference Osada1959; Proctor and Gregory, Reference Proctor and Gregory1972) (see the sections below). These results indicate that the series of images reflects the process of E. invadens encystation. We also counted the number of cells showing these ultrastructural characteristics in randomly selected 20 sections, each of which includes a single cell, to know a profile of ultrastructural changes in the analysed samples (Supplementary Table 1). We then analysed the dynamics of the ultrastructural changes during E. invadens encystation.
Ultrastructure of E. invadens cells undergoing differentiation from trophozoites into cysts. Serial transmission electron microscopy images of encysting cells. The representative images are from more than 20 sections at each time point. Scale bar indicates 2 μm. CB, chromatoid body; CW, cyst wall; G, cytoplasmic glycogen; MV, multivesicular body; N, nucleus; P, pseudopodium; V, vesicle.

These images were also related to changes in live cells, which were monitored as a population by a flow cytometry method (Mi-Ichi et al., Reference Mi-Ichi, Miyake, Tam and Yoshida2018) (Supplementary Fig. 1). The high specificities of the dyes used, EB and CF, which bind to the cell membrane and chitin, respectively, enabled the encystation process to be traced by monitoring the physiological and morphological changes. EB is an indicator of membrane permeability, whereas CF is an indicator of the synthesis and degradation of chitin polymers, the conformational change of the synthesized polymers or both. The flow cytometry results (Supplementary Fig. 1) were consistent with those of (Mi-Ichi et al., Reference Mi-Ichi, Miyake, Tam and Yoshida2018). For instance, the major CF−/EB+ population (proliferating trophozoites) moved to a CF+/EB− population (mature cysts) via CFlow/EB+ and CF+/EB+ populations. CFlow/EBstrong and CF+/EBstrong populations (abnormal cells) were also observed at much lower frequencies. This flow cytometry method also enabled the encystation efficiency to be determined (Mi-Ichi et al., Reference Mi-Ichi, Miyake, Tam and Yoshida2018); the present analyses were performed at 75–85% encystation efficiency.
Nucleus
The nucleus was observed throughout E. invadens encystation. The structure is very different from those of mammalian and yeast cells (Wright, Reference Wright2000). Irregular outlines, the accumulation of many electron-dense chromatin granules under the nuclear membrane, and small central karyosomes were observed (0, 4 and 16 h in Figs 1 and 2A). These observations are consistent with (Osada, Reference Osada1959). Because a single cell was analysed by a single section, not all nuclei are visible, but after 24 h, more than two nuclei per cell started to be seen (32–72 h in Figs 1 and 2B) (Supplementary Table 1). Therefore, nuclear multiplication started around 24 h post encystation induction. Tiny clear spots in chromatin granules (Fig. 2) are probably artefacts produced by the evaporation of substances due to high electron-density, as described by (Osada, Reference Osada1959).
The increasing number of nuclei in a single cell during E. invadens encystation. (A) An irregular nuclear shape in the encysting cell at 20 h. (B) Two nuclei in the cyst at 72 h. Scale bars indicate 2 μm. CB, chromatoid body; CG, chromatin granules; CW, cyst wall; G, cytoplasmic glycogen; HC, heterochromatin; K, karyosomes; N, nucleus.

Vesicles
The cytoplasm of trophozoites was full of vesicles (0 h in Fig. 1). From 4 h, the number of vesicles in the cytoplasm gradually decreased with time, and almost no vesicles were observed at 72 h (4–72 h in Fig. 1). At 8 h, vesicles appeared to be more prevalent towards one side of a cell, and at 20 h, vesicles appeared to be have further congregated together (8 and 20 h in Fig. 1). From 12 h onwards, materials within vesicles became evident (20–72 h in Fig. 1; Supplementary Table 1). Some vesicles encompassed small vesicles (Fig. 3), which were similar to multivesicular bodies (Saito-Nakano et al., Reference Saito-Nakano, Yasuda, Nakada-Tsukui, Leippe and Nozaki2004).
Multivesicular bodies in the E. invadens encysting cell. The image is of an encysting cell at 32 h post-induction. Scale bar indicates 2 μm. CW, cyst wall; MV, multivesicular body.

Autophagosome-like structures
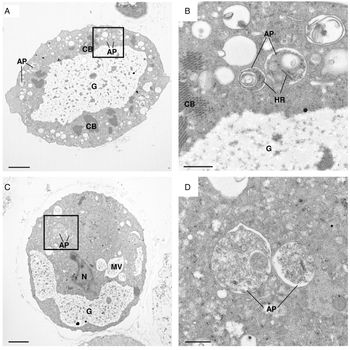
Small structured vesicles involved in the sequestration of cytoplasmic contents (about 500 nm) were observed from 12 to 24 h (Fig. 4). These vesicles differ from multivesicular bodies and resemble autophagosomes in mammalian and yeast cells [Fig. 4, (Baba et al., Reference Baba, Takeshige, Baba and Ohsumi1994)]. Interestingly, there are several genes annotated as autophagy components in E. histolytica and E. invadens genomes, and autophagy plays an important role in encystation (Picazarri et al., Reference Picazarri, Nakada-Tsukui and Nozaki2008, Reference Picazarri, Nakada-Tsukui, Tsuboi, Miyamoto, Watanabe, Kawakami and Nozaki2015); however, whether these components are localized in the observed vesicles needs to be elucidated.
Autophagosome-like structures in E. invadens encysting cells. (A, C) The images are of encysting cells. (B) An enlarged image of the boxed region in (A), which was obtained at 12 h post-induction. (D) An enlarged image of the boxed region in (C), which was obtained at 16 h post-induction. Scale bars in A and C indicate 2 μm, whereas those in B and D indicate 0.5 μm. AP, autophagosome-like structures; CB, chromatoid body; G, cytoplasmic glycogen; HR, helical ribonucleoprotein; MV, multivesicular body; N, nucleus.

Cytoplasmic glycogen
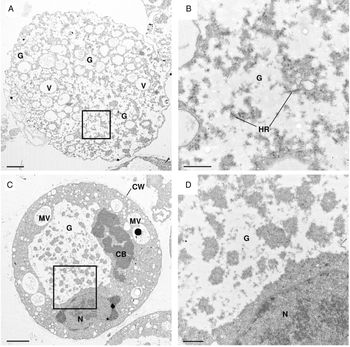
Small accumulations of cytoplasmic glycogen, which are translucent non-geometric shaped regions without membranous boundaries (Deutsch and Zaman, Reference Deutsch and Zaman1959; Osada, Reference Osada1959), were observed in trophozoites. The cytoplasmic glycogen, together with vesicles, almost entirely filled the cytoplasm of trophozoites (0 h in Fig. 1; Supplementary Table 1). From 4 h, glycogen scattered throughout the cytoplasm began to coalesce (Fig. 5A and B; Supplementary Table 1) and occupied almost half of the area of the cytoplasm at 8 h (4 and 8 h in Fig. 1). These structural changes of cytoplasmic glycogen are consistent with those described by (Osada, Reference Osada1959). Notably, at 12 h, glycogen appeared to be have assembled into accumulated structures that were seen until 16 h (12 and 16 h in Figs 1 and 5C and D). From 24 h onwards, glycogen particles were not visible in most sections (Supplementary Table 1).
Change of cytoplasmic glycogen form during E. invadens encystation. Glycogen scattered around the cytoplasm (A) coalesced (C) during encystation. (B) An enlarged image of the boxed region in (A), which was obtained at 4 h post-induction. (D) An enlarged image of the boxed region in (C), which was obtained at 16 h post-induction (the same image as Fig. 1, 16 h). Scale bars in A and C indicate 2 μm, whereas those in B and D indicate 0.5 μm. CB, chromatoid body; CW, cyst wall; HR, helical ribonucleoprotein; G, cytoplasmic glycogen; MV, multivesicular body; N, nucleus; V, vesicle.

Chromatoid bodies
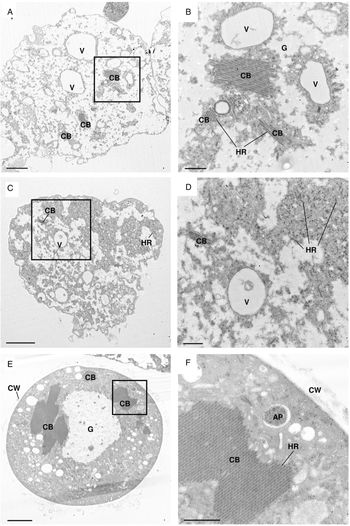
Chromatoid bodies are rod- or bar-shaped cellular inclusions thought to be composed of RNA and protein, but their exact function in Entamoeba cells remains elusive (Manna and Singh, Reference Manna and Singh2019). Chromatoid bodies arise by the process of aggregation of small helical ribonucleoproteins (Siddiqui and Rudzinska, Reference Siddiqui and Rudzinska1963). Up to 12 h, small chromatoid bodies of <2 nm in length were observed in the cytoplasm (Fig. 6A–D; Supplementary Table 1). From 12 h, larger forms of chromatoid bodies ⩾2 nm in length appeared and became most numerous between 16 and 20 h (Fig. 6E and F; Supplementary Table 1). Chromatoid bodies were frequently observed up to 20 h, but were rare from 32 h onwards (Supplementary Table 1).
Change of chromatoid body size during E. invadens encystation. (A, C) Chromatoid bodies of <2 nm in length at their longest point. (E) Chromatoid bodies ⩾2 nm in length at their longest point. (B) An enlarged image of the boxed region in (A), which was obtained at 4 h post-induction. (D) An enlarged image of the boxed region in (C), which was obtained at 8 h post-induction. (F) An enlarged image of the boxed region in (E), which was obtained at 12 h post-induction. Scale bars in A, C, and E indicate 2 μm, whereas those in B, D, and F indicate 0.5 μm. AP, autophagosome-like structures; CB, chromatoid body; CW, cyst wall; G, cytoplasmic glycogen; HR, helical ribonucleoprotein; V, vesicle.

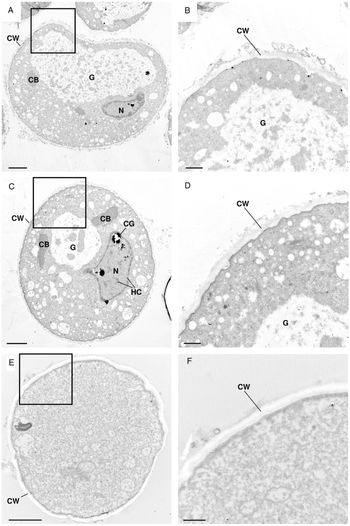
Cyst walls
Fragmented electron-dense structures surrounding the surface of rounded cells were observed from 12 h (Fig. 7A–D). This structure is plausibly an intermediate appearing during the synthesis of the cyst wall. Cyst walls could be seen from 20 h onwards as previously described (Chavez-Munguia et al., Reference Chavez-Munguia, Omana-Molina, Gonzalez-Lazaro, Gonzalez-Robles, Cedillo-Rivera, Bonilla and Martinez-Palomo2007; Chavez-Munguia and Martinez-Palomo, Reference Chavez-Munguia and Martinez-Palomo2011). They have connected forms of the fragmented structures that became thick and coated the cell (Fig. 7E and F). Small cytoplasmic vesicles possessing granular material and located close to the plasma membrane were observed at 24 h (24 h in Fig. 1). These vesicular structures were similar to those reported in E. histolytica cysts (Chavez-Munguia and Martinez-Palomo, Reference Chavez-Munguia and Martinez-Palomo2011).
Structural changes to cyst walls during E. invadens encystation. (A, C) Putative cyst wall intermediates. (E) Thick-coated cyst wall. (B) An enlarged image of the boxed region in (A), which was obtained at 16 h post-induction. (D) An enlarged image of the boxed region in (C), which was obtained at 20 h post-induction. The image shown in (C) is the same as Fig. 2A. (F) An enlarged image of the boxed region in (E), which was obtained at 150 h post-induction. Scale bars in A, C, and E indicate 2 μm, whereas those in B, D, and F indicate 0.5 μm. CB, chromatoid body; CG, chromatin granules; CW, cyst wall; G, cytoplasmic glycogen; HC, heterochromatin; N, nucleus.

Cyst wall formation can also be monitored by a flow cytometry method using two dyes, CF and EB (Mi-Ichi et al., Reference Mi-Ichi, Miyake, Tam and Yoshida2018). The profile of CF and EB signal changes is reproducible (Mi-Ichi et al., Reference Mi-Ichi, Miyake, Tam and Yoshida2018). The CF signal, the change of which reflected the amount of chitin and/or the confirmation of its polymer, stayed at a low level at 0–8 h. At 12 h, the signal shifted from a low level to a higher level, becoming obvious from 16 h. From 24 h onwards, the signal stabilized (Supplementary Fig. 1). This CF profile indicated that chitin synthesis started after 8 h and reached a maximum level at 16–24 h. This CF profile was consistent with the process of cyst wall formation observed by electron microscopy, where fragmented electron-dense structures on the cell surface became visible at 16 h and mature cyst walls were seen from 20 h onwards (Fig. 1; Supplementary Table 1). Taken together, the results indicate that cyst wall formation starts after 12 h and is completed within 20 h of encystation induction.
Discussion
Several electron microscopy studies have been published that show various ultrastructural features in encysting E. invadens and E. histolytica cells at a single time point (Deutsch and Zaman, Reference Deutsch and Zaman1959; Osada, Reference Osada1959; Proctor and Gregory, Reference Proctor and Gregory1973; Eichinger, Reference Eichinger1997; Chavez-Munguia et al., Reference Chavez-Munguia, Cristobal-Ramos, Gonzalez-Robles, Tsutsumi and Martinez-Palomo2003). However, it is difficult to predict the dynamics of ultrastructural changes during Entamoeba encystation by combining the results from these different studies. Therefore, we performed a transmission electron microscopy analysis of a series of E. invadens encysting cells prepared from short interval time course samples of an in vitro culture. We revealed the dynamics of ultrastructure changes during E. invadens encystation. Furthermore, we combined a flow cytometry method to monitor the level of cell differentiation in a population of live cells (Mi-Ichi et al., Reference Mi-Ichi, Miyake, Tam and Yoshida2018). Our approach enabled us to refine the timing for cyst wall formation because the electron microscopy and flow cytometry monitored cyst wall formation from different perspectives. Electron microscopy traced structural changes of the cyst wall per se, whereas flow cytometry traced changes in live cells that reflected the process of cyst wall formation. The processes examined were the synthesis of a major component of the cyst wall, chitin, and the decrease of substance permeability.
Our results predict that cyst wall formation follows cytoplasmic glycogen disappearance. This sequence indicates the functional linkage of these two processes because cytoplasmic glycogen disappearance reflects the degradation of stored glycogen to provide a substrate for the synthesis of chitin. Glycogen hydrolysis provides D-glucose-1-phosphate via D-glucose, which is an essential substrate for the chitin synthetic pathway (Samanta and Ghosh, Reference Samanta and Ghosh2012). Intriguingly, in E. histolytica, the cyst-like structure formation was impaired by knockdown of the D-glucosamine 6-phosphate isomerase gene, which inhibits chitin synthesis (Aguilar-Díaz et al., Reference Aguilar-Díaz, Laclette and Carrero2013).
Furthermore, the predicted timing of cyst wall formation, as described above, can be linked to the dynamics of other remarkable ultrastructure changes, such as nuclear division. The initiation of nuclear multiplication, which was observed by electron microscopy, occurs after cyst wall formation. This interpretation is consistent with that of (Eichinger, Reference Eichinger1997); nuclear division starts after the cyst wall has formed.
In conclusion, we showed the dynamics of cell component changes during Entamoeba encystation, and we predicted the sequence of the structural changes; glycogen accumulation precedes the cyst wall formation. On completing the cyst wall formation, multivesicular bodies and autophagosome-like structures become evident. After becoming a mature cyst, nuclear division occurs (see Fig. 8). Hence, the present study provides a reference for studying the sequential molecular events during E. histolytica as well as E. invadens encystation.
Scheme showing the timing of ultrastructural changes during E. invadens encystation. Arrows indicate the period during which each ultrastructural change was observed. AP, autophagosome-like structures; CB, chromatoid body; CG, chromatin granules CW, cyst wall; G, cytoplasmic glycogen; HC, heterochromatin; HR, helical ribonucleoprotein; K, karyosomes; MV, multivesicular body; N, Nucleus; V, vesicle.

Supplementary material
The supplementary material for this article can be found at https://doi.org/10.1017/S0031182020001079.
Acknowledgements
This work was partly conducted at the Joint Usage/Research Center on Tropical Disease, Institute of Tropical Medicine, Nagasaki University. We thank Dr Sharmina Deloer, Ms. Ritsuko Yoshida, Ms. Minako Suzuki, and Ms. Mayuko Matsunaga for technical assistance. We thank Jeremy Allen, PhD, from Edanz Group (www.edanzediting.com/ac) for editing a draft of this manuscript.
Financial support
Eman Abdelazeem Abuelwafa Mousa received a PhD fellowship from The Egyptian Ministry of Higher Education. This work was supported by the Ministry of Education, Culture, Sports, Science and Technology of Japan (Grants-in-Aid for Scientific Research 18H04675 to F.M), AMED-J-PRIDE (JP19fm0208025 to H.Y., S.H. and F.M.), and the Joint Usage/Research Center on Tropical Disease, Institute of Tropical Medicine (NEKKEN), (2017-Ippan-12, 2018-Ippan-17, and 2020-Ippan-17 to F.M.).
Conflict of interest
None.
Ethical standards
Not applicable.