


1. Introduction
Most of the ice discharged from the Antarctic ice sheet flows into thick, floating ice shelves that have formed in protective embayments or between shoaling seabed, where the ice shelf runs aground to form ice rumples and ice rises. Shear between ice shelves and their sides and grounded areas causes a ‘back force’ that inhibits ice-shelf stretching further upstream and allows the ice shelf to become thicker than if it were unrestricted. Whether this back force can also have a substantial effect on the dynamics of glaciers that flow into the ice shelf is the subject of continuing debate. Early suggestions, that ice shelves buttress their tributary glaciers and that their weakening would result in grounding-line retreat and increased glacier discharge (Reference HughesHughes, 1972; Reference WeertmanWeertman, 1974; Reference ThomasThomas, 1977; Reference MercerMercer, 1978), require ice-shelf back forces to affect glacier dynamics over large distances. Later, these suggestions were discounted, based on the contention that glacier behavior is determined mainly by local conditions, and thus is almost immune to distant perturbations (Reference HuybrechtsHuybrechts, 1990; Reference Hindmarsh and PeltierHindmarsh, 1993, Reference Hindmarsh1996), that grounding-line retreat would be inhibited by increased advection of thicker ice down accelerating glaciers (Reference Van der VeenVan der Veen, 1985) and that force perturbations would be balanced over quite short distances by the effects of changing basal and marginal drag as velocities change (Reference Van der VeenVan der Veen, 2001). However, recent evidence of rapid acceleration of tributary glaciers soon after ice-shelf break-up along the northeastern side of the Antarctic Peninsula (Reference Rott, Rack, Skvarca and AngelisRott and others, 2002; Reference Angelis and SkvarcaDe Angelis and Skvarca, 2003) prompts reconsideration of this issue. Here, we apply a simple force-perturbation model to Pine Island Glacier (PIG), assuming that changes in the back forces are transmitted swiftly up-glacier, in order to estimate the magnitude of such changes and to investigate their cause.
2. Force-Perturbation Model
The approach adopted here is based on two main assumptions: that glaciers ‘feel’ the effects of force perturbations over long distances; and that most of a glacier can be regarded as an ice shelf with a thin veneer of shearing ice separating it from its bed and sides (Reference ThomasThomas, 2004). For this ice, motion is primarily by longitudinal stretching, and the longitudinal strain rate (εx) can be approximated by an equation similar to that derived for ice shelves:  , where ρ is ice density, g is gravity acceleration, k is determined by ice hardness and the shape of the strain-rate tensor, n ≌ 3 for conditions typical on glaciers, H is ice thickness, and P is total back pressure acting on the glacier at x, resulting from back forces caused by downstream basal and lateral drag and forces exerted by sea water on any floating extension (Reference ThomasThomas, 1973). Changes (Δ) in any of the terms on the righthand side of this equation then result in a change in εx and hence glacier velocities, expressed by:

where post-perturbation values are primed. Writing the back pressure as:

where –F is the back force per unit width, this can be simplified to:

and the back-force reduction per unit glacier width is:

The term k is:

where B is the depth-averaged ice-stiffness parameter, and θ = (1 + γ + γ 2 + δ 2 + ω 2)/(2 + γ)3 with γ = εy/εx , δ = εxy/εx , ω = εxz/εx , with εy lateral strain rate, and εxy and εxz shear strain rates in the horizontal and vertical planes. Here, we assume shear strain rates are small, as should be the case along a glacier center line and for fast-moving ice with low basal shear stresses. For the short section of more steeply sloping PIG this is unlikely, but even here nearly all the shear is probably within the bottom 10% of the glacier, with the above equations applying approximately to most of the ice above, where the main effect of shear is to increase the value of θ and thus effectively to soften the ice.
To a first approximation, these equations should apply to all glaciers, with ΔF representing the net effect of downstream force perturbations, including those associated with changing basal and marginal drag as velocities change. Such changes provide a negative feedback to the force perturbation, and their effect progressively increases with distance inland. However, estimates of ΔF inferred from Equation 1 include the effects of this negative feedback. For ice that is frozen to the bed, velocity changes can be related comparatively simply to changing shear stresses at the glacier bed and its margins, but for a fast-sliding glacier the relationship may be far weaker. Consequently, we expect a force perturbation to have most impact on faster-moving parts of a glacier, with a progressive decrease further inland, where near-basal ice shear predominates.
3. Application to Pine Island Glacier
Pine Island Glacier (PIG) is one of the most active glaciers in the world. With speeds exceeding 2 km a–1 across its 30 km width, it discharges about 80 km3 of ice per year (Reference RignotRignot and others, 2004) into the Amundsen Sea from West Antarctica (Fig. 1).
Pine Island Glacier, showing the CECS/NASA flight track (white line) approximately along the glacier center line, as defined by the velocity maxima. Colors depict velocities inferred from InSAR analysis of ERS data. The 1996 grounding line is shown by the solid line approximately 60 km from the western end of the flight track.
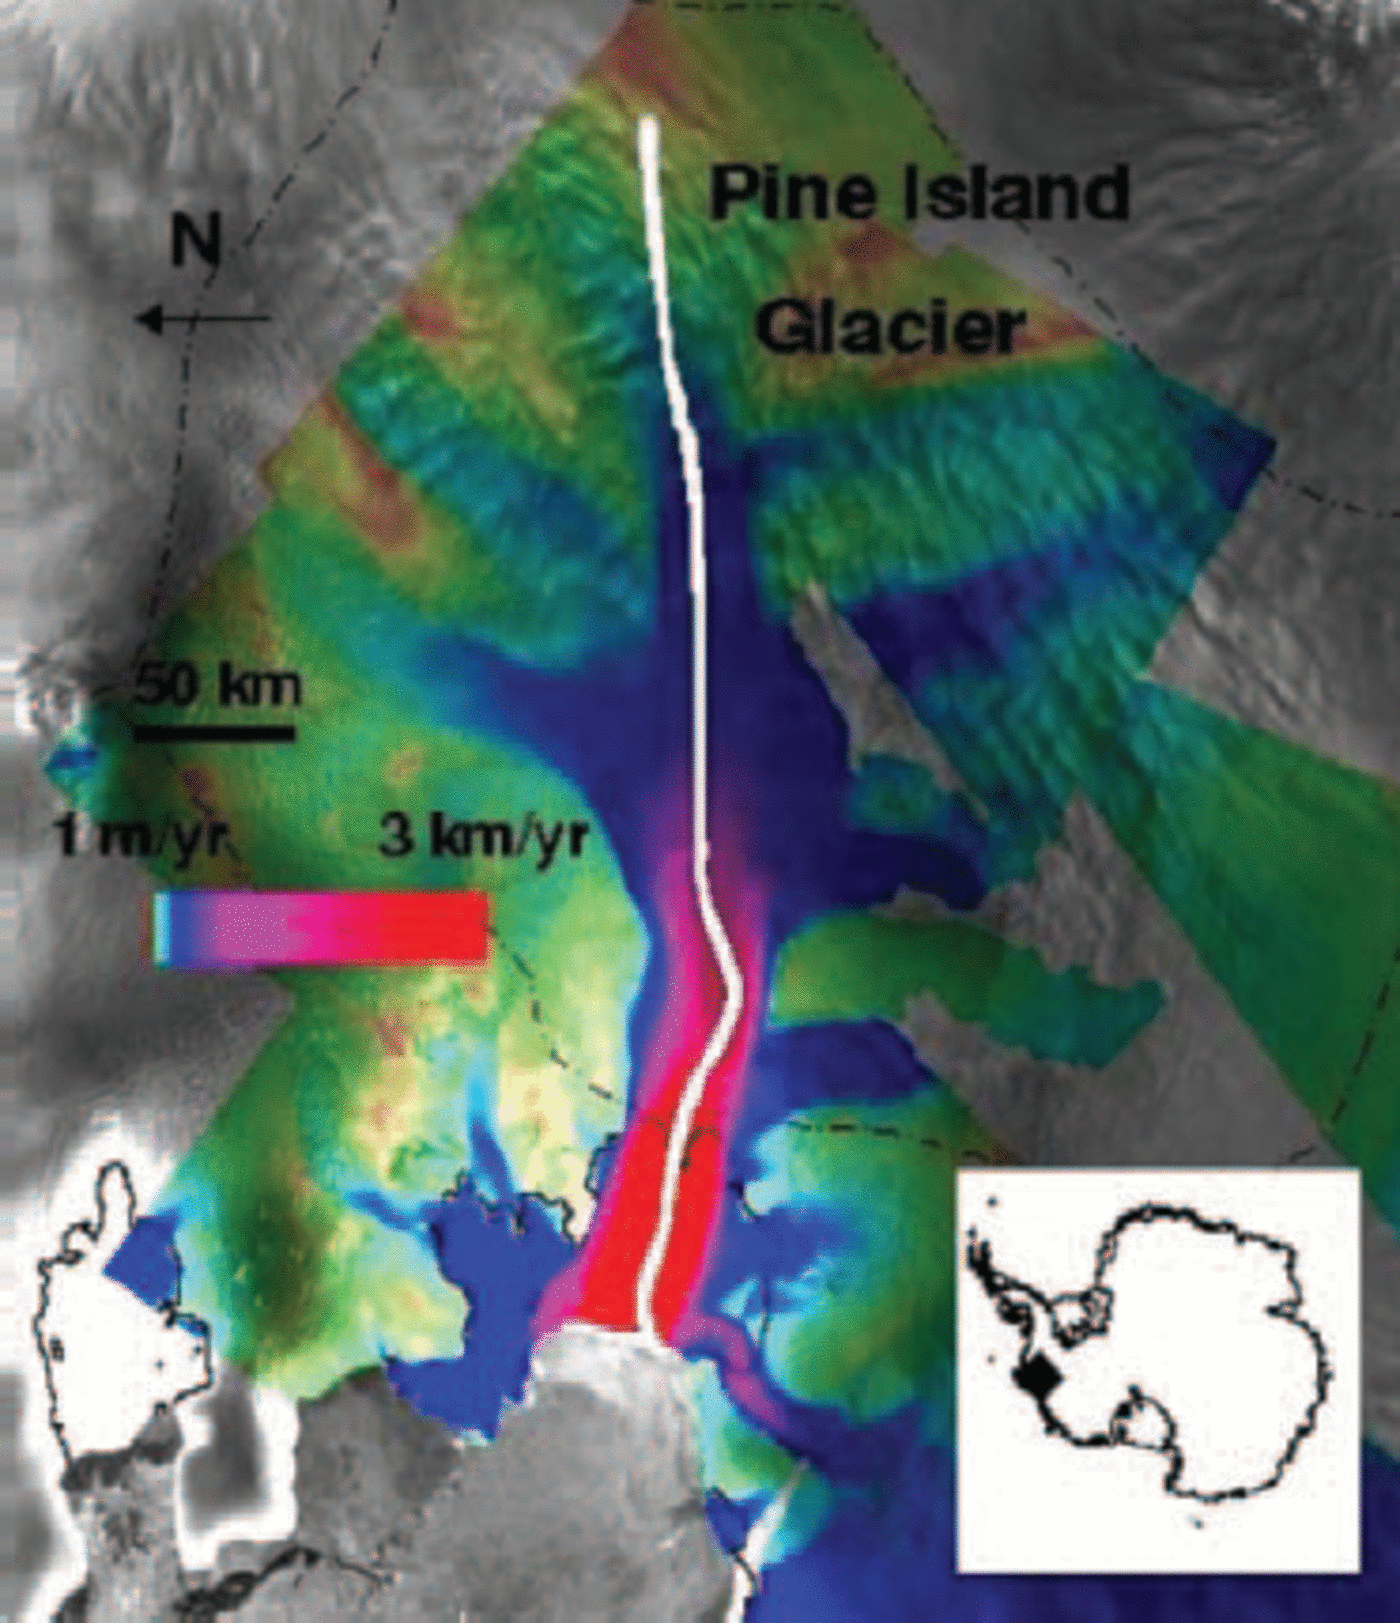
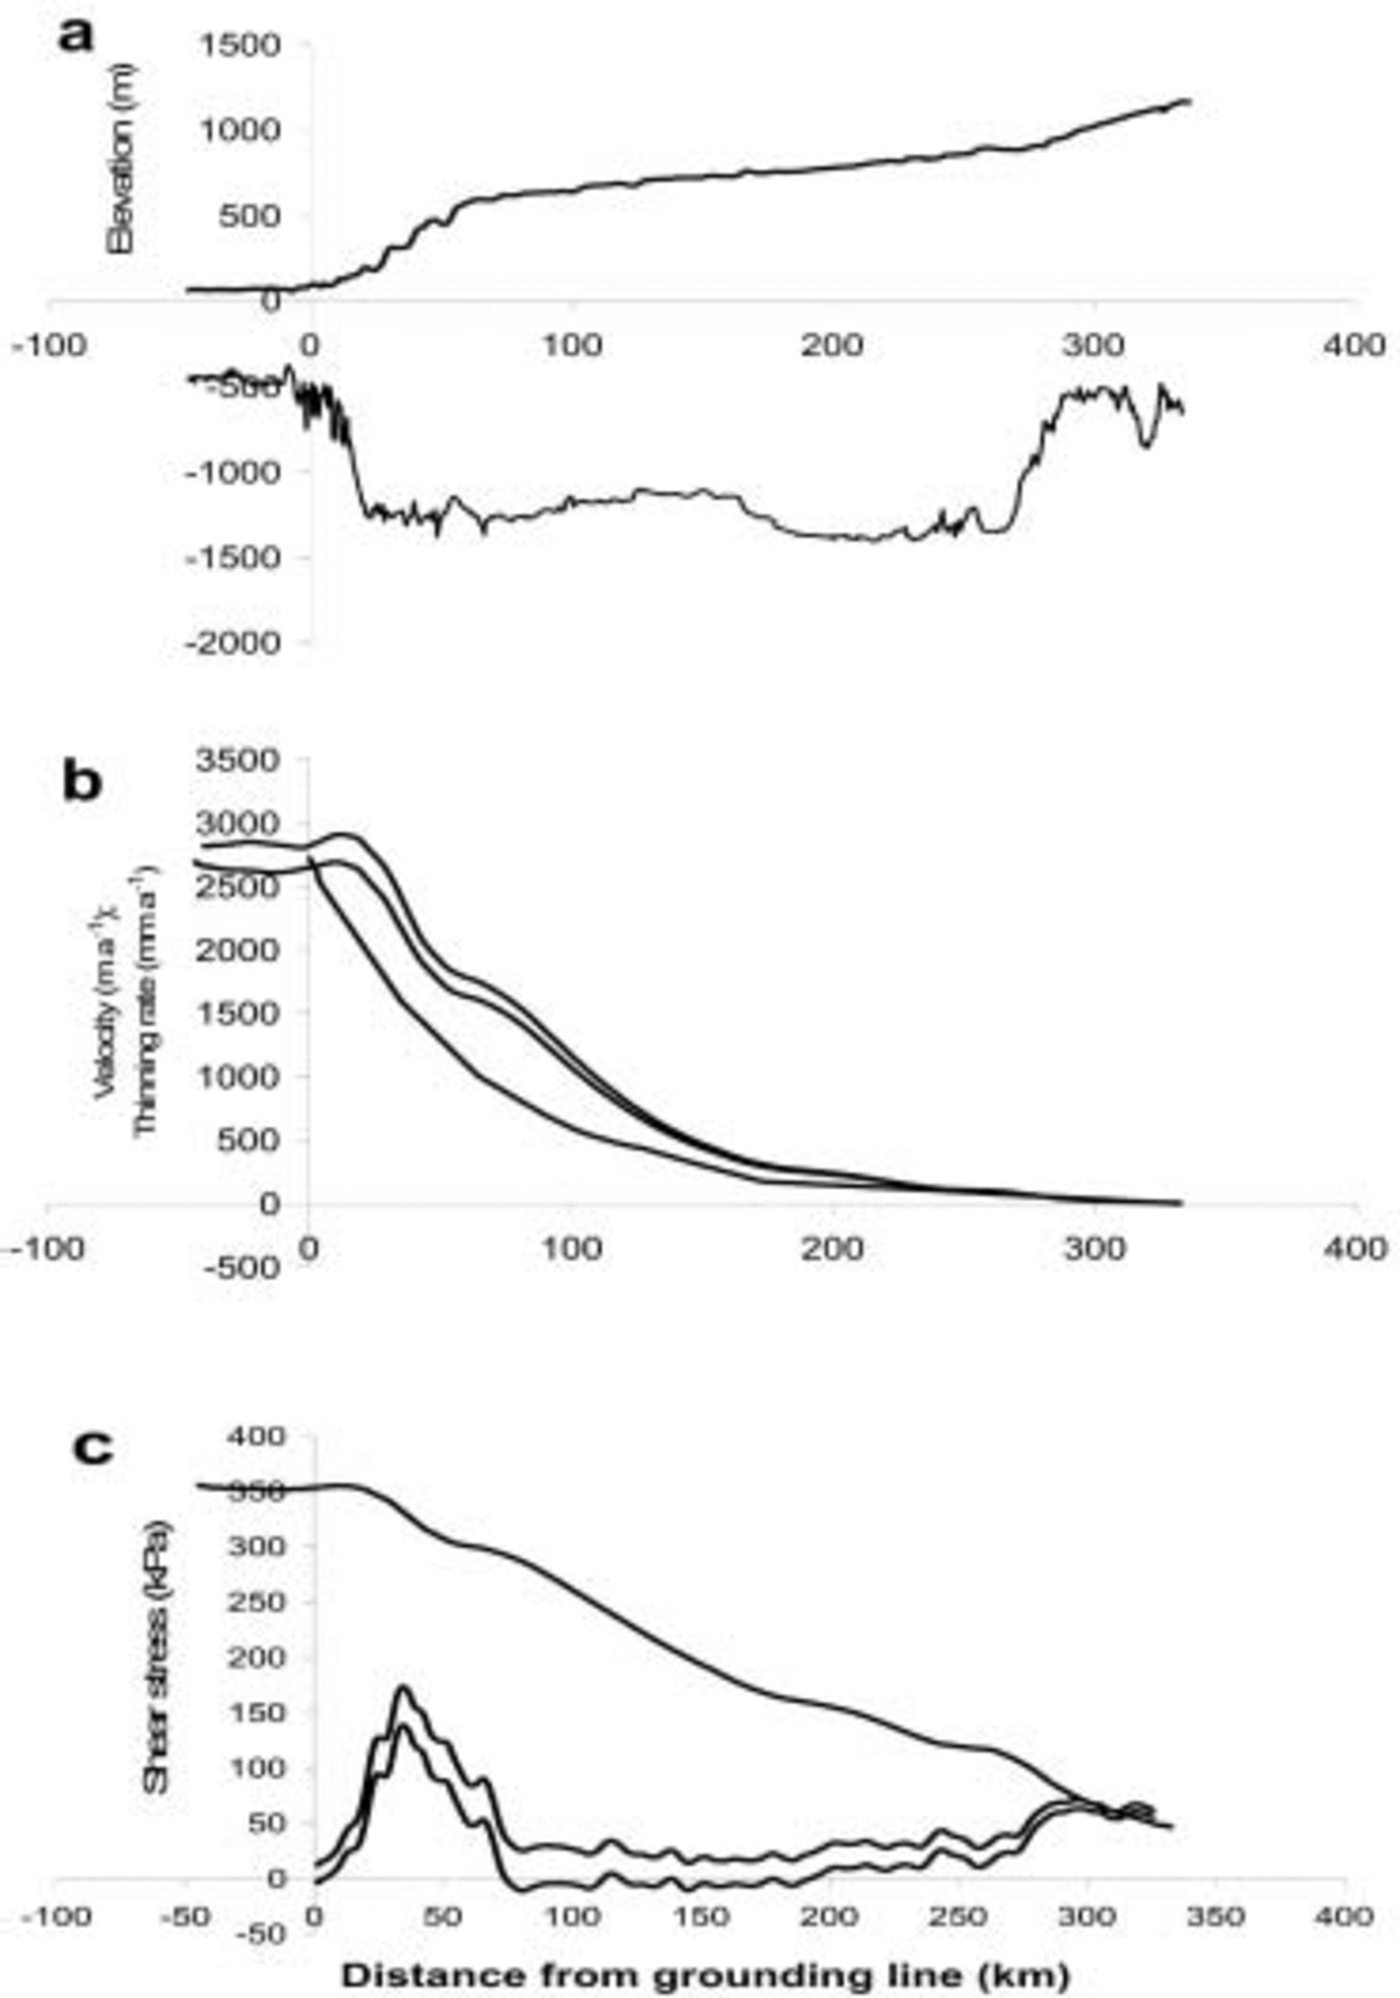
PIG flows into a 60 km long ice shelf that is bounded by grounded ice. Analyses of radar-altimeter and interferometric SAR (InSAR) data from European Remote-sensing Satellites show that the ice shelf, glacier and much of its catchment basin have thinned substantially over the last few years (Reference Shepherd, Wingham and JShepherd and others, 2001; Reference ZwallyZwally and others, 2002), the grounding line receded by several km between 1992 and 1996 (Reference RignotRignot, 1998), and glacier velocities have increased by 20% or more since the 1970s (Reference Rignot, Vaughan, Schmeltz, Dupont and MacAyealRignot and others, 2002; Reference Joughin, Rignot, Rosanova, Lucchitta and BohlanderJoughin and others, 2003). The InSAR analyses yield spatially dense maps of ice velocity on the glacier, from which strain rates can be inferred, and previously sparse thickness measurements have been enhanced by joint Centro de Estudios Cientificos de Chile (CECS)/NASA airborne surveys in December 2002. Figure 2 shows the glacier profile based on these measurements, velocities and thinning rates inferred from InSAR and European Remote-sensing Satellite (ERS) altimeter data, and values of basal (τb) and marginal (τm) shear stresses estimated using a simple model for center-line glacier velocity (e.g. Reference Van der VeenVan der Veen, 1999, p. 125–127) adopted by Reference Joughin, Rignot, Rosanova, Lucchitta and BohlanderJoughin and others (2003) for similar calculations on PIG.
(a) PIG surface and bed profiles. (b) Velocities and thinning rates along the glacier: upper line is velocity in 2000; middle line is velocity in 1996; bottom line is average thinning rate, 1992–99. (c) Calculated marginal (upper line), driving (middle line) and basal (lower line) shear stresses.

so that

and τb can be estimated assuming the driving stress (ρgHα) is balanced by basal and marginal stresses:

where (Hα)a is the value of Hα averaged across glacier width W, H m is ice thickness at the glacier margin, Vc is center-line velocity, and α is surface slope. We assume that n=3, B = 500 kPa a1/3 (corresponding to a temperature of about –18˚C) and W= 30 km at all points along the glacier, and thickness is constant across the glacier. The assumptions make these very approximate estimates. Upstream widening of the glacier would slightly decrease estimates of marginal shear stress and increase basal shear stresses, which would also be increased if the glacier is thinner at the margins. Nevertheless, it appears that basal shear stresses are low near the grounding line, and very low for most of the glacier upstream of about 70 km inland from the grounding line, in agreement with Reference Joughin, Rignot, Rosanova, Lucchitta and BohlanderJoughin and others (2003), with high values only for the steeply sloping region downstream from 70 km. This provides support for our assumption of ice-shelf dynamics for most of the glacier. By contrast, marginal shear stresses are extremely high for the ice shelf and much of the glacier.
InSAR measurements made in 1996 and 2000 (Reference Rignot, Vaughan, Schmeltz, Dupont and MacAyealRignot and others, 2002) show an approximately 10% increase in velocities along the 100 km of the grounded part of PIG inland from the grounding line (Fig. 2), and we use these observations to estimate changes in back pressure during this period. However, because this velocity increase was part of a continuing acceleration, total back-pressure changes on PIG during the recent past should be substantially larger. The velocity measurements give estimates of εx for 1996 and 2000. We calculated values of εy based on volume continuity, which requires that the vertical strain rate

where A is surface accumulation rate, M is basal melting rate (both expressed as ice thickness per unit time), ∂H/∂t is the glacier thickening rate, V is velocity, H is glacier thickness, and ∂H/∂x is thickness slope in the direction of ice motion. After a time interval Δt, all the variables in this equation change to primed values with, for instance, A' = A + ΔA.

and

With Δ(∂H/∂x) = Δt∂(∂H/∂t)/∂x, and assuming no change in thickening rates during the interim (Δ(∂H/∂t = 0), we estimated values of εy for 1996 from Equation 1, and for 2000 from Equation 1. We set A = 0.4 m ice a–1 (Reference Vaughan, Alley and BindschadlerVaughan and others, 2001), and calculated maximum values of M assuming that all heat generated by motion at the bed is used for melting, using values of basal shear stress calculated from Equation 1. Although there is considerable uncertainty in our estimates of both A and M, other terms in these equations predominate, and final results are scarcely affected by this uncertainty. To solve the equations, we used measurements of H and ∂H/∂x along CECS/NASA flight-lines that passed approximately along the glacier center line, as defined by the line of maximum velocity. Estimates of ∂H/∂t are for 1992–99, from Reference Shepherd, Wingham and JShepherd and others (2001). Our estimates of ΔV extended only about 100 km upstream from the grounding line, where ΔV/V was 9%, similar to values further seaward. Consequently, we assumed a linear decrease in ΔV/V to zero 350 km inland from the grounding line. We also calculated ΔF with ΔV/V = 0.09 for this entire region, with little impact on resulting values. The estimated strain rates are shown in Figure 3.
Longitudinal strain rates derived from observed 1996 velocities, and corresponding lateral strain rates calculated as described in the text.

Using these data, we solved Equation 1 to calculate values of ΔF along PIG shown in Figure 4. We assumed that the ice hardness (B) did not change, and adopted a value of B = 500 kPa a1/3. Solutions for B = 400 kPa a1/3 and 600 kPa a1/3 gave values of ΔF that differed by <7% from those in Figure 4. Lacking accurate estimates of thickening rates and basal melting rates on the ice shelf, we were unable to include this part of the glacier in the analysis.
Force reduction/unit width (ΔF) on PIG, consistent with velocity increases and thickness changes between 1996 and 2000, plotted against distance from the grounding line. Uncertainty limits are large, so the variation of ΔF is probably adequately represented by the bold line.

Errors in solving Equation 1 are determined by uncertainty in thinning rates and strain rates. They are typically about 10 MN m–1, but larger in areas of strong lateral convergence or longitudinal compression where γ < –1. In such areas the magnitude and even the sign of θ (and therefore k and k') are highly sensitive to small errors in strain rates. For PIG, this applies within about 10 km of the grounding line, where results should be viewed with caution. The region of high basal shear stress shown in Figure 2 coincides closely with the peak in back-force reduction, and here shear strain rates (εxz) near the bed may be as large as longitudinal strain rates, but decrease rapidly above the bed. This would increase the value of θ, making the calculated peak values of ΔF perhaps 10% too high. Inland of about 200 km, the force reduction progressively decreases to zero near 350 km, resulting from the assumption that velocity increase and thinning rates decrease to zero here.
Total back-force reduction is the product of ΔF and local glacier width, which is about 30 km over the first 50 km of
the glacier. Further inland, large tributaries join the glacier, increasing the width over which the force reduction is distributed. This is consistent with the decrease in ΔF in this region, but much of this decrease reflects the effects of increasing marginal drag as velocities increased. Indeed, the 10% velocity increase between 1996 and 2000 should have increased marginal drag by about 3%, and this was probably responsible for most of the 60 MNm–1 decrease in ΔF from its maximum value at 35 km inland from the grounding line to its value 65 km further inland. This implies that:

where (H m τ m)a is the value of (H m τm) averaged over 65 km and W ffi 30 km, so that

From Figure 2, the marginal shear stress averaged over this region is about 300 kPa, which would require the average marginal ice thickness to be 1500 m, compared to the approximately 1800m measured at the glacier center line (Fig. 2). The CECS/NASA thickness measurements certainly show marginal ice to be thinner, but it is also possible that τ m is less than shown in Figure 2 if marginal ice is softened by strain heating and/or ice-fabric development.
4. Discussion
The results in Figure 4 show a rapid increase in ΔF from perhaps 30 MN m–1 at the grounding line to about 100 MNm–1 35 km inland, with most of the increase in the first 25 km. This suggests that much of its cause lies within this region, which is an area of partial grounding (Reference Thomas, Hansen and TakahashiThomas, 1984; Reference Corr, Doake, Jenkins and VaughanCorr and others, 2001) known as an ‘ice plain’. Using measurements made in 1981 and 1998, Reference Corr, Doake, Jenkins and VaughanCorr and others (2001) showed that most of this ice plain had surface elevations <50m above that at which the ice would become afloat (flotation elevation). The CECS/NASA observations in late 2002 show it to be <40m above flotation elevation (Fig. 5). Although the difference could reflect uncertainties in some of the earlier data, it is consistent with the high thinning rates inferred for this part of the glacier from satellite radar-altimeter data (Reference Shepherd, Wingham and JShepherd and others, 2001). A probable explanation for the back-force reduction is progressive ungrounding of this ice plain. Estimated basal shear stresses along our flight-line over the ice plain (Fig. 2) averaged almost 30 kPa, contributing a total back force of 700 MNm–1 in 2002. Thus, a back-force reduction of 70 MN m–1 between 1996 and 2000 represents 10% of potential future reductions if the recent thinning of about 2 ma–1 continues and the entire ice plain becomes afloat.
Profiles near the grounding line of PIG, based on measurements in December 2002. The upper line is the surface elevation; the middle line is the ‘hydrostatic elevation’, at which the glacier would become afloat; and the lower line is the difference between these two elevations, which is the thinning required to float the ice. Over the 25 km nearest the grounding line, the maximum surface elevation above hydrostatic elevation is <40 m, with an average value of 20 m. This region is referred to as an ‘ice plain’, and within it there are sections that are either floating or very close to flotation. Continued thinning will enlarge these sections, and the most seaward 10 km of the ice plain appears to be particularly vulnerable, indicating a probable 10 km grounding-line retreat very soon, followed by delayed flotation of the remaining ice plain. Such intermittent ungrounding could explain the sporadic velocity increases reviewed by Reference Joughin, Rignot, Rosanova, Lucchitta and BohlanderJoughin and others (2003).

Near the grounding line, errors are large, but the decreasing trend in ΔF towards the grounding line exhibited by results further inland suggests that the grounding-line value is small. An independent estimate can be obtained from observations showing that the ice shelf thinned by about 2.5 ma–1 during the 1990s (personal communication from H. J. Zwally, 2003). The ice shelf is approximately 60 km long, so the area of ice shelf in contact with its margins decreased by about 0.3 km2 a–1. Assuming a marginal shear stress of 350 kPa, as shown in Figure 2, this represents a total decrease in back force of 100 GNa–1. Distributed over the glacier width of 30 km, this is equivalent to an average back-force decrease of 3.5 MNm–1 a–1, or ΔF ≌ 14 MN m–1 between 1996 and 2000. Consequently, the effects of ice-shelf thinning are consistent with low ΔF at the grounding line. But a change in ice-shelf length also affects ΔF. The ice shelf is about 500 m thick near its calving front, so removal of 1 km in length represents a reduction in marginal area by 1 km2 and a back-force reduction of 10 MN m–1. In reality, the ice front actually advanced between 1996 and 2000 (Reference RignotRignot, 2002). But a large transverse rift was observed in 2000, several km upstream from the 1996 ice-front position. Moreover, thinning of the ice shelf may be freeing it from the buffering influence of an ice rise on the northern side of the ice shelf about 5 km upstream from the rift. Consequently, it is not clear whether changes in the ice shelf between 1996 and 2000 would have increased or decreased back forces at the grounding line.
Over the longer term, the calving front of the ice shelf has remained broadly in the same position since 1947 (Reference RignotRignot, 2002), but with new rifts forming during the 1990s, and substantial retreat of ice shelf immediately to the north. These changes may have been associated with increased basal melting postulated by Reference Rignot and JacobsRignot and Jacobs (2002), reducing ice-shelf back pressure sufficiently to increase creep-thinning rates which, together with the basal melting, would explain the grounding-line retreat observed between 1992 and 1994. Since then, continued thinning has progressively ungrounded the ice plain, and another substantial retreat of the grounding line is likely within the next few years. Overall, the sequence of ice-shelf thinning, grounding-line retreat and ice-plain ungrounding was probably initiated by increased basal melting associated with a warmer ocean.
Observations reviewed by Reference Joughin, Rignot, Rosanova, Lucchitta and BohlanderJoughin and others (2003) show that PIG has been accelerating since at least the late 1970s/early 1980s, with a total velocity increase of >20%. Our analysis refers to just 4 years of this period, when about half of the velocity increase occurred. But over the longer period, the glacier probably thinned more than between 1996 and 2000, implying, from Equation 1, that the total force reduction since 1980 is more than double the values shown in Figure 4.
5. The Future
The future of PIG is also of interest. If there is no additional force reduction, the glacier will thin sufficiently for the force reduction to be balanced by a drop in the driving force, determined by glacier thickness, until  and glacier velocities decrease towards their pre-perturbation values. By then the glacier will be thinner, so new equilibrium velocities will be proportionally higher, in order to balance upstream snowfall. An upper estimate of future thinning (–ΔH
f) can be obtained from Equation 1, by setting
 and assuming ΔH
f
/H ≪ 1, to yield:

For the region where ΔF reaches a maximum of about 100 MN m–1, H ≌ 1700 m, and ΔHf ≌ –7m in an area where recent thinning rates have approximated 2ma–1. Continued thinning at this rate will soon balance the force reduction and lead to a reduction in glacier velocities if there is no further increase in ΔF. But thinning will also cause a large fraction, if not all, of the remaining ice plain to
become afloat within the next few years, increasing the maximum value of ΔF above its value in 2002. This increase would be less than the 700 MNm–1 currently exerted by the ice plain because associated velocity increases would also increase shear stresses at the sides of the ice shelf, as implied by Equation 1. In order to estimate velocity increases associated with this, we solved Equation 1 along the glacier (x), with ΔF(x) decreasing up-glacier, from its maximum value (ΔF
m) immediately upstream of the ice plain, in a manner similar to that depicted in Figure 4. Initially, we solved Equation 1 for instantaneous flotation of the ice plain (ΔH = 0), assuming no increase in marginal drag (ΔF
m = 700 MN m–1), and that velocity increase would be sufficient to make  so that θ' ≌ 0.125. We used the calculated values of
 to improve estimates of °0 and hence θ' in order to calculate an improved velocity profile, and repeated this several times to converge to the upper curve in Figure 6.
Clearly, instant flotation of the ice plain is unrealistic, but it allowed us to estimate upper values for ice-thinning rates along the glacier, which were then used to infer average values of thinning rates over the period needed to float the ice plain (ΔH= –40 m). This procedure was also repeated several times, altering θ' each time, until assumed thinning rates and values of θ' were consistent with those implied by the velocity increase associated with ΔF m, with and without taking account of increased marginal drag consistent with Equation 1 and corresponding to the calculated velocity increase. The results (Fig. 6) show velocities at the inland limit of the ice plain increasing to 15 kma–1 for instantaneous flotation of the ice plain, and almost 6 km a–1 after 8 years of progressive ungrounding if there is no increase in marginal drag. Taking account of increasing marginal drag, calculated velocities rise to 3.6 km a–1 over the 11 year period needed to thin the ice sufficiently for complete flotation of the ice plain. Although this calculation is very approximate, such a velocity increase will be readily apparent, providing an early opportunity to test results from the simple analysis adopted here.
PIG ice velocities. Curve a was derived from 1996 data; b shows calculated velocities for instantaneous flotation of the ice plain; c shows velocities after progressive ungrounding of the ice plain over about 8 years, neglecting negative feedback from increasing marginal shear stresses; and d shows velocities after progressive ungrounding over 11 years, taking account of this feedback.

These estimates represent conditions soon after flotation of the ice plain. As the glacier thins and the magnitude of ΔH in Equation 1 increases, velocities and the discharge flux will fall unless there is a further decrease in back forces. Such an increase is quite likely. Flotation of the ice plain will shift the grounding line over seabed that is >1200 m below sea level, where the bed is nearly horizontal over a distance of >200 km upstream, and basal shear stresses are very small (Fig. 2).
6. Conclusions
The equations used here are based on the assumption that perturbations in the forces acting on a glacier are transmitted over large distances, to affect longitudinal strain rates far away from the cause of the perturbation, and that equations similar to those governing ice-shelf creep can be used to estimate resulting effects. This differs from most approaches to glacier dynamics, which focus on local conditions as the dominant influence. These conditions certainly determine local driving stresses, which are important in controlling shear within the ice. But the longitudinal creep of most of the glacier must also be consistent with longitudinal forces, and here we have focused on these, with local conditions contributing by determining the magnitude of the forces. We justify the ice-shelf approximation by regarding most of a glacier as a slab of ice ‘floating’ on a thinner layer of shearing or sliding ice. Clearly, this is a simplifying approximation, but the results presented provide an opportunity to test whether it is a reasonable working assumption. The recently observed thinning and acceleration of PIG can readily be explained by changes in partially grounded ice plain that probably occurred during the period covered by the observations. We estimate the 10% velocity increase between 1996 and 2000 to have been caused primarily by ungrounding of only about 10% of the ice plain. But recent thinning rates are sufficient to unground the entire plain within the next few years, and this could result in a velocity increase from 2.7 to 3.6 kma–1. Thereafter, sustained high velocities are quite possible, if the grounding line then retreats over the glacier’s nearly horizontal bed.
Acknowledgements
This work was made possible by the availability of PIG ice-thickness and surface elevation data acquired by joint CECS/NASA airborne surveys in November/December 2002. We are indebted to pilots, crew members, technicians and staff from the Armada de Chile, from University of Kansas, from NASA Wallops Flight Facility and from CECS for making this work both a success and a delightful experience. We also thank the scientific editor, R. Mulvaney, and reviewers for many helpful suggestions, and an anonymous reviewer of a related paper for identifying an earlier error in our force-perturbation equations. Financial support for preparing this paper was provided by NASA’s Cryospheric Processes Program and ICESat Project, and by CECS, through Fundaciόn Andes and the Millennium Science Initiative.



