Introduction
Since parallel processing of visual information was first investigated (Hubel & Wiesel, Reference Hubel and Wiesel1962; Enroth-Cugell & Robson, Reference Enroth-Cugell and Robson1966), there have been numerous attempts to optimize visual stimuli in order to find psychophysical or perceptual correlates. Early attempts with modulated flicker found little relationship between visual evoked potentials (VEPs) and psychophysics (van der Tweel, Reference van der Tweel1964; Regan, Reference Regan1968). A crucial breakthrough was the use of grating stimuli, which revealed correlation between psychophysical contrast thresholds and VEPs to onset–offset stimulation (Kulikowski & Kozak, Reference Kulikowski, Kozak and Schmoger1967; Blakemore & Campbell, Reference Blakemore and Campbell1969; Campbell & Maffei, Reference Campbell and Maffei1970; Campbell & Kulikowski, Reference Campbell and Kulikowski1971). Gratings and elongated stripes proved to be more effective than checkerboards in correlating VEPs with pattern and motion thresholds (Kulikowski, Reference Kulikowski1974, Reference Kulikowski1978) and color (Carden et al., Reference Carden, Kulikowski, Murray and Parry1985; Kulikowski & Parry, Reference Kulikowski and Parry1987; Murray et al., Reference Murray, Parry, Carden and Kulikowski1987; Previc, Reference Previc1986; Berninger et al., Reference Berninger, Arden, Hogg and Frumkes1989; Kulikowski et al., Reference Kulikowski, Murray, Parry, Drum and Verriest1989).
Contrast masking has been used in many studies to characterize the response properties of the visual system. Early experiments showed that when an achromatic contrast increment is superimposed on a grating mask with identical spatial parameters, the increment detection threshold is a function of the masking or static contrast (Campbell & Kulikowski, Reference Campbell and Kulikowski1966; Kulikowski, Reference Kulikowski1969; Legge & Foley, Reference Legge and Foley1980) but only at moderate high spatial frequencies (see below). Similarly, when the static contrast is close to the detection threshold, sensitivity to a small in-phase increment is increased (facilitation). When the same procedure is carried out using gratings, which vary solely in chromaticity, contrast dependence is also found (Switkes et al., Reference Switkes, Bradley and DeValois1988); facilitation occurs at near-threshold mask contrasts, and sensitivity falls progressively as the chromatic contrast of the mask is increased.
The onset–offset of achromatic gratings of moderate to high spatial frequency elicit VEPs with both early positive and negative components (Russell et al., Reference Russell, Kulikowski, Murray, Barber and Blum1987; Mihaylova et al., Reference Mihaylova, Stomonyakov and Vassilev1999) likely representing the activity of mixed M and P contributions. At low spatial frequencies and at low contrast, the early negativity is minimized, and onset, offset, and phase reversal all produce similar cortical VEPs dominated by the early positive component (Kulikowski, Reference Kulikowski1978; Plant et al., Reference Plant, Zimmern and Durden1983; Berninger et al., Reference Berninger, Arden, Hogg and Frumkes1989). The same stimuli elicit an illusory percept of movement or “grating oscillations” with stable fixation (Kulikowski, Reference Kulikowski1971), consistent with the predominant activity of mechanisms involved in motion detection (Kulikowski & Tolhurst, Reference Kulikowski and Tolhurst1973). This is in keeping with the activity of the most sensitive magnocellular (M) pathways that are tuned to low spatial frequencies and that have been shown to respond in a highly transient or phasic manner (Kulikowski & Walsh, Reference Kulikowski and Walsh1993). Conversely, the onset presentation of low spatial frequency isoluminant red/green (R/G) or blue/green (B/G or tritan) gratings can elicit VEPs, which are larger and of opposite (negative) polarity (Carden et al., Reference Carden, Kulikowski, Murray and Parry1985; Murray et al., Reference Murray, Parry, Carden and Kulikowski1987; Parry et al., Reference Parry, Kulikowski, Murray, Kranda, Ott, Hindmarch, Aufdembrinke and Ott1988; Berninger et al., Reference Berninger, Arden, Hogg and Frumkes1989; Berninger & Arden, 1991; Kulikowski et al., Reference Kulikowski, Murray, Parry, Drum and Verriest1989, Reference Kulikowski, McKeefry and Robson1997; Kulikowski, Reference Kulikowski, Valberg and Lee1991; Rabin et al., Reference Rabin, Switkes, Crognale, Schneck and Adams1994; Robson & Kulikowski, Reference Robson and Kulikowski1995, Reference Robson and Kulikowski1998; Robson et al., Reference Robson, McKeefry, Kulikowski, Dickinson, Murray and Carden1997; Porciatti & Sartucci, Reference Porciatti and Sartucci1999; Suttle & Harding, Reference Suttle and Harding1999; Gomes et al., Reference Gomes, Souza, Rodrigues, Saito, Silveira and da Silva Filho2006, Reference Gomes, Souza, Saito, da Silva Filho, Rodrigues, Ventura and Silveira2010). The negative onset VEPs reflect color-specific responses, which depend on the standing level of contrast and likely represent the more sustained (tonic) activity of the color-opponent parvocellular (P) or koniocellular (K) visual pathways (Kulikowski, Reference Kulikowski, Valberg and Lee1991). This is in keeping with numerous psychophysical and single-cell studies that have established the low temporal resolution of the chromatic visual system.
The experiments described above suggest that the electrophysiological response to achromatic and chromatic contrast can reflect the activity of different visual pathways.
In this study, VEPs were recorded from healthy subjects in response to achromatic and isoluminant R/G and B/G (tritan) gratings that were modulated in contrast around different levels of static masking contrast in order to test how M-, P-, and S-cone-driven K pathways process contrast information. A preliminary report comparing achromatic and R/G data from a single subject with an animal model was published in 2001 (Robson & Kulikowski, Reference Robson and Kulikowski2001).
Methods
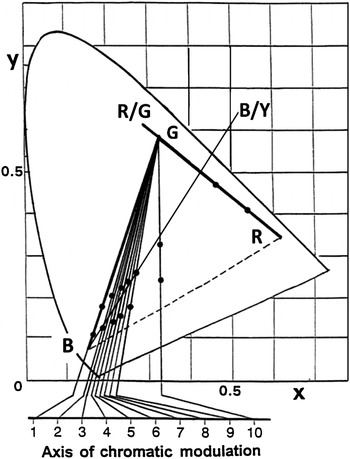
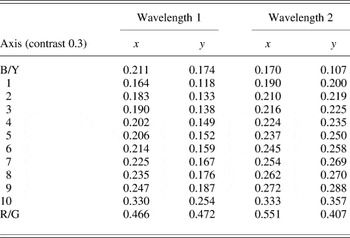
Achromatic gratings and red/green (R/G) and blue/green (B/G) chromatic gratings were generated on a color monitor. Achromatic gratings were sinusoidal and chromatic gratings were square wave (see Discussion section). Chromatic isoluminance was determined for each individual subject and each chromatic axis using minimum flicker photometry for a 1 deg circular field. An isoluminant bipartite field (diameter 3 deg) was presented along multiple axes including those specified in Fig. 1 and Table 1, and a subject-specific tritan axis was determined using a minimum distinct border (MDB) criterion (Boynton, Reference Boynton, Armington, Krauskopf and Wooten1978; Robson & Kulikowski, Reference Robson and Kulikowski1998); a five-point rating paradigm (Tansley & Boynton, Reference Tansley and Boynton1978) was used to specify when the edge between the two chromatic components became minimally distinct.
Chromatic axes of stimulation. A subject-specific tritan confusion axis was selected from axes 1–10 using square-wave stimuli and a MDB criterion. Filled circles specify the coordinates of the main chromatic stimuli; some coordinates are omitted for clarity (see Table 1). Phosphor coordinates are shown (R, G, and B). The “B/Y” axis was used only in the control study (Fig. 3) and falls in a direction between the opponent y-b axis and cardinal tritan axis (Grigsby et al., Reference Grigsby, Vingrys, Benes and King-Smith1991).

Measured Commission internationale de l'éclairage (CIE) coordinates for the chromatic axes illustrated in Fig. 1for gratings with a contrast of 0.3

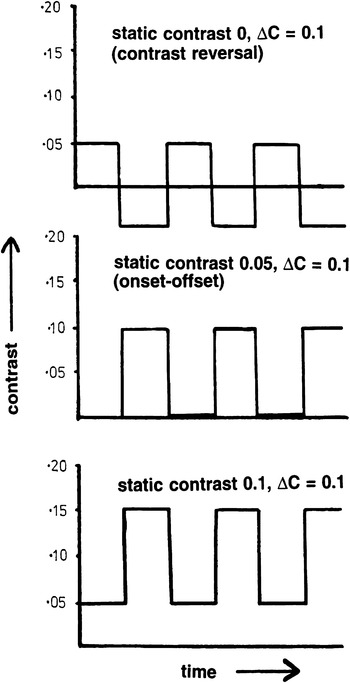
Equal contrast increments–decrements of 0.1 or 0.2 were superimposed on in-phase static gratings (masks) with identical spatial parameters. Seven levels of static (Michelson) contrast were used: 0, 0.05, 0.1, 0.2, 0.3, 0.4, and 0.6. A contrast increment–decrement of 0.1 superimposed on zero static contrast results in contrast reversal modulation; the same increment–decrement superimposed on a static contrast of 0.05 results in onset–offset modulation (Fig. 2). Chromatic contrast was defined as being equivalent to the Michelson contrast of the constituent monochromatic gratings. Gratings were presented in both an ascending and descending staircase of static contrasts to control longer-term adaptation effects. The stimulus field diameter was 3 or 6 deg; spatial frequency was 0.5, 1, 2, or 5 cycles/deg. Mean luminance was 30 cd/m2in all experiments. Calibration was checked at the start of each recording session.
Contrast increment–decrement of 0.1 superimposed on static contrasts of 0, 0.05, and 0.1. When static contrast is zero, a contrast increment results in phase reversal; when static contrast is half the magnitude of the contrast increment, stimulation is in onset–offset mode.

Cortical VEPs were recorded using a midline occipital scalp electrode positioned on Oz (10% of the inion–nasion distance above the inion) and referred to both a midfrontal (Fz; Jasper, Reference Jasper1958) and linked ear reference simultaneously. In order to minimize the effects of fatigue or inattention, subjects were instructed to use a switch, which interrupted averaging if and when they became tired or distracted. The on-going electroencephalogram was monitored continuously for signs of drowsiness and paradoxical alpha rhythm (Binnie et al., Reference Binnie, Rowan and Gutter1982; McKeefry et al., Reference McKeefry, Russell, Murray and Kulikowski1996).
A “Medelec ER94” signal averager was used to record the VEPs (Medelec, Oxford, UK). Filter bandwidth was 0.3–30 Hz (stimulus rate 2 or 3 Hz) or 0.3–60 Hz (stimulus rate 6 Hz); control studies were performed using a wider bandwidth of 0.3–120 Hz. Typical amplification was 10 or 20 μV/cm. Artifact rejection was always enabled so that large artifacts were rejected. For chromatic VEPs, a minimum of 512 sweeps were averaged on at least two occasions and checked for reproducibility. Achromatic VEPs tended to be larger and required less averaging (typically 2 × 256 sweeps). Grand averages were used for measurements of timing and amplitude.
Control studies were initially performed on two healthy subjects and involved recording onset–offset and contrast reversal VEPs on six separate occasions to each of the 12 chromatic axes illustrated in Fig. 1.
Four healthy subjects with normal color vision underwent achromatic and R/G VEP testing to contrast increment–decrements; additional tritan increment–decrement VEPs were recorded from two of these individuals. For the main part of the study, spatial parameters were chosen to optimally reveal robust VEPs that have previously been shown to reflect differences in sustained/transient response contributions. Achromatic gratings were sinusoidal and of low spatial frequency (0.5 cycles/deg). Psychophysical studies have demonstrated that at this spatial frequency, sustained responses become attenuated (Kulikowski & Kranda, Reference Kulikowski and Kranda1977). Additionally, the onset, offset, and phase reversal of this stimulus elicits VEPs that differ minimally from each other in keeping with transient M activity. Chromatic gratings were square wave with a spatial frequency of 2 cycles/deg; at isoluminance, these parameters elicit negative polarity onset VEPs that are of maximum amplitude and most different from corresponding reversal VEPs, consistent with predominant color-opponent sustained responses (see Discussion section).
Results
VEPs to chromatic onset stimulation using different chromatic axes
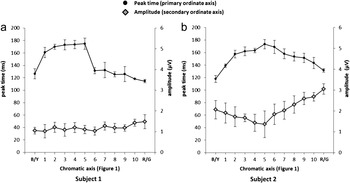
Fig. 3 shows the averaged timing and amplitude parameters of VEPs from two observers, elicited by modulating square-wave gratings along each of the 12 chromatic axes illustrated in Fig. 1. In both individuals, every onset VEP (static contrast 0.15, contrast change 0.3) was verified for selectivity by comparison with a chromatic reversal VEP (positive polarity) to the same chromatic grating for the same contrast change. A high degree of VEP reproducibility was demonstrated (Fig. 3). The time to the first negative peak of the onset VEP was greatest for axes closest to the subject-specific tritan confusion line and was significantly shorter for the R/G chromatic axis. Amplitudes were greatest for the R/G axis in both subjects (Fig. 3).
Averaged timing and amplitude parameters of chromatic onset VEPs from two observers (subjects 1 and 2), elicited by modulating gratings along each of the 12 chromatic axes illustrated in Fig. 1. Mean peak times (filled circles) are plotted against the primary ordinate axis and mean amplitudes (gray diamonds) are plotted against the secondary ordinate axis. Recordings for each of 12 chromatic axes were performed on six occasions; error bars show 1 s.d. either side of the mean.

VEPs to achromatic contrast increment and decrement
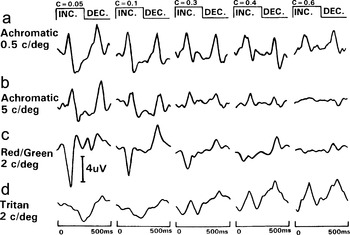
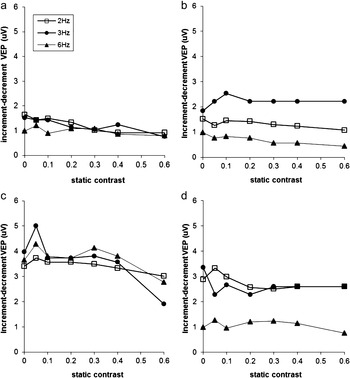
Fig. 4a and 4b shows representative achromatic VEPs generated by an increment–decrement contrast change of 0.1 superimposed on different levels of static contrast, at two spatial frequencies (temporal frequency 2 Hz). The effect of contrast masking for a coarse sinusoidal grating (0.5 cycles/deg; Fig. 4a) is minimal; this and additional data obtained at higher temporal frequencies and in three other subjects are shown graphically in Fig. 5 and intersubject variability is quantified in Fig. 6. For a coarse grating, there was minimal reduction of the VEP components to either increment or decrement as the static contrast was increased. Modulation also produced a percept of motion at static contrast levels of 0.4 or less in all subjects. Switching contrast between 0.55 and 0.65 (static contrast 0.5) abolished this sensation.
Achromatic and chromatic VEPs to a contrast increment–decrement of 0.1 superimposed on different static levels of static contrast (C = 0.05–0.6). Field size 6 deg. Achromatic VEPs were elicited using gratings with a spatial frequency of 0.5 (a) and 5 cycles/deg (b); R/G VEPs (c) and tritan VEPs (d) were elicited using gratings of 2 cycles/deg.

The effects of achromatic contrast increment–decrement on different static levels of contrast at three temporal frequencies. Achromatic sine-wave grating, field size 6 deg, spatial frequency 0.5 cycles/deg. Subjects 1–3 (contrast change 0.1; a–c) and subject 4 (contrast change 0.2; d). Increment and decrement VEP components had a similar shape and plotted amplitudes are the average of both components at each static contrast.

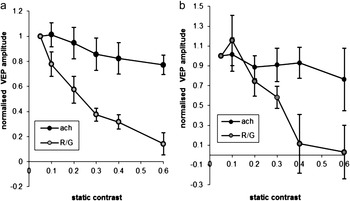
Comparison of achromatic and R/G VEP amplitudes to small contrast changes superimposed on different contrast masks at a temporal rate of 2 Hz (a) and 3 Hz (b). Data are normalised to the amplitude at static contrast 0.05 and are averaged across 4 subjects. Error bars show 1 s.d. either side of the mean. Achromatic VEPs were of positive polarity and similar responses to both contrast increment and decrement are averaged; contrast change was 0.1 (3 subjects) or 0.2 (1 subject). Chromatic VEPs amplitudes are for the negative polarity response to contrast increment only (contrast change 0.1).

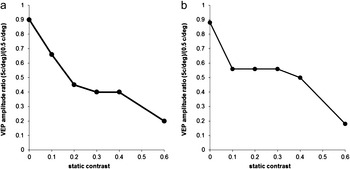
Two subjects (1 and 2) underwent additional achromatic testing to a fine sinusoidal grating (5 cycles/deg). Increment–decrement VEPs to this stimulus became progressively smaller as static contrast was increased (Fig. 4b). Fig. 7 illustrates the progressive relative attenuation of VEPs elicited with finer achromatic gratings (5 cycles/deg) compared with those generated using coarser gratings (0.5 cycles/deg); as the static contrast is increased up to 0.6, the responses were attenuated by up to 80%. There was no illusory motion at the higher spatial frequency.
Comparison of increment–decrement VEPs (ΔC = 0.1) to a fine (5 cycles/deg) versus a coarse sinusoidal grating (0.5 cycles/deg). Ordinate shows the amplitude ratio. Subjects 1 (a) and 2 (b).

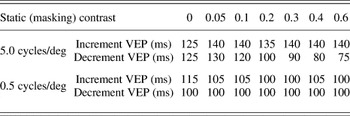
Changing the grating spatial frequency from 0.5 to 5 cycles/deg also had an effect on response timing. To the finer grating, increment VEPs had a time to positive peak that was up to 40% longer at the highest levels of static contrast (Table 2). The timing of VEPs to contrast decrement of fine gratings (5 cycles/deg) became shorter as the static contrast was increased (see Table 2 and Discussion section).
Time to VEP positive peaks following contrast increment or decrement (ΔC = 0.1) of sinusoidal gratings at two spatial frequencies; temporal frequency 2 Hz

VEPs to chromatic contrast increments and decrements
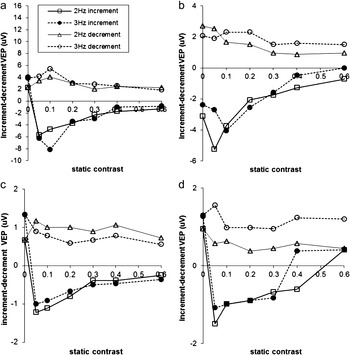
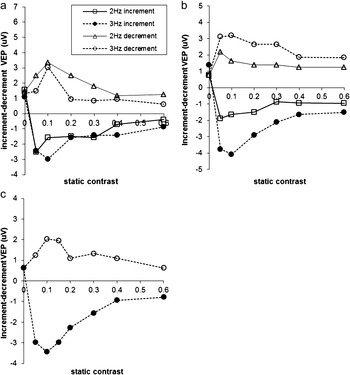
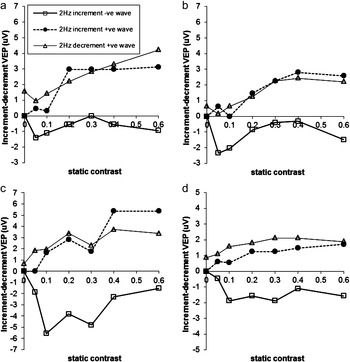
Chromatic contrast increments of 0.1 elicited the largest negative polarity R/G VEPs when static contrast was low; as static contrast increased, VEPs were reduced consistent with the effects of masking (Figs. 4c, 8, and 9). In some subjects, the presence of a low contrast static grating (C = 0.05) resulted in an increase in the characteristic color-specific negative VEP, in keeping with facilitation (Figs. 8 and 9). VEPs to R/G contrast decrement were positive in polarity and less affected by the high static contrast mask (Figs. 4c, 8, and 9). Fig. 6 quantifies intersubject variability in R/G increment VEPs and compares the effects of R/G and achromatic contrast masking.
The effects of a R/G contrast increment–decrement of 0.1 superimposed on different static levels of contrast. Square-wave grating. Field size 6 deg; 2 cycles/deg. Subjects 1–4 (a–d).

The effects of a R/G contrast increment–decrement of 0.1 (a and c) or 0.2 (b) superimposed on different static levels of contrast. Square-wave grating. Field size 3 deg; 2 cycles/deg. Subjects 2 (a and b) and subject 3 (c).

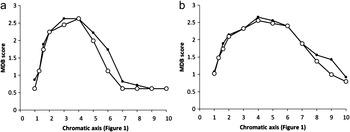
Fig. 10 shows the “MDB” scores for chromatic axes 1–10 illustrated in Fig. 1. Examples of corresponding tritan VEPs to a contrast increment–decrement of 0.1 are shown in Fig. 4d. The onset VEP (static contrast 0.05, contrast increment 0.1) was characterized by a negative polarity component, but as static contrast was increased, amplitudes reduced at lower masking levels than for R/G VEPs (Figs. 4d and 11), although there was some variability (see Discussion section). Unlike R/G VEPs, there was often a small positive wave preceding the increment negativity, and at the highest levels of static contrast, this positive wave dominated the increment response and resulted in an almost symmetrical transient type (achromatic) VEP (Figs. 4d and 11). When gratings were restricted to 3 deg, in order to minimize the effects of chromatic aberration (Bedford & Wyszecki, Reference Bedford and Wyszecki1957; Cavanagh & Anstis, Reference Cavanagh and Anstis1991; Charman, Reference Charman, Kulikowski, Walsh and Murray1991; Flitcroft, Reference Flitcroft1989; Kulikowski et al., Reference Kulikowski, McKeefry and Robson1997) and macular pigmentation (Moreland et al., Reference Moreland, Robson, Soto-Leon and Kulikowski1998; Robson et al., Reference Robson, Holder, Moreland and Kulikowski2006; Robson & Parry, Reference Robson and Parry2008), similar positive intrusions were seen at high levels of static contrast. The growth of this positive component (filled circles in Fig. 11) as static contrast was increased from low levels suggests that waveforms were dominated by transient-like achromatic activity at all but the lowest levels of static contrast (see below).
Comparison of mean MDB scores obtained in two subjects (a and b); scores are the means of 24 judgments, obtained in two test sessions (filled and open circles) per subject. Corresponding chromatic axes (1–10) are shown in Fig. 1.

The effects of a tritan contrast increment–decrement of 0.1 superimposed on different grating masks. Field size 6 deg (a and c) or 3 deg (b and d). Subject 1 (a and b) or 2 (c and d).

Discussion
This study provides objective evidence in humans of transient and sustained visual pathway mechanisms, likely to predominantly reflect M, P, and K pathway function. Responses to contrast increment–decrement vary according to the spatial frequency, chromaticity of the stimulus, and contrast mask, consistent with the temporal response properties of the different visual pathways. The data help to validate the use of suprathreshold achromatic and chromatic gratings in attempts to probe the activity of visual subsystems in humans and give an objective indication of response selectivity.
Achromatic increment–decrement modulation of a coarse grating produced an overwhelming percept of apparent motion at low moderate static contrast levels (0.4 or less). This illusion is consistent with the activation of transient-type response mechanisms (Kulikowski & Tolhurst, Reference Kulikowski and Tolhurst1973) of the M stream (Kulikowski, Reference Kulikowski, Valberg and Lee1991) that project to extrastriate area MT (Zeki, Reference Zeki1974; Zeki et al., Reference Zeki, Watson, Lueck, Friston, Kennard and Frackowiak1991). Modulation superimposed upon the highest contrast masks abolished this sensation and VEPs showed mild or moderate attenuation, see, for example, Figs. 4a and 5c. It is tempting to speculate that this reflects stimulation of nontransient V1 units, some of which have both fast M and additional P/K inputs (Lund et al., Reference Lund, Wu, Hardingham and Levitt1995; Vidyasagar et al., Reference Vidyasagar, Kulikowski, Lipnicki and Dreher2002). At high static contrast, the M pathway may saturate consistent with a reduction in transient activity and the loss of perceived (illusory) motion. At low moderate masking levels, the same stimuli elicit positive VEPs (contrast increment VEP = contrast decrement VEP; Kulikowski, Reference Kulikowski1978), which are largely unaffected by the level of static contrast (Fig. 5): VEPs have similar amplitudes and shape suggesting a predominant contribution from transient mechanisms that are sensitive to motion and that respond only to contrast change rather than static contrast (Bodis-Wollner et al., Reference Bodis-Wollner, Hendley and Kulikowski1972; Kulikowski & Gorea, Reference Kulikowski and Gorea1978). This provides a human VEP correlate of macaque single units; similar stimuli have been used to identify single units in V1, which also signal contrast increments, ignoring the static level of contrast (Vidyasagar et al., Reference Vidyasagar, Kulikowski, Robson and Dreher1998; Robson & Kulikowski, Reference Robson and Kulikowski2001) in keeping with the M pathway signature characterized by high contrast gain and rapid response saturation.
Early studies showed that VEPs to achromatic patterns are attenuated by adaptation to a contrast mask of identical spatial frequency (Blakemore & Campbell, Reference Blakemore and Campbell1969; Campbell & Maffei, Reference Campbell and Maffei1970; Spekreijse et al., Reference Spekreijse, van Der Tweel and Zuidema1973). In the current study, increment–decrement VEPs to the high spatial frequency grating became progressively smaller (Figs. 4 and 7) as static contrast was increased in keeping with an adapting effect on sustained response mechanisms, which contribute to the achromatic VEP, that is, the response is not purely transient. Both effects suggest nonselective stimulation of sustained mechanisms of the M and P streams that respond to achromatic gratings at high spatial frequencies (Russell et al., Reference Russell, Kulikowski, Murray, Barber and Blum1987). Progressive VEP attenuation is consistent with increment thresholds increasing proportionately to the mask contrast, that is, ΔC/C = constant (Weber’s law), but only over the higher spatial frequency range. The timing of VEPs to contrast decrement of fine gratings (5 cycles/deg) became shorter as the static contrast was increased (Table 2), presumably reflecting residual faster activity of the most transient M mechanisms that are only exposed when sustained contributions to the VEP are reduced.
Psychophysical experiments performed using chromatic gratings have demonstrated chromatic contrast dependence of adaptation (Bradley et al., Reference Bradley, Switkes and DeValois1988), analogous to that associated with fine achromatic patterns. The current VEP study provides an objective measure of this phenomenon; the typical negative VEPs to R/G contrast increment may initially increase in the presence of low static contrast (facilitation), but as the R/G mask contrast is progressively increased, there is proportionate amplitude reduction of this component (Figs. 4, 8, and 9), suggesting that Weber’s law also applies over intermediate chromatic contrasts. The VEP attenuation is consistent with R/G sustained (P) mechanisms responding to the in-phase mask causing chromatic pattern adaptation (Robson & Kulikowski, Reference Robson and Kulikowski2001), as would be expected given the tonic nature of color-opponent retinal ganglion cells (Gouras, Reference Gouras1968) and sustained responses of color-opponent pathways and cortical cells (e.g., Dreher et al., Reference Dreher, Fukada and Rodieck1976; Kaplan & Shapley, Reference Kaplan and Shapley1982; Hicks et al., Reference Hicks, Lee and Vidyasagar1983; Kulikowski & Walsh, Reference Kulikowski and Walsh1993; Johnson et al., Reference Johnson, Hawken and Shapley2001). It is also noted that chromatic onset VEPs elicited using almost identical stimulus parameters are more sensitive to ketamine anesthesia than achromatic VEPs to square-wave gratings of the same spatial frequency, consistent with a more sustained response characteristic (Kulikowski & Carden, Reference Kulikowski, Carden, Kulikowski, Dickinson and Murray1989; Kulikowski et al., Reference Kulikowski, Robson and Murray2002). The typical negative VEPs to contrast–increment decrease with masking but the positive VEPs to contrast decrement are minimally affected; the latter most likely represents greater M contributions to chromatic contrast decrements, which resemble the responses to chromatic contrast offset (Carden et al., Reference Carden, Kulikowski, Murray and Parry1985; Parry et al., 1988; Robson et al., Reference Robson, McKeefry, Kulikowski, Dickinson, Murray and Carden1997; Suttle & Harding, Reference Suttle and Harding1999), associated with transient-type activity (McKeefry et al., Reference McKeefry, Russell, Murray and Kulikowski1996).
The R/G axis employed in this study (Fig. 1) may have resulted in low-level S-cone stimulation but postreceptoral K pathway activation is likely to be weak. The R/G axis is close to protan and deutan confusion lines, and “R/G” VEPs to such a stimulus were previously shown to be abolished or “nulled” in R/G color-deficient observers (Murray et al., Reference Murray, Parry, Carden and Kulikowski1987; Parry et al., Reference Parry, Murray and Kulikowski1987) in keeping with low K pathway activation. Additionally, rotation of the chromatic axis revealed that R/G VEP timing and amplitude parameters were markedly different compared with those for tritan VEPs (Fig. 3). This is consistent with Rabin et al. (Reference Rabin, Switkes, Crognale, Schneck and Adams1994) who showed that small rotations from an L/M cone-isolating axis resulted in large increases in VEP timing. The mean chromaticity of R/G and tritan gratings were different and it is not specifically excluded that this may have influenced the VEPs, although this effect is unlikely to be large given that “R/G” onset VEP characteristics are similar irrespective of whether the stimulus is modulated between the red and green phosphor loci (Fig. 1) or along a parallel deutan axis (Robson et al., Reference Robson, Kulikowski, Korostenskaja, Neveu, Hogg, Holder, Mollon, Pokorny and Knoblauch2003a) that intersects a more neutral white point (Arden et al., Reference Arden, Gunduz and Perry1988).
Tritan VEPs were more variable than R/G responses but could show proportionately greater reduction to low levels of static contrast, consistent with psychophysical studies suggesting that the S-cone system saturates at relatively low intensities (Mollon & Polden, Reference Mollon and Polden1977). There is evidence that S-cones have limited access to luminance or transient type channels (Eisner & MacLeod, Reference Eisner and Macleod1980), but it is noted that in macaque V1, significant numbers of cells receive mixed S-cone-driven (K) and M-type inputs (Lund et al., Reference Lund, Wu, Hardingham and Levitt1995; Vidyasagar et al., Reference Vidyasagar, Kulikowski, Lipnicki and Dreher2002). Selective stimulation of K-driven cells would only be expected at low contrast levels and in the absence of significant contrast masking, and dual inputs may explain the prominent positive components in tritan increment VEPs at high static contrast (Fig. 11). The variability of these positive components may also relate to macular pigmentation (Kulikowski et al., Reference Kulikowski, McKeefry and Robson1997; Moreland et al., Reference Moreland, Robson, Soto-Leon and Kulikowski1998; Robson et al., Reference Robson, Holder, Moreland and Kulikowski2006), which varies greatly in terms of peak optical density and lateral distribution in the healthy population (Moreland & Bhatt, Reference Moreland and Bhatt1984; Robson et al., Reference Robson, Kulikowski, Korostenskaja, Neveu, Hogg, Holder, Mollon, Pokorny and Knoblauch2003b; Barbur et al., Reference Barbur, Konstantakopoulou, Rodriguez-Carmona, Harlow, Robson and Moreland2010; Degli-Esposti et al., Reference Degli-Esposti, Egan, Bunce, Moreland, Bird and Robson2012). These response intrusions are unlikely to relate to the use of square wave rather than sine-wave gratings since the same effect is not seen in R/G VEPs, in spite of the fact that a residual M system response to isoluminant R/G borders has been demonstrated (Schiller & Colby, Reference Schiller and Colby1983; Lee et al., Reference Lee, Martin and Valberg1989), especially at high contrasts (White et al., Reference White, Wilder, Goodchild, Sefton and Martin1998).
Square-wave gratings have higher spatial frequency components than sine-wave gratings and are used, particularly in psychophysics, to study interactions between spatial frequency channels (Campbell & Robson, Reference Campbell and Robson1968; Tolhurst, Reference Tolhurst1972). However, at suprathreshold levels, a compromise must be achieved between VEP selectivity and attaining a robust suprathreshold chromatic signal (maintaining a high signal to noise ratio). Chromatic onset VEPs to sine waves have a similar negative polarity but are smaller (Kulikowski et al., Reference Kulikowski, McKeefry and Robson1997; Robson et al., Reference Robson, McKeefry, Kulikowski, Dickinson, Murray and Carden1997). The chromatic selectivity of “square-wave” chromatic VEPs have been rigorously tested in previous studies according to several criteria including the MDB (see below). It has also been established that at suprathreshold levels, macular (“luteal”) pigmentation is by far the greatest source of achromatic intrusion into large nominally isoluminant gratings containing a short-wavelength component (Moreland et al., Reference Moreland, Robson, Soto-Leon and Kulikowski1998; Robson et al., Reference Robson, Holder, Moreland and Kulikowski2006; Robson & Parry, Reference Robson and Parry2008).
Numerous studies have employed chromatic VEPs to assess visual pathway function in health and disease but few have attempted to validate the selectivity of visual pathway responses. Several criteria may be considered including those based on VEP waveform polarity and shape (e.g., Murray et al., Reference Murray, Parry, Carden and Kulikowski1987; Berninger et al., Reference Berninger, Arden, Hogg and Frumkes1989; Suttle & Harding, Reference Suttle and Harding1999), assessment of color contrast thresholds (Porciatti & Sartucci, Reference Porciatti and Sartucci1999), tritanopic confusion lines (Robson & Kulikowski, Reference Robson and Kulikowski1995, Reference Robson and Kulikowski1998), and congenital and acquired color vision deficiencies (Murray et al., Reference Murray, Parry, Carden and Kulikowski1987; Berninger et al., Reference Berninger, Arden, Hogg and Frumkes1989; Crognale et al., Reference Crognale, Rabin, Switkes, Adams and Drum1993; Parry & Murray, Reference Parry, Murray, Dickinson, Murray and Carden1997; Gomes et al., Reference Gomes, Souza, Rodrigues, Saito, Silveira and da Silva Filho2006; Tekavčič Pompe et al., Reference Tekavčič Pompe, Stirn Kranjc and Brecelj2010). Furthermore, selective chromatic onset VEPs are dominated by the fundamental harmonic component (McKeefry et al., Reference McKeefry, Russell, Murray and Kulikowski1996; Robson et al., Reference Robson, Holder, Moreland and Kulikowski2006; Robson & Parry, Reference Robson and Parry2008), are sensitive to ketamine anesthesia (Kulikowski et al., Reference Kulikowski, Robson and Murray2002), and S-cone-pathway VEPs exhibit low-pass temporal tuning (Robson & Kulikowski, 1995, 1998; Kulikowski et al., 1996) analogous to that seen psychophysically and in some suprathreshold imaging studies (D’Souza et al., Reference D’Souza, Auer, Strasburger, Frahm and Lee2011). The latter criterion has been considered by some to be one of the most stringent because it is argued to readily expose achromatic response intrusions (Robson & Kulikowski, 1995, 1998; Kulikowski et al., Reference Kulikowski, McKeefry and Robson1997). However, temporal tuning of VEPs is difficult to measure accurately and the use of this criterion has been questioned and debated (Kulikowski et al., 1996; Switkes et al., 1996). In our experience, examination of VEP temporal tuning required recordings at multiple temporal frequencies and at the higher rates of stimulation close to threshold involved relatively prolonged periods of recording to elicit robust VEPs. Low temporal resolution is consistent with the sustained parvocellular and koniocellular function that underlies chromatic pattern adaptation, and comparison of responses recorded with and without a high contrast mask may provide a rapid and more practical method of examining temporal response characteristics and selectivity in the clinic.
The study outlines how, under carefully controlled conditions, visual system responses may be attributed to different processing streams according to the relative contributions of sustained and transient-type activity. It is interesting to consider how similar mechanisms may influence everyday visual experience and color constancy. On entering a room illuminated by an incandescent light source, objects and white surfaces may seem tainted yellow, but after adapting to the ambient lighting, colors are largely restored, for example, white looks white (Murray et al., Reference Murray, Daugirdiene, Vaitkevicius, Kulikowski and Stanikunas2006). However, objects similar in spectral reflectance to the illuminant remain lighter (no luminance adaptation). The experiments described in the current study may also be pertinent to other suprathreshold studies, for example, adaptation methods have been used extensively in functional MRI (fMRI) experiments (Weigelt et al., Reference Weigelt, Muckli and Kohler2008) and prudent choice of spatial and temporal parameters may optimize these effects. A major advantage in suprathreshold studies would be to generate large chromatic stimuli that are corrected for eccentricity-dependent changes in isoluminance (Reference Parry and RobsonParry & Robson, 2012).
In summary, cortical VEPs generated by coarse achromatic gratings can represent a subdivision of the M pathway that is tuned to low spatial frequencies and that responds in a transient manner. At high spatial frequencies, achromatic pattern adaptation results in VEP attenuation, in keeping with nonselective sustained responses from multiple visual pathways. Chromatic VEPs are highly sensitive to R/G and tritan pattern adaptation, consistent with predominant stimulation of color-opponent P or K pathways that process contrast in a largely sustained manner. Cortical VEPs can provide an objective measure of visual adaptation and can be used to probe the temporal response characteristics of different visual pathways.
Acknowledgments
Dr. Neil Parry for many helpful discussions and software development. Mr. John Simpson for software and hardware development. The research was supported by the Foundation Fighting Blindness (A.G.R.) and by the National Institute for Health Research (NIHR) Biomedical Research Centre based at Moorfields Eye Hospital NHS Foundation Trust and UCL Institute of Ophthalmology (A.G.R.). The views expressed are those of the authors and not necessarily those of the NHS, the NIHR or the Department of Health.