


1 Introduction
Jets in cross-flow are a fundamental flow scenario where a jet of one fluid is injected at an angle into the flow field of a second fluid. It is relevant in many technical applications, which include but are not limited to fuel injectors, air conditioning of vehicles, flow control actuators and central venous catheters. The variety and amount of applications have motivated a long history of scientific research on the complex interaction between the injected jet and the cross-flow. Fric & Roshko (Reference Fric and Roshko1994) and Kelso, Lim & Perry (Reference Kelso, Lim and Perry1996) provide an overview of several fundamental flow features that dominate the flow field of a steady jet injected into a cross-flow (figure 1). They describe the governing mechanisms, behaviour and effects of these flow features. One example are shear-layer vortices that are unsteady vortices at the windward side of the jet’s shear layer. Other examples are tornado-like wake vortices forming downstream in the wake of the jet or a horseshoe vortex that originates from the roll-up of the oncoming cross-flow boundary layer. The most prominent flow feature is the counter-rotating vortex pair because it prevails far downstream, thereby dominating the flow field (Kamotani & Greber Reference Kamotani and Greber1972; Fearn & Weston Reference Fearn and Weston1974). A comprehensive review of the research and more details on the individual flow features of steady jets interacting with a cross-flow are provided by Margason (Reference Margason1993) and Mahesh (Reference Mahesh2013).
Dominant flow structures of a round steady jet in cross-flow (Fric & Roshko Reference Fric and Roshko1994).

The flow field of a jet in cross-flow changes significantly when the injected jet is oscillating spatially or temporally. Eroglu & Breidenthal (Reference Eroglu and Breidenthal2001) investigate the flow field of a pulsed (i.e. temporally oscillating) jet in cross-flow. They show that additional vortex rings are created, which dominate the flow field. In comparison to steady jets, they quantify that the penetration depth of pulsed jets at an optimized pulsing frequency and jet to cross-flow velocity ratio is significantly larger. Furthermore, the pulsing of the jet enhances the mixing performance. The flow field of spatially oscillating jets also exhibits properties that are beneficial to a multitude of applications. For example, Lacarelle & Paschereit (Reference Lacarelle and Paschereit2012) reveal a superior mixing performance of spatially oscillating jets compared to steady jets in cross-flow, which is quantified by high-speed, laser-induced fluorescence measurements. Other studies demonstrate a high effectiveness of spatially oscillating jets for flow control applications. Two examples are Seele et al. (Reference Seele, Tewes, Woszidlo, Mcveigh, Lucas and Wygnanski2009) who successfully employ spatially oscillating jets for delaying flow separation on a V-22 Osprey aerofoil and Schmidt et al. (Reference Schmidt, Woszidlo, Nayeri and Paschereit2015) who use spatially oscillating jets for preventing flow separation on base flaps attached to a bluff body, thereby reducing the drag. Another application scenario is film cooling: Hossain et al. (Reference Hossain, Prenter, Lundgreen, Ameri, Gregory and Bons2017b ) state that the cooling effectiveness in the lateral direction is improved due to the spatial oscillation. Most studies utilize fluidic oscillators, also known as flip-flop nozzles or sweeping jet actuators, for generating spatially oscillating jets. They are able to generate a spatially oscillating jet without requiring moving parts because the spatial oscillation is solely caused by their internal geometry. One type of fluidic oscillator, similar to that used in this study for generating a spatially oscillating jet, is shown in figure 2. More details on the working principle of this design of fluidic oscillator are provided by Woszidlo et al. (Reference Woszidlo, Ostermann, Nayeri and Paschereit2015) and Sieber et al. (Reference Sieber, Ostermann, Woszidlo, Oberleithner and Paschereit2016). It is noteworthy that several modifications of this concept exist. For example, a splitter may be placed at the outlet for generating two distinct alternating jets (e.g. Arwatz, Fono & Seifert Reference Arwatz, Fono and Seifert2008). In the current study, no splitter is present. Hence, a continuous, spatially oscillating jet is generated by the oscillator. Campagnuolo & Lee (Reference Campagnuolo and Lee1969) and Gregory & Tomac (Reference Gregory and Tomac2013) provide comprehensive reviews on fluidic oscillators including other types of oscillators.
Working principle of a fluidic oscillator.

Although the effectiveness of spatially oscillating jets for various applications was proved in several studies, the driving mechanisms behind their performance remain widely unclear. This is mostly attributable to the lack of knowledge on the underlying fundamental flow field because most studies describe the time-averaged effect on global quantities or are limited to qualitative information. This shortcoming is caused by the naturally sustained oscillation as well as the three-dimensionality and time dependence of the flow field, which are challenging to investigate experimentally. Numerical studies are also rare because of the required temporal and spatial scales, and the lack of sufficient experimental data for validation. Ostermann et al. (Reference Ostermann, Woszidlo, Nayeri and Paschereit2018a ) study the properties of a spatially oscillating jet emitted into a quiescent environment. They identify a dominant head vortex alternately created when the jet is fully deflected. The wider spread of the jet compared to a steady jet in combination with a small nozzle aspect ratio, of the order of unity, increases the entrainment significantly, which may suggest an enhanced mixing capability. However, the data are limited to a quiescent environment without a cross-flow being present. Some qualitative information on the flow field of a spatially oscillating jet in cross-flow is provided by Woszidlo & Wygnanski (Reference Woszidlo and Wygnanski2011). They use china clay for surface flow visualization on a wall downstream of the oscillator to yield a footprint of flow structures inside the flow field. They identify multiple vortices close to the nozzles and propose an increase in streamwise vorticity. However, the surface flow visualization only provides an insight into the time-averaged behaviour at the wall and does not yield any information about the flow field dynamics. Additionally, flow structures that are not located at the wall or or only exist temporarily at positions where the jet wipes away the flow visualization paint are not included. Pack Melton & Koklu (Reference Pack Melton and Koklu2016) employ particle image velocimetry (PIV) for acquiring velocity fields on a semi-span wing model equipped with fluidic oscillators for separation control. The time-averaged cross-sectional velocity fields located downstream of the fluidic oscillators exhibit numerous areas of high vorticity, indicative of streamwise vortices. The limitation to time-averaged, two-dimensional data is that they do not provide information about the dynamics or driving mechanism of the streamwise oriented vortices. Recently, Ostermann et al. (Reference Ostermann, Godbersen, Woszidlo, Nayeri and Paschereit2017a ) visualized the three-dimensional, time-resolved flow field of a spatially oscillating jet based on phase-averaged PIV data. They identify a pair of counter-rotating vortices with the sense of rotation opposite to the counter-rotating vortex pair of a steady jet in cross-flow. Their data set is further used for validating numerical studies (Hossain et al. Reference Hossain, Prenter, Lundgreen, Agricola, Ameri, Gregory and Bons2017a ; Aram et al. Reference Aram, Shan, Ostermann and Woszidlo2018b ) which analyse the influence of parameters such as the velocity ratio and the angle between oscillation plane and cross-flow direction. The presented experimental study focuses on the fundamental interaction between a spatially oscillating jet and a cross-flow. The investigated flow field is not related to one specific application scenario. Instead, a fundamental scenario is chosen: the incompressible spatially oscillating jet is ejected perpendicularly into the cross-flow. This scenario allows for a comparison to several other jet in cross-flow studies on steady and temporally oscillating jets. The objective of this study is the identification and description of the fundamental flow dynamics of the interaction between the jet and the cross-flow. The presented study aims at providing an insight into the flow field, thereby serving as a validation scenario and generic foundation for future numerical and experimental studies that investigate more complex, application-specific flow fields.
2 Set-up and instrumentation
The spatially oscillating jet is emitted by a fluidic oscillator with two feedback channels. The design is illustrated in figure 2. This particular design is chosen because the fundamental properties of its ejected jet were part of experimental and numerical studies (Aram et al.
Reference Aram, Lee, Shan and Vargas2018a
; Ostermann et al.
Reference Ostermann, Woszidlo, Nayeri and Paschereit2018a
). The oscillator is a copy of the design published in the patent by Stouffer & Bower (Reference Stouffer and Bower1998). The detailed geometry is made available along with other data from this study by Ostermann et al. (Reference Ostermann, Woszidlo, Nayeri and Paschreit2018b
). The type of fluidic oscillator used was also employed in various flow control applications (e.g. Raman et al.
Reference Raman, Packiarajan, Papadopoulos, Weissman and Raghu2005; Phillips & Wygnanski Reference Phillips and Wygnanski2013; Koklu & Owens Reference Koklu and Owens2017). For this study, the fluidic oscillator is milled from acrylic glass and closed by an airtight cover plate. The outlet throat cross-sectional area is
 $10\times 10~\text{mm}^{2}$
(i.e.
 $A_{outlet}=100~\text{mm}^{2}$
) yielding a hydraulic diameter
 $d_{h}$
of 10 mm. The oscillator is supplied with pressurized air at a volume upstream of the inlet nozzle. The amount of air is controlled by a mass flow controller HFC-D-307 by Teledyne Hastings that is able to set mass flows
 ${\dot{m}}_{supply}$
in a range from 0 to
 $200~\text{kg}~\text{h}^{-1}$
at an accuracy of better than 0.7 % full scale. On average, the accuracy is 2.5 % for the applied flow rates.
The experimental set-up. (a) The complete measurement section. (b) The fluidic oscillator installed inside the splitter plate (a part of the splitter plate is cut away for visualization only).

The fluidic oscillator is mounted to a splitter plate inside the wind tunnel (figure 3
b). The divergent part of the nozzle is flush with the flat plate. The inclination angle
 $\unicode[STIX]{x1D6FC}$
and side angle
 $\unicode[STIX]{x1D6FD}$
are fixed at
 $90^{\circ }$
, resulting in the oscillation plane being perpendicular to the direction of the cross-flow. The wind tunnel is an open-return, suction wind tunnel that is able to provide cross-flow velocities of up to
 $25~\text{m}~\text{s}^{-1}$
at a turbulence level of less than 0.15 %. The length of the test section is 2 m and the cross-sectional area is approximately
 $0.5\times 0.5~\text{m}^{2}$
. A splitter plate is installed inside the test section, guaranteeing a fresh boundary layer development. This reduces the test section height to 37 cm (
 $37\,d_{h}$
). An adjustable ceiling of the test section allows for control of the streamwise pressure gradient that is set to zero in this study, and which is confirmed through pressure measurements along the splitter plate. The splitter plate is equipped with a trailing edge flap and an elliptical leading edge. The trailing edge flap was adjusted so that no separation occurs at the leading edge. Tripping tape is applied at the leading edge, ensuring a turbulent boundary layer. At a cross-flow velocity of
 $U_{\infty }=15~\text{m}~\text{s}^{-1}$
, the cross-flow boundary layer thickness of
 $U=0.99U_{\infty }$
is experimentally determined to be 16 mm (
 $1.6\,d_{h}$
) at the oscillator outlet. The momentum thickness is 1.6 mm (
 $0.16\,d_{h}$
) and the shape factor is 1.4. The boundary layer profile is acquired with a traversing Pitot probe. It is noteworthy that, for different cross-flow velocities, the boundary layer thickness varies in a limited range between
 $1.3\,d_{h}$
and
 $1.9\,d_{h}$
. Set-up restrictions of the suctioning open-loop wind tunnel make it challenging to acquire more detailed information on the boundary layer in the streamwise and spanwise directions. The data for the measured boundary layer profile at the location of the oscillator exit for three cross-flow velocities are available publicly alongside other flow field data from this study (see Ostermann et al.
Reference Ostermann, Woszidlo, Nayeri and Paschreit2018b
). These data may be used for numerical simulations. The origin of the employed coordinate system is located in the middle of the outlet nozzle (figure 2) with the
 $x$
-axis being oriented in the direction of the cross-flow and the
 $y$
-axis being oriented in the wall-normal direction (figure 3
b). Note that, for visualization purposes, part of the splitter plate is omitted in figure 3(b) to allow an unobstructed view of the installation of the oscillator.
The velocity ratio
 $R$
and the oscillation frequency
 $f_{osc}$
are parameters of interest in the presented study. The velocity ratio is defined as the ratio between the bulk outlet velocity
 $U_{bulk}$
and the cross-flow velocity
 $U_{\infty }$
(2.1). The bulk outlet velocity
 $U_{bulk}$
is the theoretical exit velocity assuming a top-hat velocity profile and ambient conditions (i.e. ambient density
 $\unicode[STIX]{x1D70C}_{0}$
) at the oscillator throat (2.2). The jet Reynolds number based on the smallest considered bulk velocity and the hydraulic diameter of the oscillator throat is 9000, which is well within the turbulent regime of a pipe flow.
 $$\begin{eqnarray}\displaystyle & \displaystyle R=\frac{U_{bulk}}{U_{\infty }}, & \displaystyle\end{eqnarray}$$
 $$\begin{eqnarray}\displaystyle & \displaystyle U_{bulk}=\frac{{\dot{m}}_{supply}}{\unicode[STIX]{x1D70C}_{0}A_{outlet}}. & \displaystyle\end{eqnarray}$$
A stereoscopic PIV system measures velocities inside the flow field (figure 3
a). It consists of two pco.2000 cameras by PCO equipped with 100 mm objectives by Canon. The cameras record six double images per second at a resolution of 4 megapixels. The laser light is provided by a Quantel Evergreen 200 mJ laser. The laser light is spanned to a laser sheet by an appropriate system of optical lenses. The laser sheet thickness is approximately 2 mm. The correct timing between the components is assured by a synchronizer manufactured by ILA GmbH. The PIV system is mounted on a two-axis traversing system that is fixed to the wind tunnel. The traversing system enables movement of the PIV system in the streamwise and spanwise directions without requiring a new calibration. Seeding particles (Di-Ethyl-Hexyl-Sebacat) with a particle size of 0.5
 $\unicode[STIX]{x1D707}$
m are added to the jet and the cross-flow. The air that supplies the seeding generator of the jet is diverted downstream of the mass flow controller. Hence, the seeded air does not add to the total supply rate. A bypass equipped with a valve controls the amount of added seeding particles. The seeding concentration and homogeneity are ensured through test snapshots prior to each measurement.
The three-dimensional velocity field is acquired plane-by-plane. The planes are oriented in the streamwise direction because this allows for taking advantage of the flow field symmetry and for minimizing the most erroneous out-of-plane velocity component. The distance between the individual planes is chosen in accordance with velocity gradients. The smallest distance is 2 mm (
 $0.2\,d_{h}$
). Each acquired three-dimensional velocity field consists of 22 planes with each containing 8000 PIV snapshots. The domain extends from
 $-15$
to 160 mm in the streamwise direction (i.e.
 $-1.5\,d_{h}\leqslant x\leqslant 16\,d_{h}$
), from 1.2 to 140 mm in the
 $y$
-direction (i.e.
 $0.1\,d_{h}\leqslant y\leqslant 14\,d_{h}$
) and from
 $-8$
to 130 mm in the spanwise direction (i.e.
 $-0.8\,d_{h}\leqslant z\leqslant 13\,d_{h}$
). Some PIV planes are located at negative
 $z$
for validating the flow field symmetry. The maximum extent of
 $y$
and
 $z$
is chosen to be already in the free stream. The PIV snapshots are post-processed with PIVView by PivTech. The final resolution in the
 $x$
- and
 $y$
-directions is
 $1~\text{vector}~\text{mm}^{-1}$
. The acquisition of the three-dimensional flow field is an extensive effort. Therefore, additional measurements of flow field cross-sections are conducted at discrete streamwise positions in order extend the number of available parameter configurations. In the cross-sections, the final resolution is
 $1~\text{vector}~\text{mm}^{-1}$
in the
 $y$
- and
 $z$
-directions.
The internal fluidic oscillator geometry is equipped with pressure sensors (HDO Series by Sensortechnics) with a response time faster than
 $100~\unicode[STIX]{x03BC}\text{s}$
full scale. These pressure sensors are used for measuring the time-resolved pressure inside the oscillator simultaneously with the PIV measurements. The sensors are sampled at 16 kHz. The simultaneous acquisition of pressure and velocities enables a temporal correlation between them. Therefore, the pressure signal provides a reference for the phase-averaging process that is explained in more detail in the subsequent section.
3 Data analysis
Acquiring the time-resolved flow field is challenging due to the absence of an external trigger and the naturally induced oscillation of the fluidic oscillator, which results in non-stationary oscillation frequencies. Therefore, phase averaging based on a reference signal is employed. The specific details of this method are discussed by Ostermann et al. (Reference Ostermann, Woszidlo, Nayeri and Paschereit2015) for the flow field of fluidic oscillators. The following steps are executed to acquire the periodic flow field:
(i) The differential pressure between the feedback channel inlets is used as the reference signal. The signal is filtered forward and backward using a Butterworth low pass filter with a cutoff frequency of twice the oscillation frequency to further increase the signal quality.
(ii) A running auto-correlation with a signal fragment size of approximately half an oscillation period is employed to identify the oscillation periods. Every zero crossing of the correlation coefficient is defined as the starting point of one half-period. The phase angles in between the starting points are evenly segmented. The definition of
 $\unicode[STIX]{x1D719}=0^{\circ }$
is not unique but depends on the chosen signal fragment. Therefore, all results are phase aligned by applying a repeatable definition for the period starting point. In this study, the zero crossing of the differential pressure between the feedback channel inlets (i.e. the reference signal) is chosen as the period starting point. This point coincides with the jet leaving the nozzle without a deflection (i.e. deflection angle of the jet
$\unicode[STIX]{x1D703}_{jet}=0$
). Depending on the chosen zero-crossing sign change, the jet moves from negative to positive direction or vice versa. In this study, it moves from negative to positive
$z$
.
(iii) A phase angle is assigned to each PIV snapshot. All snapshots within a
$\pm 1.5^{\circ }$
window are averaged. Since 8000 snapshots per measurement are acquired, this leaves on average 66 snapshots per phase angle window. It is validated that the relative deviation in phase-averaged velocities converges to values lower than 2 % at each location.


The described procedure yields a time-resolved representative oscillation period that is referred to as the phase-averaged flow field
 $\boldsymbol{u}(\boldsymbol{x},\unicode[STIX]{x1D719})$
.
Phase averaging provides a temporal correlation between the individually measured velocity planes of the three-dimensional flow field. This enables the assembly of the sequentially measured, two-dimensional velocity planes to a three-dimensional flow field. Velocities in between the planes are interpolated using three-dimensional spline interpolation. The spline interpolation may impose local minima and maxima in the velocity field, which results in artefacts of the spatial gradients. In order to reduce this effect, the resulting flow field is smoothed by a self-optimized smoothing algorithm suggested by Garcia (Reference Garcia2010). This is based on a discrete cosine transformation of the flow field and a generalized cross-validation for adjusting the smoothing parameter. The resulting flow field is mirrored at the
 $x$
–
 $y$
planes at
 $z=0$
and phase shifted by
 $180^{\circ }$
, yielding the complete flow field.
The phase-averaged flow field is investigated and visualized using Eulerian and Lagrangian methods. Vortices are identified and localized using the
 $Q$
-criterion. Hunt, Wray & Moin (Reference Hunt, Wray and Moin1988) define vortices as a positive second invariant
 $Q$
of
 $\unicode[STIX]{x1D735}\boldsymbol{u}$
(3.1) in combination with the local pressure being lower than the ambient pressure. Although the local pressure is not measured, the
 $Q$
-criterion provides an indication of the location of vortices. For the additionally acquired velocity cross-sections of the flow field, the gradient in the
 $x$
direction is not available. There, a two-dimensional equivalent is used for identifying vortices (3.2). The correct vortex identification is validated by comparing the results qualitatively to the available three-dimensional flow fields.
 $$\begin{eqnarray}\displaystyle & \displaystyle Q=-\frac{1}{2}\left(\left(\frac{\unicode[STIX]{x2202}u}{\unicode[STIX]{x2202}x}\right)^{2}+\left(\frac{\unicode[STIX]{x2202}v}{\unicode[STIX]{x2202}y}\right)^{2}+\left(\frac{\unicode[STIX]{x2202}w}{\unicode[STIX]{x2202}z}\right)^{2}\right)-\frac{\unicode[STIX]{x2202}u}{\unicode[STIX]{x2202}y}\frac{\unicode[STIX]{x2202}v}{\unicode[STIX]{x2202}x}-\frac{\unicode[STIX]{x2202}u}{\unicode[STIX]{x2202}z}\frac{\unicode[STIX]{x2202}w}{\unicode[STIX]{x2202}x}-\frac{\unicode[STIX]{x2202}v}{\unicode[STIX]{x2202}z}\frac{\unicode[STIX]{x2202}w}{\unicode[STIX]{x2202}y} & \displaystyle\end{eqnarray}$$
 $$\begin{eqnarray}\displaystyle & \displaystyle Q_{x}=-\frac{1}{2}\left(\left(\frac{\unicode[STIX]{x2202}v}{\unicode[STIX]{x2202}y}\right)^{2}+\left(\frac{\unicode[STIX]{x2202}w}{\unicode[STIX]{x2202}z}\right)^{2}\right)-\frac{\unicode[STIX]{x2202}v}{\unicode[STIX]{x2202}z}\frac{\unicode[STIX]{x2202}w}{\unicode[STIX]{x2202}y}. & \displaystyle\end{eqnarray}$$
Lagrangian post-processing methods are enabled by tracing virtual particles through the phase-averaged, three-dimensional flow field using the fourth-order Runge–Kutta method. Tracing a high-resolution structured grid of virtual particles backward in time and highlighting all particles originating from the jet yields an instantaneous streak volume. This visualization technique is intuitive due to its similarity to ink visualization. It provides an overview of the qualitative behaviour and structure of the jet. However, it does not contain flow structures inside the cross-flow. For visualizing flow structures in the jet and cross-flow, the finite-time Lyapunov exponent (FTLE) is a suitable tool because it contains flow structures of the jet and the cross-flow (Haller Reference Haller2001). The FTLE quantifies the attraction rate of neighbouring virtual particles thereby highlighting dominant flow structures inside the flow field. Here, the backward FTLE is employed. Similar to the streak volume determination, virtual particles are placed on a structured grid inside the flow field at one specific time for determining the instantaneous FTLE field at this time. Next to each particle, three neighbouring particles are placed very close to the main particle (i.e.
 $|\unicode[STIX]{x0394}\boldsymbol{x}|=1~\unicode[STIX]{x03BC}\text{m}$
) for determining the attraction rate at this specific position. All virtual particles are traced through the flow field over two oscillation periods back in time with a time step size of
 $1/360$
th of one period length. The instantaneous position
 $\boldsymbol{x}$
of each particle is interpolated from the post-processed, three-dimensional, phase-averaged flow field. The flow field boundary conditions in the negative
 $x$
- and both
 $z$
-directions are set to steady cross-flow, which prevents particles from leaving the flow field. The resolution of the FTLE is equal the initial structured grid of virtual particles (without the respective neighbours). Iterative grid refinement at regions of high FTLE is applied for locally increasing this resolution. On average, 20 million virtual particles are traced per time step. Note again that the described Lagrangian post-processing methods are only applicable to the phase-averaged, three-dimensional flow field.
4 Results
The discussion of the presented results is divided into several parts. First, a qualitative overview of the flow field for three velocity ratios is given. This provides an initial insight into the flow field, highlighting the most prominent flow features. Thereafter, the jet trajectory is analysed quantitatively and potential challenges to determining the trajectory of spatially oscillating jets are discussed. Last, the effect of the oscillation frequency and its influence on the vortex dynamics is examined. It is noteworthy that the quasi-time-resolved three-dimensional velocity data sets analysed in this study are made available for download by Ostermann et al. (Reference Ostermann, Woszidlo, Nayeri and Paschreit2018b ).
Two parameters are varied independently in this study: the velocity ratio
 $R$
and the oscillation frequency
 $f_{osc}$
. Other parameters, such as the inclination angle or the oscillator geometry, are left for future parametric studies. The employed fluidic oscillator (figure 2) emits a spatially oscillating jet with specific oscillation characteristics (i.e. oscillation pattern). The oscillation pattern is characterized by the maximum deflection angle, the temporal variation of the deflection angle and the temporal variation of the jet properties (e.g. maximum jet velocity and jet momentum). Figure 4 displays the jet deflection angle and maximum jet velocity over one oscillation period as a characterization of the oscillation pattern. The jet properties are extracted from PIV data with the cross-flow present, thereby including potential cross-flow-induced effects. Therefore, the oscillation pattern is expected to differ from the results for a similar oscillator in a quiescent environment. Ostermann et al. (Reference Ostermann, Woszidlo, Nayeri and Paschereit2018a
) define the oscillation pattern for the same oscillator geometry in a quiescent environment. The deflection angle is the direction of the velocity vector with the maximum velocity magnitude in the wall-normal
 $y$
- and spanwise
 $z$
-directions. The maximum jet velocity is defined as the magnitude of this vector, including the streamwise component. It is evident that the employed fluidic oscillator design causes a predominate sinusoidal oscillation pattern with longer dwelling times of the jet at the maximum deflection angle of
 $\unicode[STIX]{x1D703}_{max}\approx 50^{\circ }$
. This corresponds to the opening angle of the outlet nozzle. The time it takes for the jet to switch to the other side is comparatively short. The maximum jet velocity also oscillates in time. This temporal oscillation is caused by the internal dynamics of the oscillator, which induces an oscillating pressure loss across the device (Woszidlo et al.
Reference Woszidlo, Ostermann, Nayeri and Paschereit2015). The jet velocity reaches its maximum before the jet is at its maximum deflection. Afterwards, the maximum velocity decreases until reaching its minimum when the jet starts to sweep to the opposite side. Note that the maximum velocity exceeds the theoretical bulk velocity at all times due to the internal boundary layers that reduce the effective exit area. Therefore, the actual velocity ratio is higher than the calculated velocity ratio based on the bulk velocity (2.1). The described oscillation pattern may change with varying supply rates. Based on the acquired data, it is validated that the changes in the oscillation pattern are negligible within the range of supply rates examined in this study. Nevertheless, the supply rate, expressed by
 $U_{bulk}$
, is kept constant for the majority of the velocity ratios. If not stated otherwise, the velocity ratio is set by adjusting the cross-flow velocity only. This prevents changing the oscillation pattern by not having to change the supply rate. Furthermore, this assures a constant quality of the phase-averaging process, which may also be linked to the jet supply rate due to the increasing oscillation frequency.
Oscillating jet properties with cross-flow present in the
 $x$
–
 $z$
plane at
 $y=0.2\,d_{h}$
. For
 $U_{bulk}=50~\text{m}~\text{s}^{-1}$
and
 $U_{\infty }=10~\text{m}~\text{s}^{-1}$
. Only every fifth data point is marked. The solid lines are spline regression lines.

4.1 Qualitative overview
Flow field visualization. The shading indicates the FTLE; its colour distinguishes between jet and cross-flow (i.e. orange: jet, blue: cross-flow). The dark surfaces indicate the interface between the jet and cross-flow. Annotations are explained in the text.

The three-dimensional, phase-averaged flow field for three velocity ratios is illustrated for half a period in figure 5. The FTLE is used for visualizing the flow features. A video that shows an animation of figure 5 for a complete period is provided as supplemental material (movie 1) available at https://doi.org/10.1017/jfm.2018.981. In the animation and online version of figure 5, the FTLE is coloured according to the origin of the particles forming the flow feature, which allows for distinguishing between flow features in the jet and in the cross-flow. A partly transparent, dark, thin surface delineates the interface between jet and cross-flow. Accordingly, it represents the envelope of the jet’s instantaneous streaklines. The spatial oscillation of the jet is evident in figure 5 for all velocity ratios. At
 $\unicode[STIX]{x1D719}=0^{\circ }$
the jet exits the nozzle without being deflected. At
 $\unicode[STIX]{x1D719}=90^{\circ }$
it is fully deflected for all velocity ratios. Besides these few similarities, it is apparent that the flow fields of the different velocity ratios differ fundamentally. At
 $R=1$
, the jet remains close to the wall. It does not penetrate deep into the cross-flow and its spanwise movement is very limited. This is a result of the small momentum difference between the jet and cross-flow, which prevents the jet from penetrating deeper into the cross-flow. Figure 5, feature (A), annotates the undisturbed boundary layer of the cross-flow, which indicates that the interaction between jet and boundary layer is limited to a small area downstream of the nozzle. No other dominant flow features are apparent, although some are indicated inside the jet (figure 5 feature B). In fact, a small vortex is occasionally present inside the jet, which is mainly interacting with the cross-flow boundary layer (Ostermann et al.
Reference Ostermann, Woszidlo, Nayeri and Paschereit2017b
).
For a velocity ratio of
 $R=3$
, the increased jet momentum yields a deeper penetration into the cross-flow in the wall-normal as well as in the spanwise direction (figure 5,
 $R=3$
). This enables the jet to affect a larger area downstream of the nozzle. The jet penetration is quantified in § 4.2. Compared to
 $R=1$
, the interaction between jet and cross-flow appears more complex. Dominant flow structures tear the structure of the jet apart yielding a convoluted interface between the jet and cross-flow. A dominant streamwise oriented vortex is formed when the jet is fully deflected at both sides (figure 5C). This streamwise vortex is convected downstream by the cross-flow (figure 5 feature D). The FTLE also exhibits some less dominant flow structures inside the cross-flow (figure 5 feature E). These structures are only indirect results of the spatially oscillating jet, as no jet particles are carried inside. The cross-flow boundary layer is significantly affected by the jet as almost no undisturbed boundary layer is apparent.
The complexity in the flow field of
 $R=5$
is even further increased compared to the other velocity ratios. As anticipated, the increased momentum allows for an even deeper jet penetration into the cross-flow in the wall-normal and spanwise directions. A local peak in the penetration is indicated by the FTLE (figure 5 feature F). A similar peak is observed for the same oscillator design in a quiescent environment by Ostermann et al. (Reference Ostermann, Woszidlo, Nayeri and Paschereit2018a
). This peak is caused by the oscillation pattern which implies that the maximum jet velocity magnitude occurs before the jet is fully deflected (i.e. during the movement from one side to the other). This temporal increase in jet velocity is accompanied by an increase in momentum, which causes a deeper penetration into the cross-flow. Presumably, the reasons for this effect not being visible for
 $R<5$
are the higher jet velocity and different vortex dynamics.
Another reason for the increased complexity in the flow field for the higher velocity ratios is the smaller distance between the flow features. Figure 5 (feature H) shows the two local maxima in the jet’s cross-flow penetration created by the jet half a period apart. For smaller velocity ratios, the
 $180^{\circ }$
symmetric counterparts of the flow features are not apparent because the streamwise extent of the data is limited.
The flow field of
 $R=5$
exhibits a different vortex dynamic compared to
 $R=3$
. The dominant vortices evident for
 $R=3$
(figure 5 feature C) are not as clear anymore, which is most likely a result of other structures interacting with these vortices. A new wake vortex that is oriented in the wall-normal direction is apparent for
 $R=5$
, which consists of particles originating from the cross-flow only (figure 5 feature G). This vortex is formed by the cross-flow between the wall and the jet downstream of the nozzle when the jet is fully deflected (i.e.
 $\unicode[STIX]{x1D703}_{jet}\approx 45^{\circ }$
). It is convected downstream before it dissipates after a short time. Generally, the FTLE shows that only streamwise vortices prevail far downstream beyond the end of the measured region. Spanwise- and wall-normal-oriented vortices are only present in the near field. Therefore, the streamwise vortices are of most interest for applications of spatially oscillating jets in cross-flow. A more quantitative investigation of these streamwise vortices is presented in § 4.4.
4.2 Jet trajectory
The visual inspection of the time-resolved flow field in § 4.1 reveals that the jet penetration is dependent on the velocity ratio. Generally, the jet penetration is best described by the jet trajectory. However, investigating the jet trajectory of a spatially oscillating jet is challenging because its trajectory is three-dimensional and time dependent. Mahesh (Reference Mahesh2013) suggests various definitions for jet trajectories, such as the streamline originating from the centre of the nozzle, the positions of local velocity maxima and the maximum scalar concentration. All suggested definitions for the jet trajectory are evaluated and found to be not well suited for the investigated spatially oscillating jet. Therefore, a different approach is pursued in this study. The maximum penetration is extracted from the time-averaged envelope covering all instantaneous streaklines originating from the nozzle. Hence, the envelope encloses the volume where at least one particle of the jet is located once in a period. Note that the streaklines are determined from the phase-averaged flow field, which eliminates any turbulent mixing.
Time-averaged envelopes of jet streaklines.

Figure 6 displays the envelope of streaklines for three velocity ratios. It is evident that the envelopes differ significantly in form and size. For
 $R=1$
and
 $R=3$
, the maximum penetration is achieved when the jet is fully deflected, which is a result of the jet’s long dwelling time at its maximum deflection allowing for a deep penetration into the cross-flow. In contrast,
 $R=5$
exhibits two local maxima of maximum penetration. The two maxima are caused by the temporal increase in jet penetration due to the change in maximum jet velocity, which is described in § 4.4 (figure 5 feature F).
Three maximum penetration lengths are considered for a quantitative analysis of the penetration at each position
 $x$
:
(i) the maximum penetration in the wall-normal direction
$y_{max}$
;(ii) the maximum penetration in the spanwise direction
$z_{max}$
;(iii) the maximum deflection-angle-independent penetration of the jet
$\unicode[STIX]{x1D70F}_{max}$
.


Additional adjustments are necessary in order to compare the results to steady jet trajectories. This is required because the employed definition considers streaklines originating from the complete nozzle, including the divergent part, instead of one line originating from the centre of the nozzle. The half-width of the nozzle orifice is subtracted in order to compensate for the different lengths of the jet being exposed to the cross-flow (figure 7). The nozzle orifice extends
 $-1.6\,d_{h}\leqslant z\leqslant 1.6\,d_{h}$
. Hence, the penetration in the spanwise direction is defined by
 $z_{max}^{\ast }$
by subtracting
 $1.6d_{h}$
and thus moving the origin of the streakline that causes the deepest penetration in the spanwise direction to
 $z=0$
(4.2). Accordingly, the streamwise coordinate
 $x$
is corrected by adding
 $0.5\,d_{h}$
because the nozzle extends
 $-0.5\,d_{h}\leqslant x\leqslant 0.5\,d_{h}$
and the streakline yielding the deepest penetration originates from the most upstream edge of the nozzle (4.1). The centre of the jet deflection is located upstream the orifice at
 $y=-1d_{h}$
(i.e. at the throat). Hence, the deflection-angle-independent penetration of the jet into the cross-flow
 $\unicode[STIX]{x1D70F}$
is also corrected, because the potentially angled jet is not fully exposed to the cross-flow due to the diverging part of the nozzle (4.3). Figure 7 delineates the corrected lengths on a two-dimensional slice through the envelope.
 $$\begin{eqnarray}\displaystyle & x^{\ast }=x+0.5\,d_{h} & \displaystyle\end{eqnarray}$$
 $$\begin{eqnarray}\displaystyle & z_{max}^{\ast }=z_{max}-1.6\,d_{h} & \displaystyle\end{eqnarray}$$
 $$\begin{eqnarray}\displaystyle & \displaystyle \unicode[STIX]{x1D70F}_{max}^{\ast }=\max \left[\left(1-\frac{d_{h}}{y+d_{h}}\right)\sqrt{(y+d_{h})^{2}+z^{2}}\right]. & \displaystyle\end{eqnarray}$$
The streakline envelope of
 $R=5$
with corrected penetration scales. The top view of the envelope (a) and a cross-section through the envelope at
 $x^{\ast }/d_{h}=6$
(b).

Although some corrections are applied, the employed method for extracting the penetration depths is an overprediction for the jet trajectory because it only yields the steepest trajectory. This trajectory is most likely not existent because the penetration depths are extracted from the time-averaged envelope. However, this method is suitable for discussing the maximum penetration of the jet into the cross-flow and provides an indication on how the penetration compares to steady jets. Figure 8 shows the maximum penetration depths. Similar to the trajectory of common steady jets, the coordinates are normalized by
 $Rd_{h}$
. This normalization was found to be suitable for the far field of steady jets (Mahesh Reference Mahesh2013). The penetration in the wall-normal direction,
 $y$
, of the spatially oscillating jet coincides well when normalized by
 $Rd_{h}$
. The offset that is evident for
 $R=1$
is caused by the determination of
 $U_{bulk}$
. The outlet velocity
 $U_{bulk}$
is determined assuming a top-hat velocity profile at the outlet throat. For small velocity ratios, it is suspected that the cross-flow causes a separation inside the nozzle exit, which increases the actual exit velocity, yielding a higher velocity ratio than expected. An envelope of steady jet trajectories from the literature is added to allow for a comparison of the wall-normal penetration between the spatially oscillating jet and the steady jet (Mahesh Reference Mahesh2013). Note that the limits for the steady jet trajectories do not represent actual trajectories but rather the limits of possible parameter configurations of (4.4). Mahesh (Reference Mahesh2013) provides the range for the respective parameters to be
 $1.2\leqslant A\leqslant 2.6$
and
 $0.28\leqslant B\leqslant 0.35$
spanning the envelope of possible trajectories and containing all experimental trajectories collected by Margason (Reference Margason1993).
 $$\begin{eqnarray}\frac{y}{Rd_{h}}=A\left(\frac{x}{Rd_{h}}\right)^{B}.\end{eqnarray}$$
Maximum extent of time-averaged streak volume envelope in the
 $y$
-direction (a), in the
 $z$
-direction (b) and the maximum total penetration (c). Only every 90th data point is marked.

Figure 8(a) reveals that the wall-normal penetration of a spatially oscillating jet is smaller than any common steady jet trajectory. Recalling that the pursued determination of penetration depths results in an overprediction of the trajectory emphasizes the effect, because the actual trajectory of the jet is expected to be even closer to the wall. The reason is the spatial unsteadiness of the jet, which does not provide enough time for the jet to penetrate deeper into the cross-flow, especially when it is in the process of moving from side to side. The penetration in the spanwise direction is even weaker than in the wall-normal direction (figure 8
b), which is a result of the limited jet deflection. Figure 8(b) indicates that the velocity ratio
 $R=5$
results in a higher penetration in the spanwise direction than
 $R=3$
in the far field, which is probably caused by differing vortex dynamics that is discussed in § 4.4. For
 $R=1$
, the penetration in the spanwise direction close to the nozzle is smaller than the considered nozzle correction of
 $1.6d_{h}$
. It is suspected that this is due to the cross-flow hindering the jet from attaching to the diverging walls of the outlet. The penetration in the wall-normal and the spanwise directions does not represent the maximum penetration into the cross-flow because the jet deflection angle is not considered. Taking into account the jet deflection yields the maximum deflection-angle-independent penetration
 $\unicode[STIX]{x1D70F}^{\ast }$
shown in figure 8(c). This quantity is best suited to be compared to steady jet trajectories because it represents the maximum penetration of the jet independent of the instantaneous deflection angle. For this penetration depth, the envelopes lay in between the trajectories of common steady jets in the near field. However, in the far field the gradient declines, yielding trajectories closer to the wall than steady jets. This decrease in gradient is caused by the fast decay in maximum velocity of the spatially oscillating jet as observed in a quiescent environment (Ostermann et al.
Reference Ostermann, Woszidlo, Nayeri and Paschereit2018a
).
The local jet deflection angle at
 $y=0.2\,d_{h}$
for four scenarios. Only every fifth data point is marked. The solid lines are spline regression lines.

It may be suspected that the changes in the jet trajectory are not only attributed to the velocity ratio but also to the jet velocity accompanied by varying oscillation patterns or different boundary layer characteristics (e.g. different momentum thickness) due to varying cross-flow velocities. Figure 9 shows the time-resolved deflection angle
 $\unicode[STIX]{x1D703}_{jet}$
as close to the nozzle as possible for four scenarios. Note that the deflection angle is extracted from the mirrored, three-dimensional flow field. For
 $R=3$
, the deflection angle is almost the same between scenario (b) and (c), which suggests that the different cross-flow and jet velocities do not have an influence. This similarity implies that the influence of the jet and cross-flow boundary layers is negligible for the selected velocities. Furthermore, the similarity between scenario (b) and (c) suggests that the oscillation pattern does not change with
 $U_{\infty }$
or
 $U_{bulk}$
for a given velocity ratio
 $R$
. The similar deflection angle in scenario (b) and (c) also reveals that the oscillation frequency, which is proportional to the jet velocity, also does not influence the deflection angle. However, due to the influence of the cross-flow, the deflection angle is affected by the velocity ratio as it is evident in the different deflection angles between the scenarios (a), (b) and (d). Hence, it is expected that in this study the velocity ratio is the only parameter affecting the jet trajectory. The reason for the independence of the flow field and the oscillation frequency is discussed in the following § 4.3.
4.3 Relationship between velocity ratio and Strouhal number
For the employed fluidic oscillator, the oscillation frequency is proportional to the supply rate when operated well within the subsonic regime. Figure 10(a) displays the oscillation frequency as a function of the jet exit velocity
 $U_{bulk}$
for the employed fluidic oscillator. A linear regression line emphasizes the linear dependency between the oscillation frequency and the jet velocity. This linear dependency is a consequence of the oscillator’s internal flow dynamics, which is discussed in detail by Woszidlo et al. (Reference Woszidlo, Ostermann, Nayeri and Paschereit2015). The linear relationship is limited to the subsonic flow regime as it is present for all supply rates in this study.
(a) The oscillation frequency over the supply rate. (b) The Strouhal number as a function of the velocity ratio.

Commonly, the effects of unsteady flow phenomena are compared by using the Strouhal number. Here, the Strouhal number is based on the oscillation frequency, the hydraulic nozzle diameter
 $d_{h}$
that quantifies the size of the oscillator, and the cross-flow velocity
 $U_{\infty }$
.
 $$\begin{eqnarray}St_{\infty }=\frac{f_{osc}\cdot d_{h}}{U_{\infty }}.\end{eqnarray}$$
Schmidt et al. (Reference Schmidt, Woszidlo, Nayeri and Paschereit2017) show that the product of oscillation frequency and a length quantifying the scale of the oscillator (e.g.
 $d_{h}$
) is a linear function of
 $U_{bulk}$
(4.6), which is independent of the oscillator scale and supply fluid (i.e. fluid density).
 $$\begin{eqnarray}f_{osc}\cdot d_{h}=St_{jet}\cdot U_{bulk}+D.\end{eqnarray}$$
The offset
 $D$
is negligibly small for the employed oscillator as evident in the linear regression in figure 10(a). When neglecting
 $D$
, the slope
 $St_{jet}$
is the jet Strouhal number that is constant for all supply rates within the incompressible regime. The jet Strouhal number depends on the design of the oscillator. When (4.6) with
 $D=0$
is substituted into (4.5), the Strouhal number becomes a function of the velocity ratio
 $R$
(4.7).
 $$\begin{eqnarray}St_{\infty }=\frac{St_{jet}\cdot U_{bulk}}{U_{\infty }}=St_{jet}\cdot R.\end{eqnarray}$$
Equation (4.7) illustrates that the Strouhal number is linearly coupled with the velocity ratio, which is validated in figure 10(b) for the investigated parameter combinations. Therefore, it is not possible in this study to change the Strouhal number and velocity ratio independently with the one employed oscillator design. In fact, if the oscillation frequency is varied by changing the jet velocity while maintaining the same velocity ratio (and therefore Strouhal number) the normalized flow field quantities do not change. This is confirmed in figure 11 by a cross-section through the time-averaged flow field for two parameter combinations that yield the same velocity ratio and Strouhal number. It is evident that the normalized velocities agree very well.
A cross-section through the time-averaged velocity field at
 $x/d_{h}=5.5$
for two oscillation frequencies at the same velocity ratio.
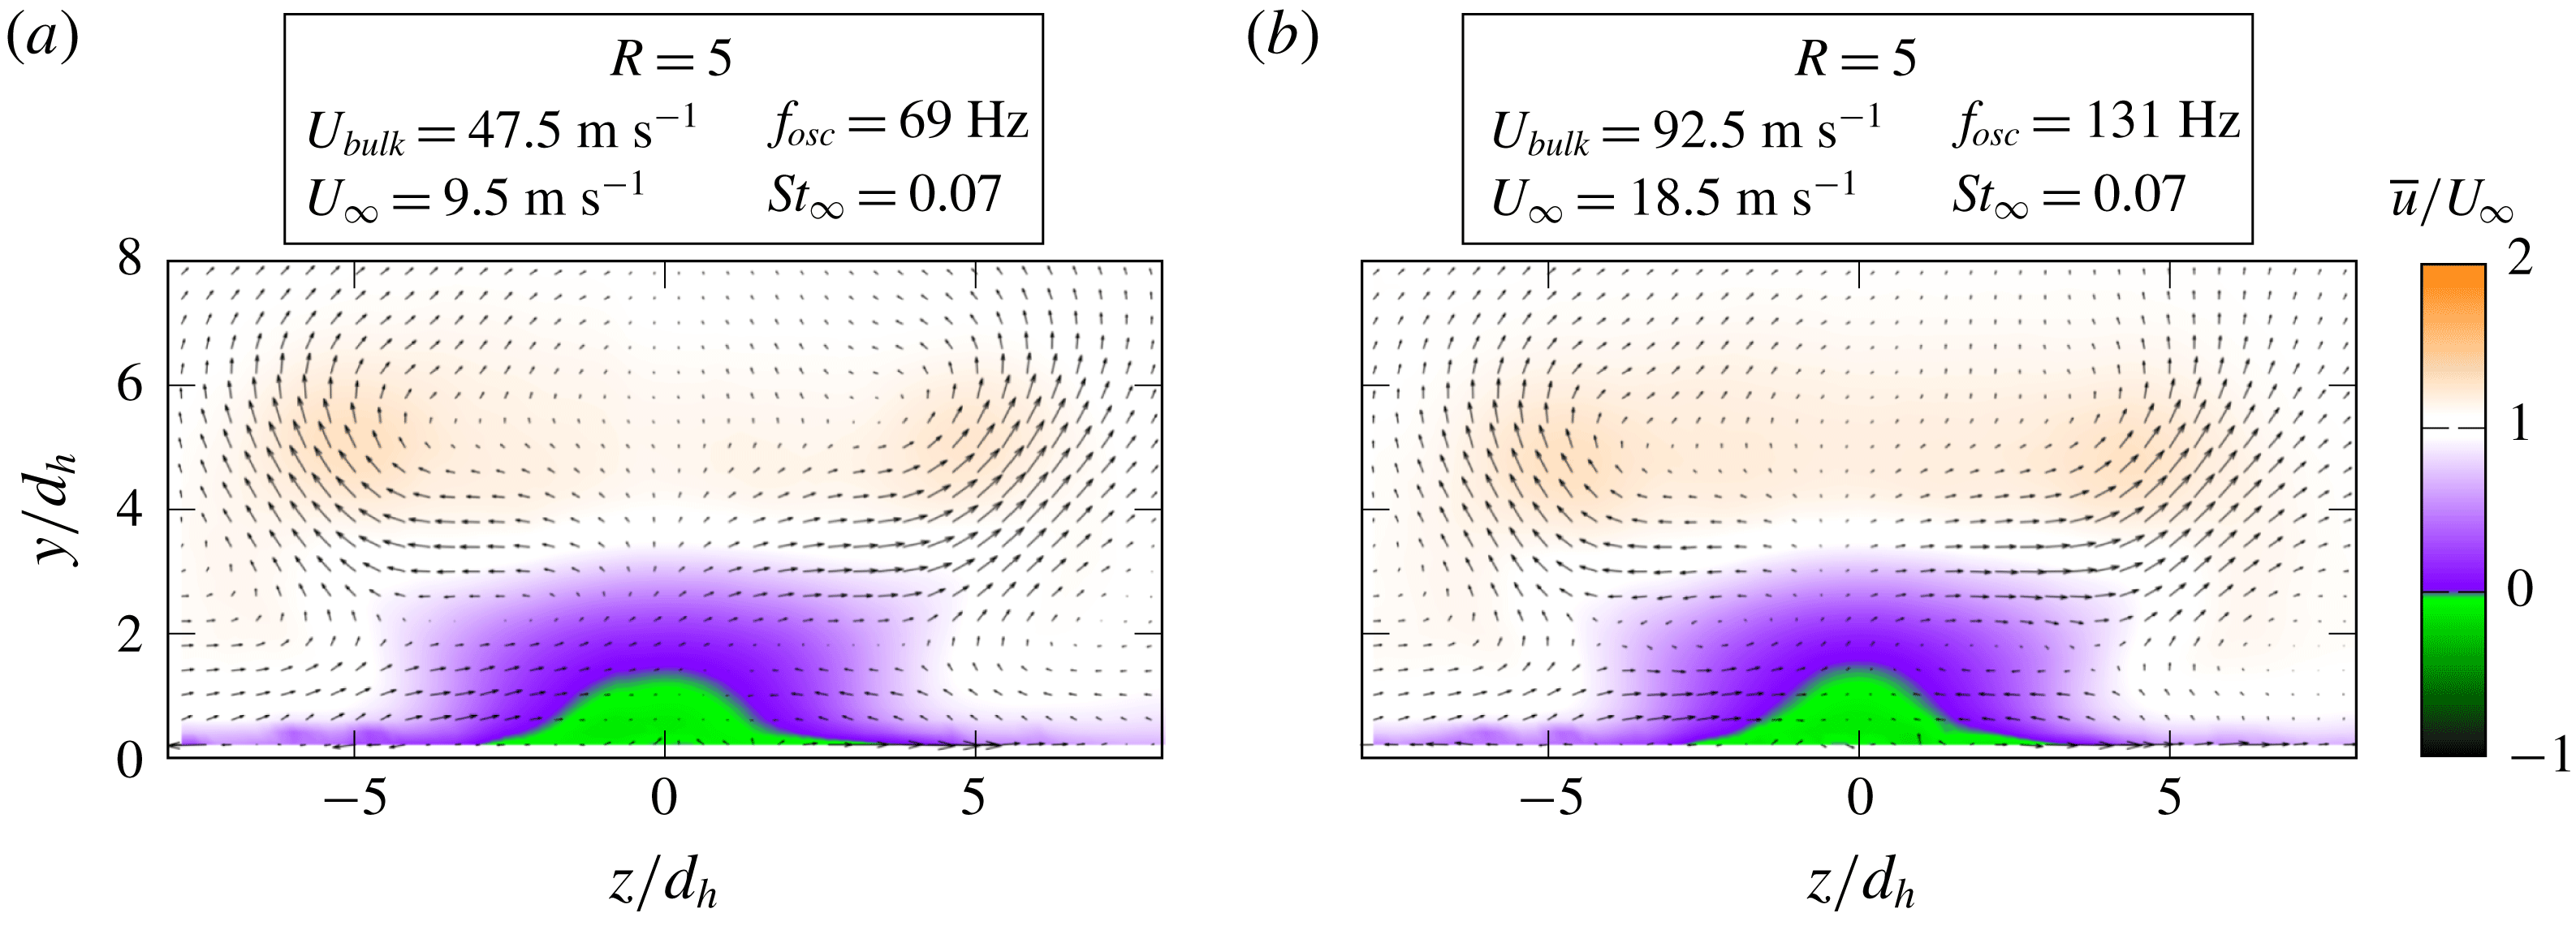
Since the Strouhal number is linearly dependent on the velocity ratio, the amount of parameters reduces to one. This prevents from distinguishing between the driving parameters behind effects described in this study. However, based on the general observations from steady and pulsed jets in cross-flow, and based on the character of the discussed effects, it can be assessed which parameter may be of more importance. For example, it is hypothesized that the penetration depth is more dependent on the velocity ratio than on the Strouhal number. In contrast, effects changing the dynamics of the flow field, as discussed in the subsequent section, are expected to be dominated by the Strouhal number. A complete confirmation of the provided discussions requires additional experiments or numerical studies with different velocity ratio to Strouhal number dependencies, which are beyond the scope of this work and left for future studies.
The coupling between Strouhal number and velocity ratio allows for transferring the results of this study to different set-ups employing the same oscillator design because the Strouhal number is independent of the oscillator scale and working fluid density according to (4.7) and Schmidt et al. (Reference Schmidt, Woszidlo, Nayeri and Paschereit2017). Hence, the results may be relevant to applications that generally use smaller oscillators at higher oscillation frequencies. However, this is limited by compressibility effects, which are not captured in the current study. Furthermore, the transferability is limited to the particular design because even small adjustments in the design (e.g. longer feedback channels) would result in a different jet Strouhal number
 $St_{jet}$
.
Cross-sections through the time-averaged flow field at
 $x/d_{h}=11$
. The streamwise velocity component
 $u$
(a), the streamwise vorticity (b) and the
 $Q$
-criterion (c). Note that only half of the flow field is shown (i.e.
 $z<0$
).

4.4 Vortex dynamics
In § 4.1, the FTLE enables the identification of dominant flow structures (figure 5). In this section, Eulerian analysis methods are employed to capture and explain the dynamics of the most dominant flow structures (i.e. the wake and the streamwise-oriented vortices) in more detail. First, the time-averaged flow field is assessed for various velocity ratios (i.e. Strouhal numbers), hence providing an overview of the flow features and the dependence on the velocity ratio. Then, the vortex dynamics is described using the time-resolved flow field for two velocity ratios accompanied by a discussion of mechanisms that govern these dynamics.
Figure 12 depicts the time-averaged flow field in a cross-section located at
 $x=11\,d_{h}$
for various velocity ratios. The vectors and streamlines visualize the direction and magnitude of the in-plane velocity vectors (i.e.
 $v$
and
 $w$
). Note that the shown field of view covers only half of the symmetric flow field. The streamlines indicate deviations from the symmetry that are negligible. Figure 12 omits small velocity ratios
 $R<3$
. However, the identified trends are transferable to smaller velocity ratios that are greater than one (Ostermann et al.
Reference Ostermann, Woszidlo, Nayeri and Paschereit2017b
). The quantities are normalized to enable a comparison between the velocity ratios. The vorticity is normalized by
 $St\cdot U_{\infty }$
. Since the Strouhal number is linearly dependent on the velocity ratio (4.7), the normalization by
 $St_{\infty }\cdot U_{\infty }$
is proportional to the jet velocity
 $U_{bulk}$
. Analogously, the two-dimensional
 $Q$
-criterion
 $Q_{x}$
is normalized by
 $St_{\infty }\cdot U_{\infty }^{2}$
that is proportional to the product of
 $U_{jet}$
and
 $U_{\infty }$
.
Figure 12(a) illustrates the time-averaged, streamwise velocity component
 $\overline{u}$
. It is apparent that with increasing velocity ratio a wake region forms, indicated by a significant streamwise velocity deficit. For
 $R=15$
even local regions with reverse flow are evident, which implies a considerable recirculation bubble downstream of the jet extending more than 10 nozzle diameters. Figure 12(b,c) depicts the time-averaged, streamwise vorticity
 $\overline{\unicode[STIX]{x1D714}_{x}}$
and two-dimensional
 $Q$
-criterion
 $\overline{Q_{x}}$
respectively. These quantities allow us to identify streamwise-oriented vortices in the cross-section. For small velocity ratios
 $R\leqslant 4$
, one vortex is indicated by the streamlines and
 $Q$
-criterion on either side of the line of symmetry. These symmetric vortices were previously discussed in figure 5. With increasing velocity ratio, the vortices move away from the wall and from the line of symmetry. Furthermore, the local maximum time-averaged vorticity of the vortices decreases. For
 $R\geqslant 5$
, new vortices evolve on either side of the line of symmetry. The resulting vortex pair is equal in strength and opposite in their sense of rotation.
Cross-sections through the phase-averaged flow field at
 $x/d_{h}=5.5$
for two velocity ratios each with the streamwise velocity component
 $u$
(a) and the streamwise vorticity
 $\unicode[STIX]{x1D714}_{x}$
(b). Note that only half of the flow field is shown (i.e.
 $z<0$
).

The existence of streamwise vortices in the time-averaged flow field emphasizes their dominance in the flow field. However, it is anticipated that their strength and location vary throughout the complete oscillation period. A cross-section through the phase-averaged flow field is displayed in figure 13 to assess the dynamic behaviour. The cross-section is placed at
 $x=5.5\,d_{h}$
. This location is preferred to the previous location (i.e.
 $x=11\,d_{h}$
) because it is located closer to the nozzle, which emphasizes the differences between the velocity ratios. The convection velocity of the flow features varies with the velocity ratio, resulting in a phase lag between the shown velocity ratios at one specific downstream location
 $x$
. A large distance to the nozzle would amplify this effect. However, it is noteworthy that the qualitative behaviour and findings made for this cross-section apply for the downstream positions as well. An animation of figure 13 over a complete period is available as supplemental material (movie 2).
Figure 13 demonstrates that the most dominant difference between the low and high velocity ratios is the wake downstream of the oscillating jet. For
 $R=3$
, only a small velocity deficit is evident, which forms downstream of the instantaneous jet position, following the jet motion. In contrast,
 $R=7$
exhibits an almost steady recirculation bubble downstream of the oscillating jet. The recirculation bubble does not follow the movement of the jet.
Traced vortex cores at
 $x/d_{h}=5.5$
. The arrows denote the sense of rotation. The shading indicates the vortex circulation within the measurement plane
 $\unicode[STIX]{x1D6E4}_{x}$
.

Figure 13 reveals that the vortex dynamics differs significantly between the velocity ratios. The position, the number, and the vorticity of the vortices change noticeably. The local maximum vorticity is higher for
 $R=3$
than for
 $R=7$
although it is normalized to account for the different velocity magnitudes. Furthermore, the vortices appear larger in size and two vortices are coexistent simultaneously during most of the period for the higher velocity ratio. The reason for this is a changing interaction between the jet and the cross-flow. For a more quantitative discussion of this effect, figure 14 delineates the
 $y$
- and
 $z$
-positions of the most dominant vortices as a function of the phase angle for three velocity ratios. The position of the vortices is identified using the two-dimensional
 $Q$
-criterion in combination with the vorticity in the
 $y$
–
 $z$
-plane at
 $x/d_{h}=5.5$
. The shading of the lines indicates the circulation
 $\unicode[STIX]{x1D6E4}_{x}$
of each vortex within the measurement plane, which is determined by integrating the connected regions of streamwise-oriented vorticity
 $\unicode[STIX]{x1D714}_{x}$
exceeding 25 % of the local maximum streamwise vorticity of the respective vortex. The data set is mirrored at
 $z=0$
in order to trace the vortices beyond the spanwise boundary of the measurement plane. Note that the entirety of the vortex circulation may not be captured when the vortex is close the outer boundary of the measurement domain.
For
 $R=3$
, the streamwise-oriented vortices are alternating in strength. They move from side to side following the movement of the jet (figures 13 and 14,
 $R=3$
). Only one vortex is dominant on either side of the line of symmetry. For
 $z<0$
this vortex is rotating in the positive direction. It is accompanied by a region of negative streamwise vorticity not forming an individual vortex, as visible in figure 13 (
 $R=3$
,
 $\unicode[STIX]{x1D719}=0^{\circ }$
). When the jet moves to the opposite side, three vortices are existent simultaneously at one instance of time (figure 13,
 $R=3$
,
 $\unicode[STIX]{x1D719}=60^{\circ }$
). One of these vortices represent the remnants of the former dominant vortex for
 $\unicode[STIX]{x1D719}=0^{\circ }$
that is located at the wall while the two new vortices enter the plane and follow the movement of the jet. Note that these new vortices are not captured in figure 14 because only the positions of the dominant vortices are shown. One of the two new vortices evident in figure 13 (
 $R=3$
,
 $\unicode[STIX]{x1D719}=60^{\circ }$
) becomes the dominant vortex at
 $z>0$
within this plane rotating in negative direction (figure 14,
 $R=3$
). The other one leaves the image plane resulting in the aforementioned region of streamwise vorticity accompanying the dominant vortex (analogue to figure 13,
 $R=3$
,
 $\unicode[STIX]{x1D719}=0^{\circ }$
).
The flow field for
 $R=7$
contains two dominant vortices with opposite sense of rotation on either side of the line of symmetry. These vortices are coexistent at one streamwise position
 $x$
and equal in strength and size. In comparison to
 $R=3$
, the vorticity of these vortices appears weaker but it is spread over a larger area (figure 13). The maximum normalized circulation of the individual vortices is slightly smaller than this of
 $R=3$
(figure 14). However, the sum of circulation magnitude induced by both coexistent vortices together may be increased. The positions of the vortices remain almost fixed without following the movement of the jet. When the jet moves to the opposite side, the vortex pair is convected by the cross-flow, thereby leaving the image plane and its
 $180^{\circ }$
-counterpart arrives in the image plane at the symmetric position (figure 14,
 $R=7$
). In comparison to
 $R=3$
, the flow field of
 $R=7$
exhibits an almost bi-stable behaviour with fixed vortices that exist through half of the period. Figure 14 also contains the position of the dominant vortices in the flow field of
 $R=15$
. It is evident that the qualitative vortex dynamics is similar between
 $R=15$
and
 $R=7$
although the position of the vortices changes due to the increased penetration depth. Furthermore, it is apparent that with increasing velocity ratio the relative duration of the vortices increases during one oscillation period. This increased relative vortex duration may also increase the duration of the circulation caused by the vortices and thereby increase the total circulation induced into the cross-flow over one period.
The observed differences in the vortex dynamics between the velocity ratios indicate a change in the interaction between jet and cross-flow. This is best described by using the Strouhal number because it is a characteristic metric for the dynamic behaviour of the flow field (4.5). Substituting the oscillation period time
 $f_{osc}=1/T_{jet}$
(i.e. the oscillator time scale) and a representative convective time scale of the cross-flow
 $T_{\infty }=d_{h}/U_{\infty }$
in (4.5) yields the ratio between the time scales (4.8).
 $$\begin{eqnarray}St_{\infty }=\frac{T_{\infty }}{T_{jet}}.\end{eqnarray}$$
With increasing Strouhal number, the ratio of time scales becomes larger, indicating that the difference in time scales between jet and cross-flow grows. Recalling that the Strouhal number is the ratio between local and global inertia, the time
 $T_{adapt}$
required by the cross-flow to adapt to a new flow situation due to its inertia is proportional to the convective time scale
 $T_{\infty }$
. Hence, the ratio between
 $T_{adapt}$
and
 $T_{jet}$
also increases with Strouhal number (4.9). This relationship supports the previous argument for the relative duration of the vortices increasing with Strouhal number between
 $R=7$
and
 $R=15$
in figure 14.
 $$\begin{eqnarray}\frac{T_{adapt}}{T_{jet}}\propto \frac{T_{\infty }}{T_{jet}}=St_{\infty }.\end{eqnarray}$$
The Strouhal number also points to the reasons for the apparent change in vortex dynamics between
 $R=3$
and
 $R=7$
(figure 13). For small Strouhal numbers (i.e.
 $T_{adapt}\ll T_{Jet}$
), the cross-flow is able to fully adapt to all instantaneous deflection angles of the jet. Therefore, the cross-flow experiences a quasi-steady jet with a changing deflection angle. This instantaneous jet behaves similar to a vortex-generating jet (VGJ) known from the literature (e.g. Johnston & Nishi Reference Johnston and Nishi1990; Rixon & Johari Reference Rixon and Johari2003). This is supported by the instantaneous flow field being qualitatively similar to the flow field of a VGJ. Vortex-generating jets create a pair of counter-rotating vortices with one dominant vortex. The other one, that is located between the angled jet and the wall, is much weaker (Rixon & Johari Reference Rixon and Johari2003). The instantaneous spatially oscillating jet exhibits the same vortex structure: one vortex is dominant and prevails downstream; the other vortex is weaker or only indicated by vorticity (figure 13,
 $R=3$
). The oscillating deflection angle of the jet causes the changing position of the vortices. It is also the reason for the observed, simultaneous existence of three vortices in figure 13 (
 $R=3$
,
 $\unicode[STIX]{x1D719}=60^{\circ }$
). When the jet exits the nozzle without a deflection, it acts similar to a conventional steady jet in cross-flow, forming a counter-rotating vortex pair. These vortices are convected downstream passing by the previous dominant vortex that is located inside the boundary layer and therefore experiences a smaller convection velocity.
For high Strouhal numbers (i.e.
 $T_{adapt}\rightarrow T_{jet}$
), the cross-flow is not able to fully adapt to the motion of the jet due to its inertia. Instead, the cross-flow experiences a quasi-steady delta-shaped jet and forms a corresponding quasi-steady wake including the recirculation bubble. This is evident for
 $R=7$
in figure 13 where the wake is fixed at one position and its shape does not change throughout the period. The jet’s oscillation pattern, which is characterized by long dwelling times at the maximum deflection, enables the jet to penetrate beyond the wake region when it is fully deflected. Therefore, the cross-flow experiences the jet at its maximum deflection as a periodically existent, angled, quasi-steady jet (i.e. similar to a pulsed VGJ) with a constant deflection angle of approximately
 $\unicode[STIX]{x1D703}_{max}=50^{\circ }$
at either side of the line of symmetry. This quasi-steady VGJ forms corresponding vortices that are evident in figure 14 (
 $R\geqslant 7$
). An increase in Strouhal number is accompanied by higher velocity ratios which increase the penetration depth of the jet (§ 4.2). This larger penetration increases the distance between the angled jet and the wall, which enables the jet to create two vortices that are equal in strength and size instead of one dominant vortex (figure 13,
 $R=7$
). Therefore, it may be expected that the number of dominant vortices is not solely dependent on the Strouhal number. Presumably, an oscillating jet that achieves a higher velocity ratio at smaller Strouhal number would exhibit two dominant vortices on either side although the cross-flow is able to fully adapt to the instantaneous deflection of the jet.
Normalized
 $x$
-location of the vortex with negative sense of rotation (i.e.
 $\unicode[STIX]{x1D714}_{x}<0$
) at
 $z>0$
as a function of time for various velocity ratios and oscillation frequencies. The dashed line represents a linear regression line.

Figure 5(F) suggests that the streamwise distance between the vortices decreases with velocity ratio and therefore Strouhal number. The streamwise distance
 $\unicode[STIX]{x0394}x$
is dependent on the convection velocity (4.10). The convection velocity may be determined by tracing the downstream position of the vortices.
 $$\begin{eqnarray}\unicode[STIX]{x0394}x=\frac{\text{convection velocity}}{f_{osc}}.\end{eqnarray}$$
Figure 15 shows the non-dimensional, streamwise position of one vortex extracted from three cross-sections located 5.5, 10 and 20 nozzle diameters downstream of the nozzle for various scenarios. The horizontal axis designates the oscillation periods and the vertical axis stands for the normalized convection velocity. The points mark the time stamps of the vortex being present in one specific cross-section. This time stamp is defined as the centre between the vortex entering and leaving the cross-section. It is evident that the streamwise vortex positions collapse onto a single straight line independent of the velocity ratio or oscillation frequency. The slope of this line is one. Therefore, the convection velocity of the vortices is equal to
 $U_{\infty }$
for all scenarios and downstream locations, which indicates that the vortices are transported outside the boundary layer. No Reynolds number effects are evident within the limits investigated in this study. Thus, the convection velocity
 $U_{\infty }$
governs the distance between the vortices (4.11). Replacing
 $f_{osc}=1/T_{osc}$
and
 $U_{\infty }=d_{h}/T_{\infty }$
in (4.11) yields the distance between the vortices as a function of the Strouhal number (4.13). Accordingly, the distance decreases with increasing Strouhal number. For
 $St_{\infty }\rightarrow \infty$
, the distance approaches zero, yielding a quasi-steady flow field. It is anticipated that a quasi-steady flow field is experienced long before
 $\unicode[STIX]{x0394}x$
approaches zero for two reasons. First, the cross-flow inertia causes the vortices to be sustained although the jet is not located at this position anymore. Second, possible upstream and downstream effects cause the vortices to interact with their predecessors from the previous period, supporting a quasi-steady behaviour. First indications for a quasi-steady flow field are evident for
 $R=15$
in figure 14, where the vortices last longer than the time that the jet is located at its maximum deflection angle. Similar observations are made for pulsed vortex-generating jets by Hansen & Bons (Reference Hansen and Bons2006), who state that the effect of the pulsed jet does not immediately end when the pulse is turned off.
 $$\begin{eqnarray}\displaystyle & \displaystyle \unicode[STIX]{x0394}x=\frac{U_{\infty }}{f_{osc}} & \displaystyle\end{eqnarray}$$
 $$\begin{eqnarray}\displaystyle & \displaystyle \unicode[STIX]{x0394}x=d_{h}\frac{T_{jet}}{T_{\infty }} & \displaystyle\end{eqnarray}$$
 $$\begin{eqnarray}\displaystyle & \displaystyle \frac{\unicode[STIX]{x0394}x}{d_{h}}=St_{\infty }^{-1}. & \displaystyle\end{eqnarray}$$
5 Conclusion
The presented study investigates the fundamental interaction between a spatially oscillating jet and a cross-flow. The oscillation plane is oriented perpendicular to the cross-flow to provide a fundamental scenario for comparison with a common steady jet in cross-flow. The velocity ratio and oscillation frequency are the considered parameters to understand the basic interaction between the jet and the cross-flow. Although the results of this study also suggest the importance of other parameters for applications (e.g. oscillation pattern, compressibility, ejection angles), a detailed parametric assessment is beyond the scope of this work and left for future experimental or numerical studies.
It is demonstrated that varying the oscillation frequency without changing the velocity ratio does not alter the normalized flow field. This is caused by the employed fluidic oscillator design that exhibits a linear dependency between supply rate and oscillation frequency. As a result, the Strouhal number is linearly coupled to the velocity ratio in this study, which prevents changing velocity ratio and Strouhal number individually. However, this also implies that the properties derived in this study are transferable to the same oscillator design with different scales or working fluids as long as no compressibility effects are present.
The cross-flow penetration of the spatially oscillating jet in the wall-normal direction is weaker than that of a comparable common steady jet in favour of a larger spanwise extent. This enables the jet to affect a considerably larger downstream region than a steady jet. It is suspected that the penetration depth in the wall-normal and spanwise directions depends mainly on the oscillation pattern and the velocity ratio. Presumably, the Strouhal number also has an effect due to the changing vortex dynamics that may alter the jet trajectory.
The investigated flow field is dominated by streamwise vortices that are located outside the boundary layer. These vortices may be one reason for the high efficacy of spatially oscillating jets for separation control or mixing enhancement because they induce considerable wall-normal and lateral velocities. The driving mechanism behind the vortices is similar to a vortex-generating jet with changing deflection angle. The number of the vortices (i.e. two or four) is proposed to depend on the velocity ratio that influences the jet’s penetration depth. The dynamic of the vortices is linked to the Strouhal number and velocity ratio. The Strouhal number determines whether the cross-flow is able to adapt to new flow field situations such as the jet’s changing deflection angle. With increasing Strouhal number, the cross-flow is not able to fully adapt to the changing jet deflection angle and forms a quasi-steady wake. The velocity ratio influences the size of this wake. The relative duration of the vortices at one streamwise position during one oscillation period increases with the Strouhal number. The vortices are convected downstream at the speed of the cross-flow. Therefore, the distance between the same vortices of two periods is inversely proportional to the Strouhal number. It is expected that increasing the Strouhal number beyond the investigated range in this study eventually yields a quasi-steady flow field.
It is noteworthy that the influence of the Strouhal number and the velocity ratio on the vortex dynamics is expected to be transferable to other types of spatially oscillating jets generated by means other than the employed fluidic oscillator. However, the linear relationship between velocity ratio and Strouhal number may differ for other fluidic oscillator designs. For future studies it is recommended to disconnect the two parameters and validate the arguments made in the current work. Furthermore, the influence of the jet’s oscillation pattern remains unknown and may also be subject of future numerical or experimental investigations.
Acknowledgement
The authors gratefully acknowledge the funding from the Deutsche Forschungsgemeinschaft (DFG Project 289230680).
Supplementary movies
Supplementary movies are available at https://doi.org/10.1017/jfm.2018.981.



