Implications
Results from this study highlight the importance of replacement strategy for the performance of the beef suckler herd. The comparison in phenotypic performance of two different replacement strategies (i.e. beef v. beef×dairy (BDX) cows) within the current study demonstrates that optimal replacement strategy is dependent on the traits of interest for the beef cow farmer.
Introduction
Profitable suckler cow systems are dependent on cows demonstrating high levels of reproductive efficiency and producing a calf of heavier weight for age from low input pasture-based systems (McGee et al., Reference McGee, Drennan and Caffrey2005a; Murphy et al., Reference Murphy, Drennan, O’Mara and McGee2008a). In Ireland beef cows are predominantly crossbred (DAFM, 2015/2016), which, depending on breed structure, can cause large variation in both cow and progeny performance (Murphy et al., Reference Murphy, Drennan, O’Mara and McGee2008b). Replacement strategy is one reason for differences in breed structure globally, where breeding females are either generated within the beef herd or from BDX female calves sourced from the dairy herd. This replacement strategy is operated across European countries (Bowman and Susmel, Reference Bowman and Susmel1979), New Zealand (Bown et al., Reference Bown, Muir and Thomson2016) and Australia (Cuthbertson et al., Reference Cuthbertson, Deland and Siebert1990). In Ireland replacements sourced from the beef herd are predominately a terminal type female with ~80% of beef cows bred to a late-maturing bull in 2016 (AIM, 2016). The antagonistic relationship between terminal and maternal traits (McHugh and Minogue, Reference McHugh, Evans, Amer, Fahey and Berry2012) has resulted in a reduction in cow milk yield and a decline in the reproductive performance of the beef herd nationally (Berry and Evans, Reference Berry and Evans2014) and internationally (Roughsedge et al., Reference Roughsedge, Amer, Thompson and Simm2005). Consequently, gene transfer between dairy and beef systems has been adopted (Berry et al., Reference Berry, Madalena, Cromie and Amer2006) in an attempt to overcome the loss of maternal traits within the beef herd in Ireland. At present, ~25% of Irish beef cow replacements are sourced from the dairy herd (Evans et al., Reference Evans, Kearney, McCarthy, Cromie and Pabiou2014).
Numerous studies have assessed the phenotypic performance of beef and BDX cows on economically important traits such as reproductive performance (Nelson and Beavers, Reference Nelson and Beavers1982; Drennan and Berry, Reference Drennan and Berry2006), intake and production performance (McGee et al., Reference McGee, Drennan and Caffrey2005b; Murphy et al., Reference Murphy, Drennan, O’Mara and McGee2008b), health, behaviour and progeny performance (Pahnish et al., Reference Pahnish, Brinks, Urick, Knapp and Riley1969; Goonewardene et al., Reference Goonewardene, Wang, Price, Yang, Berg and Makarechian2003). These studies showed that BDX cows produced heavier weanlings due to greater milk yield; however, there was a disparity in whether the reproductive performance and production efficiency of BDX cows is equal to that of a beef cow. To date however, no study has investigated the effect of replacement strategy across a range of breeds on both cow and progeny performance using a national dataset across a multitude of traits. Therefore, the objective of this study was to determine the effect of suckler cow replacement strategy on cow and calf performance using performance data from the Irish national beef herd.
Material and methods
Phenotypic data
Data from Irish beef herds recorded between 2012 and 2016, inclusive, were extracted from the Irish Cattle Breeding Federation (ICBF) database. Records were available on age at first calving (AFC), calving interval (CIV), survival to next lactation, calving difficulty score, perinatal mortality, weaning and carcass data. Information on environmental factors such as cow parity, calving dates and herd of calving, as well as breed composition were also included. Eight main breeds were represented in the dataset: Aberdeen Angus, Hereford, Limousin, Charolais, Simmental, Belgian Blue, Holstein and Friesian. Only cows with ⩾75% of their breed fraction known were retained, whereas cows with >50% dairy breed fractions were excluded from analysis. Cows were subsequently categorised based on replacement strategy as either beef (>40% total beef breed fraction) or BDX (between 40 and 50% total dairy breed fraction). For example, a cow with 46.75% Holstein, 50% Aberdeen Angus and 3.25% unknown breed fraction was classified was BDX, whereas a cow with 18.75% Aberdeen Angus, 21.75% Charolais, 50% Limousin and 9.5% unknown was classified as beef. After considering these edits, a total of 1 167 661 records existed in the original dataset.
Fertility and cow survival performance
For fertility and cow survival analysis a randomly selected 30% of the available data were retained for analysis, resulting in the retention of 348 262 calving events, from 7921 beef herds. Fertility phenotypes of AFC, CIV and cow survival were defined as outlined by Berry and Evans (Reference Berry and Evans2014). In summary, AFC was defined as the number of days from birth to first calving; only AFC recorded between 660 and 1278 days were retained. The number of days between two consecutive calving events for the same cow was used to determine CIV, only records between 300 and 800 days were retained.
Cow survival to next lactation was defined as whether or not a cow survived from one lactation to the subsequent lactation. Where no calving record existed for the consecutive defined lactation period, or if the cow was slaughtered or died on a farm within 400 days of calving, then the cow was assumed not to have survived. For CIV and cow survival only records from cows of parity 1 to 10 were retained and parity was categorised as 1, 2, 3, 4 and ⩾5.
Herd-year-season contemporary groups were generated for each trait separately using an algorithm described by Crump et al. (Reference Crump, Wray, Thompson and Simm1997). For CIV and cow survival, herd-year-season was defined as cows that calved in the same herd over a 10-day period; if <8 cows calved within this 10-day period, then the contemporary group was joined with the subsequent defined contemporary group, once the start date of the next group was within 182 days of the end date of the previous one. Herd-year-season for AFC was defined based on the herd-year-season of service as a nulliparae, with a herd of service considered as where the heifer resided 9 months before calving. Only heifers that remained in the same herd from 9 to 15 months before first calving were included in the analysis. Across all traits, only contemporary groups that included at least one beef and one BDX cow within the same herd-year-season were included in the analysis. Across all fertility traits, only herd-year-season with a minimum of 5 records were retained. After all edits, 11 718 records for AFC, 36 744 records (20 894 cows) for CIV and 23 702 records for cow survival remained (Table 1).
Number of animals, observations, contemporary groups (CG), herds, beef and beef×dairy animals for each trait

Calving performance
Calving performance analysis was based on a random selection of 30% of the national calving records recorded from 2012 to 2016, resulting in the retention 348 262 calving events from 154 738 cows. In Ireland, calving difficulty is subjectively scored on a scale of 1 to 4 (1=no assistance/unobserved, 2=slight assistance, 3=severe assistance or 4=veterinary assistance). Calving difficulty was used to define a further calving trait, calving dystocia. Calving dystocia was dichotomised into cows that required severe or veterinary assistance (scores 3 and 4; dystocia=1) and cows unobserved or no/slight assistance (scores 1 and 2; dystocia=0). Perinatal mortality encompassed stillbirths along with calf deaths recorded within 24 h of birth; these calves were coded separately (mortality=1) to calves where no mortality was recorded (mortality=0).
For all aforementioned calving traits (i.e. difficulty, dystocia and perinatal mortality), only herds recording between 1% to 10% dystocia and 1% to 15% stillbirths were retained for analysis. In addition, only records of singleton calves with a known dam were retained for analysis. Only records from cows of parity 1 to 10 were retained, and parity was categorised as 1, 2, 3, 4, and ⩾5.
A contemporary group for calving performance traits was defined as herd-year-season of calving separately for each trait using the Crump algorithm (Crump et al. Reference Crump, Wray, Thompson and Simm1997). Only contemporary groups with at least one recorded incidence of calving dystocia or calf perinatal mortality were retained for analysis for the corresponding trait. Only contemporary groups that contained at least one beef and one BDX cow were included in the final dataset. In addition, only contemporary groups with at least five records were retained. Following all edits, 26 758 calving difficulty, 18 286 dystocia and 29 544 perinatal mortality records remained (Table 1).
Progeny weaning performance
Data from 135 385 progeny weaned in years 2012 to 2016, collated from livestock auctions (hereon referred to as marts) and on-farm weighing were available for analysis. Animal price records were also obtained from the mart dataset. Weanlings were defined as male and female cattle aged between 6 and 12 months at the time of weighing (McHugh et al., Reference McHugh, Fahey, Evans and Berry2010). Only singleton weanlings weighing between 150 and 450 kg, with a known dam, herd of origin and weight date were retained for weaning weight analysis. For weaning price, only singleton weanlings sold between €200 and €1200 with a known dam, herd of origin and sale date were retained for analysis. Across all weaning traits, only progeny from parity 1 to 10 cows were retained, and cow parity was categorised as 1, 2, 3, 4, and ⩾5.
For weaning weight, contemporary groups were defined based on herd-year-season of weighing using the Crump algorithm. For weaning price, the contemporary group was created based on animals sold in the same mart on the same date. For both traits, only contemporary groups containing at least five records and where progeny from both beef and BDX cows were represented were retained. Following all edits, 31 584 weaning weight records remained from 1419 herds, along with 19 709 weanling price records from 12 553 herds sold across 75 marts.
Carcass data
Carcass data were available on 454 418 progeny and 54 671 cows slaughtered between 2012 and 2016. Carcass conformation and carcass fat were scored using the EU beef carcass classification (EUROP) grades transformed into a 1 to 15-point linear scale as outlined by Hickey et al. (Reference Hickey, Keane, Kenny, Cromie and Veerkamp2007).
Progeny carcass data were classified as young bulls, steers or heifers as outlined by Connolly et al. (Reference Connolly, Cromie and Berry2016). Young bulls were defined as entire males (i.e. not castrated) slaughtered between 12 and 24 months of age, >150 kg carcass weight and within the range of €2.80 and €5.50 price/kg. Steers were classified as castrated males slaughtered between 12 and 54 months of age, >200 kg carcass weight and between €2.50 and €5.50/kg. Heifers were then defined as females that did not produce a calf over their lifetime, aged between 12 and 48 months at slaughter, >180 kg carcass weight and €3.00 and €5.50/kg. Only singleton born animals with a known dam, age at slaughter and carcass type were retained for analysis.
Cows were defined as having a calving record within their lifetime, a known age at slaughter between 27 and 180 months and achieved a price per kilogram between €2.00 and €4.00 with a carcass weight of >200 kg. Across all carcass data (i.e. progeny and cow) carcass value was calculated per individual based on a price per kilogram multiplied by the carcass weight.
A contemporary group for progeny carcass data was defined based on herd-gender-season of slaughter and for cows was defined as herd-year-season of slaughter, using the Crump algorithm (Crump et al., Reference Crump, Wray, Thompson and Simm1997). For progeny carcass analysis, only contemporary groups with at least one progeny born to both beef and BDX cows were retained for analysis. For cow carcass data, only contemporary groups containing at least one beef and one BDX cow were retained for analysis. Across all progeny and cow carcass traits, only contemporary groups containing a minimum of five records were retained for analysis. Following all edits 21 900 progeny carcass data records from 13 178 herds and 6179 cull cow carcass data records from 4456 herds remained.
Genetic information
Predicted transmitting ability (PTA) recorded for all animals from the March 2016 national genetic evaluations was extracted from the ICBF database. For progeny traits (i.e. perinatal mortality, direct calving difficulty, carcass weight, fat and conformation) the cows PTA’s were used in the analysis. For traits related to the cow (i.e. AFC, CIV, cow survival, maternal calving difficulty, carcass weight, fat and conformation) the cows’ actual estimated breeding value (EBV; i.e. twice the published PTA value) was calculated. The calves’ sire PTA’s were used only for the direct calf traits related to calving difficulty, dystocia, perinatal mortality, carcass weight and fat; PTA’s of the calves’ sire were omitted for all cow traits.
Heterosis and recombination loss coefficient were calculated for each cow as:
 $$1{\minus}\mathop \sum\limits_{i{\equals}1}^n {\rm sire}_{i} {\times}{\rm cow}_{i} $$
and
 $$1{\minus}\mathop \sum\limits_{i{\equals}1}^n \left( {{\rm sire}_{i}^{2} {\plus}{\rm cow}_{i}^{2} } \right)\,/\,2$$
respectively, where sire i and cow i are the proportion of breed i in the sire and cow, respectively.
Data analysis
The effect of replacement strategy (i.e. BDX or beef cows) on AFC was quantified using a fixed effects model in PROC GLM (SAS Inst., Inc., Cary, NC, USA), with cow replacement strategy, contemporary group (herd-year-season of first service), heterosis and recombination loss coefficient of the cow along with the cows EBV for AFC included as fixed effects. The logit of the probability of a cow surviving to next lactation was modelled using logistic regression in PROC GENMOD (SAS Inst., Inc.), assuming a binomial distribution of data. Fixed effects included cow replacement strategy, contemporary group, cow parity, heterosis and recombination loss coefficient of the cow, along with the cows EBV for survival.
The effect of replacement strategy on calving difficulty score and CIV were analysed using a mixed model in PROC HPMIXED (SAS Inst., Inc.) with cow parity, replacement strategy, contemporary group, heterosis and recombination loss coefficient of the cow included as fixed effects for both traits. For calving difficulty score calf sex, PTA of the calf’s sire for direct calving difficulty, cow PTA for direct calving difficulty and cow EBV for maternal calving difficulty were also included as fixed effects. For CIV the cows’ previous calving difficulty score and the cows EBV for CIV were also included as fixed effects. Cow was included as a random effect when calving difficulty score and CIV were the traits under investigation.
For calving dystocia and perinatal mortality, the log of the odds of the trait was modelled using logistic regression in PROC GENMOD (SAS Inst., Inc.) assuming a binomial distribution of the errors. Fixed effects considered in all models included: replacement strategy, cow parity, calf sex, contemporary group, heterosis and recombination loss coefficient of the cow. For calving dystocia the cows PTA for direct calving difficulty, the cows EBV for maternal calving difficulty and the calves sire’s direct PTA for calving difficulty were also included as fixed effects. For perinatal mortality, the sire and cow’s PTA for direct calf perinatal mortality were included as fixed effects.
The effect of replacement strategy on weaning weight and price were analysed using a mixed model in PROC HPMIXED (SAS Inst., Inc.). Fixed effects for both traits were: cow parity, cow replacement strategy, contemporary group, calf sex, calf age at weaning, heterosis and recombination loss coefficient of the cow. An interaction between calf sex and age was also included as a fixed effect in the model for weaning weight and price. The sire of the calf PTA for carcass weight and the cows PTA for carcass weight were also included as a fixed effect for both traits. Cow was included as a random effect for weaning weight and price.
Progeny carcass traits of age at slaughter and carcass weight, fat, conformation, price per kilogram and overall carcass value were analysed using a mixed model in PROC HPMIXED (SAS Inst., Inc.). For progeny carcass traits fixed effects included in all models were: cow parity, cow replacement strategy, contemporary group and heterosis and recombination loss coefficient of the cow; cow was included as a random effect. Age at slaughter was included in the model for progeny carcass weight. For carcass fat and conformation the cow and sires corresponding PTA for the given trait were also included as a fixed effect.
For cow carcass traits fixed effects included in all models were cow parity, replacement strategy, contemporary group and heterosis and recombination loss coefficient of the cow; cow was included as a random effect. The cows EBV for carcass weight, carcass conformation, and fat was also included as fixed effects in the model for carcass weight, conformation and fat, respectively.
An interaction between replacement strategy and cow parity was considered in the models for calf traits (i.e. calving, weaning and carcass performance) and for cow traits (i.e. fertility performance, survival and carcass performance).
Results
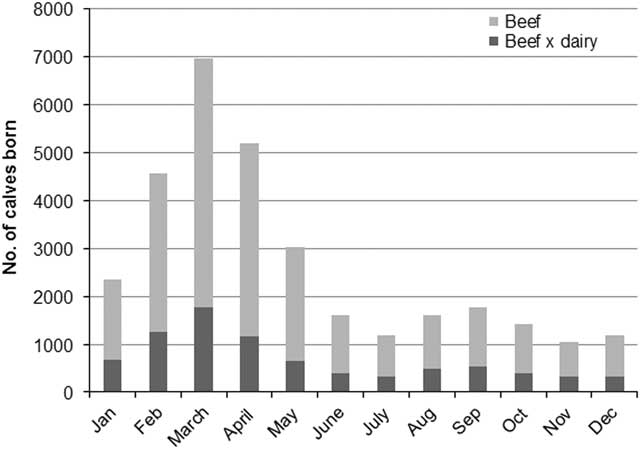
The majority of calvings (60%) occurred in spring calving months of January to April, with ~17% occurring in the autumn and winter months (September to December; Figure 1). Across the dataset breed compositions varied but remained steady over the time period of this study, with on average, 70% of cows comprised of entire beef bloodlines: Aberdeen Angus, Hereford, Limousin, Charolais, Simmental and Belgian Blue. The remaining 30% were BDX cows, with the dairy fraction comprised mainly of Holstein and Friesian (>93%). The average AFC was 924 (SD=145) days and average CIV was 374 (SD=46) days. The breakdown of male and female calves in the population was 51.3% and 48.7%, respectively. The average age at weaning was 240 (SD=41) days and weaning weight was 313 (SD=55.3) kg. Weanlings were sold for an average price of €820 (SD=€150).
Calving profile of number of beef and beef×dairy calves born by calendar month from years 2012 to 2016.

Reproductive performance and survival
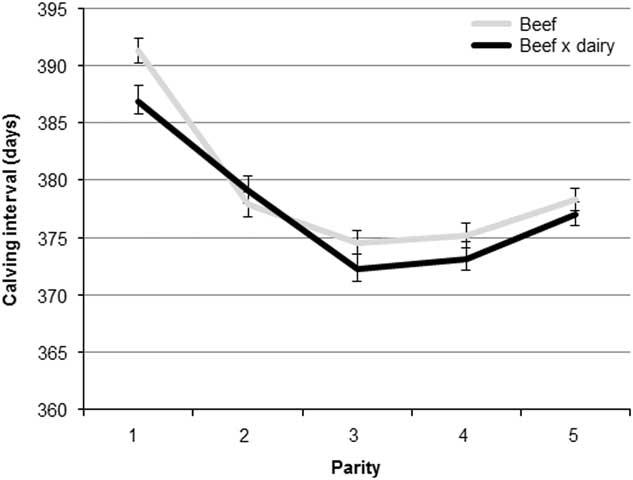
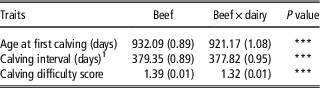
Relative to BDX, beef cows were 10.92±1.52 (P<0.001) days older at their first calving (Table 2). Calving interval was 1.53 days shorter (P<0.001) for BDX compared with beef cows. Cows with a calving difficulty score of 1 in the previous calving event had a subsequent recorded CIV of 375±0.3 days, whereas cows that were assigned a calving difficulty score of 4 had a CIV of 386±2.7 days (P<0.01). The association between replacement strategy and CIV differed by cow parity with greater CIV (P<0.01) associated with beef cows (391±1.1 days) relative to BDX (387±1.5 days) in first parity. However, from second parity and onwards CIV did not differ between beef and BDX (Figure 2).
Mean for calving interval (standard errors included in error bars) for beef and beef×dairy cows calving from the years 2012 to 2016.

Phenotypic mean (standard error in parenthesis) for age at first calving (days), calving interval (days) and calving difficulty score (score 1 to 4) for both cow replacement strategies

1 The effect of cow replacement strategy on calving interval differed by cow parity (P<0.001) (results shown in Figure 2); the association between cow replacement strategy and calving interval without the interaction term is shown here.
***P<0.001.
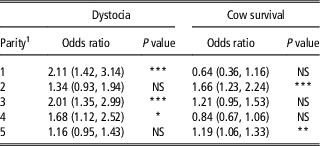
First parity cows were 19.69 times (95% confidence interval: 15.39 to 25.19; P<0.001) more likely to survive to the subsequent lactation compared with a fifth or greater parity cow. Relative to BDX, beef cows were 1.15 times (95% confidence interval: 1.05 to 1.27; P<0.01) more likely to survive to a subsequent lactation. When the interaction between replacement strategy and parity was investigated for cow survival (Table 3), second parity beef cows were 1.66 times (95% confidence interval: 1.23 to 2.24; P<0.001) more likely to survive to the next lactation compared with second parity BDX cows. In contrast, however, first parity BDX cows were 1.56 times (95% confidence interval: 0.87 to 2.80; P>0.05) more likely to survive to a subsequent lactation than beef.
Cow replacement strategy by parity odds ratios (upper and lower confidence intervals in parenthesis) with the associated P value, for calving dystocia and cow survival

NS=non-significant.
1 Relative to a beef×dairy cow for each corresponding parity level.
NS: (P>0.05); *P<0.05; **P<0.01; ***P<0.001.
Calving performance
Calving difficulty of cows was higher for male than for female calves (1.44±0.01 v. 1.27±0.01 respectively, P<0.001). Calving difficulty differed by replacement strategy (P<0.001), with a 0.06 greater calving difficulty score associated with beef (1.38) relative to BDX (1.32) cows (Table 2). Beef cows were 1.42 times (95% confidence interval: 1.21 to 1.66; P<0.001) more likely to experience dystocia than BDX. The effect of replacement strategy on calving dystocia differed by cow parity; first parity beef cows were 2.11 times (95% confidence interval: 1.42 to 3.14; P<0.001) more likely to experience dystocia than first parity BDX. However, calving dystocia did not differ by replacement strategy in second and fifth parity cows (Table 3).
First parity cows were 1.29 times (95% confidence interval: 1.02 to 1.64; P<0.05) more likely to lose a calf at birth compared with second parity cows. The BDX cows were 1.36 times (95% confidence interval: 1.19 to 1.55; P<0.001) more likely to have a dead calf at birth relative to beef cows.
Progeny weaning performance
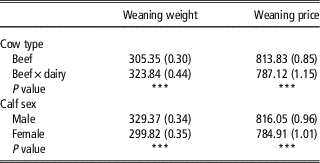
Calves weaned from BDX cows were 18.49±0.51 kg heavier at weaning compared with calves from beef cows (P<0.001), with male calves 29.55±0.43 kg heavier compared with females (P<0.001; Table 4). Despite lower weaning weights recorded for calves from beef cows, these calves achieved a greater weaning price (+€26.71) compared with BDX weanlings (P<0.001; Table 4).
Least squares phenotypic mean (standard error in parenthesis), with the associated P value, for weaning weight (kg) and weaning price (€) of progeny originating from beef and beef×dairy cows and of differing sex

***P<0.001.
Carcass performance
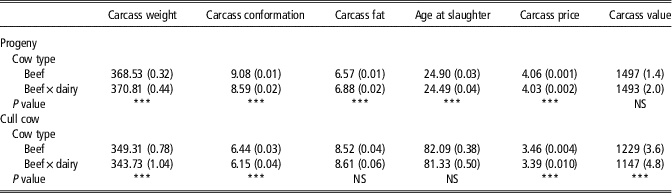
Progeny produced from BDX cows reached slaughter 12.80±1.24 days earlier than beef produced progeny (P<0.001) and when adjusted to common slaughter age, BDX progeny had a 2.28±0.12 kg heavier carcass weight compared with beef progeny (P<0.001; Table 5). Progeny born to BDX cows also had 0.31±0.01 greater fat score compared with beef progeny (P<0.001). However, beef progeny had superior conformation (0.5±0.01; P<0.001) compared with BDX. In addition, progeny born to beef cows achieved a greater price per kilogram compared with progeny from BDX cows (P<0.001) and ultimately a numerically higher overall carcass value (Table 5).
Least squares phenotypic mean (SE in parenthesis) with the associated P value, for carcass weight (kg), carcass conformation (scale 1 to 15), carcass fat (scale 1 to 15), age at slaughter (months), carcass price (€/kg) and carcass value (€) for beef or beef×dairy progeny and cows

NS=non-significant.
NS: P>0.05; ***P<0.001.
For cull cow carcass performance, beef cows had 5.58±1.17 kg heavier carcass than BDX cows (P<0.001). Beef cows also had superior carcass conformation, greater price per kilogram and greater overall carcass value compared with BDX (P<0.001; Table 5). However, no significant difference was observed in carcass fat score between beef and BDX cows.
Discussion
In Ireland, ~70% of suckler cows calve in spring (Berry and Evans, Reference Berry and Evans2014) and calves are weaned circa 8 months of age. In the region of 0.5 million weanlings are traded either on the farm or through marts annually in Ireland (AIM, 2016), highlighting the need for high milk yield suckler cows to produce a heavy calf at weaning. Crosson et al. (Reference Crosson, O’Kiely, O’Mara and Wallace2014) reported that profitable suckler cow production in Ireland is dependent on cows exhibiting high levels of reproductive efficiency, calving in spring and producing a heavy calf from grazed pasture. In this system, correct manipulation of cow replacement strategy is crucial to success. Therefore, the objective of this study was to evaluate the performance of two alternative replacement strategies, generating cows from the dairy herd or selecting from within the beef herd.
The population of beef and BDX cows represented in this study is comparable to previous national and international population statistics. Mean AFC of 2.5 years in the present study falls within the range of 2.03 to 3.51 years observed across a variety of beef breeds by Dákay et al. (Reference Dákay, Márton, Keller, Fördös, Török and Szabó2006). The overall perinatal mortality rate of 9% extrapolated in the present study is similar to those reported by Baker et al. (Reference Baker, Carter, Morris and Johnson1990). Weaning weights are highly dependent on production system and age at weaning, however, the average weaning weight reported in the present study was within the range reported previously in Irish (McHugh et al., Reference McHugh and Minogue2011) and international (Syrucek et al., Reference Syrucek, Kvapilik, Barton, Vacek and Stadnik2017) beef production systems. Weight at the slaughter of progeny in the present study was 60 kg heavier than the carcass performance reported by Murphy et al. (Reference Murphy, Drennan, O’Mara and McGee2008a), however, these animals were slaughtered 4 months earlier than progeny in the present study.
Previous studies that have investigated the role of replacement strategy on-farm performance have tended to adjust for breed proportions (Crosson, Reference Crosson, McGee and Prendiville2008), however, within the present study, a unique approach was undertaken whereby each trait was adjusted based on the genetic merit of the parents rather than breed alone. This approach ensures each trait is not only corrected for the breed average but also for individual animals deviation from the breed averages. In Ireland, there is a large divergence in breed type based on replacement strategy. In the current study, 90% of beef cows contained at least 50% continental bloodlines. In contrast, 43% of BDX cows were sired by early maturing traditional breeds. When EBV data was omitted from the model and replaced with individual breed proportions, the relative ranking of suckler v. BDX cows did not differ (results not shown).
Reproductive performance and survival
Age at first calving has two dependent components – the age at puberty and environment. Results from the current study showed that BDX calved approximately a week earlier than beef which corroborates the findings of Newman and Deland (Reference Newman and Deland1991). Differences in AFC between BDX and beef heifers were previously found by Prendiville and McHugh (Reference Prendiville and McHugh2014) which attributed the 8-day earlier AFC for BDX to an earlier onset of puberty.
The practice of culling cows for failure to wean a calf may account for greater survival rates of beef relative to BDX cows, as a greater calf perinatal mortality rate was observed in BDX compared with beef cows in the current study. In addition, greater beef cow survival compared with BDX may be a reflection of farm management consideration for physical attributes of progeny produced. The superior carcass conformation and carcass value attained for beef progeny in the present study provides more suitable cattle for the Irish export market which is of increasing importance to the Irish beef industry (BordBia, 2015/16) and the increased demand for more terminal animals with greater muscularity for export.
Greater CIV was associated with beef cows relative to BDX in the current study and is similar to results reported in Australia by Newman and Deland (Reference Newman and Deland1991). The shorter CIV associated with first parity BDX in comparison to first parity beef cows may be attributed to the earlier AFC recorded for BDX, which therefore provides the cows with an extended opportunity to resume oestrus and are potentially available to breed sooner than beef cows. The earlier AFC advantage for BDX, however, was only detected in first parity in the current study and may explain why no difference between replacement strategy and parity is therefore found in following lactations.
Calving performance
Male calves in the current study were found to have more difficult calvings than females which may be attributed to greater birth weights generally associated with male calves (Laster et al., Reference Laster, Glimp, Cundiff and Gregory1973; McDermott et al., Reference McDermott, Allen, Martin and Alves1992). Results from the current study also corroborate the findings of Nelson and Beavers (Reference Nelson and Beavers1982) who reported that BDX had a lower incidence of dystocia compared with beef breeds. Conversely, Murphy et al. (Reference Murphy, Drennan, O’Mara and McGee2008b) showed that BDX was intermediate for calving difficulty score between cows from continental Charolais and Limousin breeds. Menissier and Foulley (Reference Menissier and Foulley1979) outlined that incompatibility between calf birth weight and the pelvic opening of the dam, or calf birth weight as a proportion of cow weight as illustrated by Zaborski et al. (Reference Zaborski, Grzesiak, Szatkowska, Dybus, Muszynska and Jedrzejczak2009), are some of the main factors influencing dystocia. As birth weight was unavailable, it can only be assumed that BDX possibly produced calves of lower birth weight in proportion to their own weight in comparison to beef cows. Results from the current study concluded BDX were more likely to have a dead calf at birth than beef cows. This is in contrast to Baker et al. (Reference Baker, Carter, Morris and Johnson1990) who reported 4% mortality for Friesian BDX cows compared with 14% for Charolais, and Reynolds et al. (Reference Reynolds, Bellows, Urick and Knapp1986) who found no difference in calf survival rate across cow breeds of Angus, Hereford, Charolais or Brown Swiss. Greater occurrence of perinatal mortality for first parity compared with second parity cows can be explained by the increased levels of dystocia observed. When dystocia was included in the model for perinatal mortality in the current study, it accounted for the divergence and rendered the difference non-significant between primiparous and second parity cows.
Progeny weaning performance
As expected, the current study found male calves to be 30 kg heavier than female calves at weaning. This is similar to findings of Pahnish et al. (Reference Pahnish, Brinks, Urick, Knapp and Riley1969) and Goonewardene et al. (Reference Goonewardene, Wang, Price, Yang, Berg and Makarechian2003), although these studies indicated a smaller difference between male and female weaning weights than in the current study. Weaning weights of French specialized beef cattle breeds ranged from 33 to 56 kg lighter than the average weaning weight within this dataset (Phocas and Laloë, Reference Phocas and Laloë2004), although taken 30 days earlier than the average weaning weight age in the current study. Progeny from BDX were heavier compared with progeny from beef cows which supports the findings of Murphy et al. (Reference Murphy, Drennan, O’Mara and McGee2008b). Additional milk yield of BDX (McGee et al., Reference McGee, Drennan and Caffrey2005a; Murphy et al., Reference Murphy, Drennan, O’Mara and McGee2008b) is a large contributor to the greater weaning weights of BDX progeny compared with beef cow progeny. However, the price received for progeny from beef cows at weaning was €27 greater than for progeny of BDX despite differences in weaning weight. This highlighted the market demand for the more terminal or continental muscular type animal.
Carcass performance
The greater carcass weight observed for BDX progeny in the present study compared with beef progeny may be attributed to the greater weaning weight associated with BDX progeny. Previous work has shown that live weight differences at weaning are likely to remain through to slaughter (Murphy et al., Reference Murphy, Drennan, O’Mara and McGee2008a). However, the differential between BDX and beef progeny in weaning weight compared with carcass weight had reduced significantly, which may be explained by differences in feed efficiency between beef and dairy bred animals (Archer et al. Reference Archer, Richardson, Herd and Arthur1999). Consistent with the findings of the present study, Murphy et al. (Reference Murphy, Drennan, O’Mara and McGee2008a) also reported that BDX progeny had 0.42 units greater fat score at slaughter than beef progeny. This may be attributed to the difference in the deposition of perinephric and retroperitoneal fat between dairy and beef breeds, indicating a greater stage of maturity in dairy animals, as illustrated previously by Kirkland et al. (Reference Kirkland, Keady, Ingram, Steen, Comerford, Patterson and Mayne2004). The greater conformation score of beef cow progeny compared with BDX progeny is in agreement with that found by Kirkland et al. (Reference Kirkland, Keady, Ingram, Steen, Comerford, Patterson and Mayne2004) and Drennan et al. (Reference Drennan, McGee and Keane2008).
Cull cow performance in the present study showed that beef cows had a greater carcass weight and conformation score compared with BDX cows. This may be attributed to the emphasis placed on terminal traits within the beef herd (McGee, Reference McGee2012). However, there is a lack of data with regard to BDX cows at slaughter. Findings of Bown et al. (Reference Bown, Muir and Thomson2016) showed Friesian dairy cows achieved a lower value in the carcass payment scheme compared with beef cows which was attributed to the different fat distribution and muscle structure between beef and BDX cows. As BDX are intermediate between pure dairy and beef, they are valued higher than those reported by Bown et al. (Reference Bown, Muir and Thomson2016) but still received a lower price per kilogram compared with beef in the current study.
Conclusion
One of the impacts on profitability within the suckler beef herd is the replacement strategy policy employed (Crosson, Reference Crosson, McGee and Prendiville2008). Results from this study provided a detailed comparison of the performance of beef and BDX cows in the Irish national suckler herd and potentially may be used to support further modelling research such as detailed by Crosson et al. (Reference Crosson2006) and Puillet et al. (Reference Puillet, Agabriel, Peyraud and Faverdin2014). Suckler cows generated from crossbreeding with dairy cows exhibited superior reproductive efficiency and generated heavier calves at weaning via greater levels of milk production which ensured greater carcass weight. However, the lower calf perinatal mortality, greater cow survival rates, superior conformation of progeny and cull cows resulted in greater output prices received for beef cows generated within the suckler herd. Therefore, the optimal replacement strategy is dependent on the trait of interest for an Irish beef cow farmer and the system of production.
Acknowledgements
The authors gratefully acknowledge the Irish Cattle Breeding Federation for the data resource. This work was supported by the Teagasc Walsh Fellowship Program.
Declaration of interest
The authors wish to confirm that there are no known conflicts of interest associated with this publication and there has been no significant financial support for this work that could have influenced its outcome.
Ethics statement
The authors confirm that no aspect of the work covered in this manuscript involved experimental animals.
Software and data repository resources
None of the data were deposited in an official repository.