Introduction
Age-related macular degeneration (AMD) is the first cause of central vision loss in the elderly population in developed countries. It mainly affects people over the age of 50 (Klein et al., Reference Klein, Klein and Linton1992, Reference Klein, Peto, Bird and Vannewkirk2004; Vingerling et al., Reference Vingerling, Dielemans, Hofman, Grobbee, Hijmering, Kramer and de Jong1995; Friedman et al., Reference Friedman, O’Colmain, Munoz, Tomany, McCarty, de Jong, Nemesure, Mitchell and Kempen2004). This disease affects the central area of the retina and is essentially characterized by a decrease in visual acuity associated with metamorphopsia and central scotoma (Young, Reference Young1987; Penfold et al., Reference Penfold, Madigan, Gillies and Provis2001; Hera et al., Reference Hera, Keramidas, Peoc’H, Mouillon, Romanet and Feige2005; Kulkarni & Kuppermann, Reference Kulkarni and Kuppermann2005). The loss of central vision affects many daily activities (Mangione et al., Reference Mangione, Gutierrez, Lowe, Orav and Seddon1999), such as reading (Legge et al., Reference Legge, Ross, Isenberg and LaMay1992; Fine & Peli, Reference Fine and Peli1995; Fletcher et al., Reference Fletcher, Schuchard and Watson1999), driving (Rovner & Casten, Reference Rovner and Casten2002), face recognition (Bullimore et al., Reference Bullimore, Bailey and Wacker1991; Peli, Reference Peli1994; Tejeria et al., Reference Tejeria, Harper, Artes and Dickinson2002) and facial emotions (Boucart et al., Reference Boucart, Dinon, Despretz, Desmettre, Hladiuk and Oliva2008b), scene recognition (Boucart et al., Reference Boucart, Despretz, Hladiuk and Desmettre2008a), or mobility (Salive et al., Reference Salive, Guralnik, Glynn, Christen, Wallace and Ostfeld1994; Hassan et al., Reference Hassan, Lovie-Kitchin and Woods2002). The consequence is a decrease in quality of life (Brown et al., Reference Brown, Brown, Sharma, Landy and Bakal2002) that could sometimes result in social isolation and depression (Brody et al., Reference Brody, Gamst, Williams, Smith, Lau, Dolnak, Rapaport, Kaplan and Brown2001; Rovner & Casten, Reference Rovner and Casten2002). The understanding of the functional adaptation mechanisms and the identification of the visual functions that are preserved despite the development of the central macular lesion are key issues in research and clinical practice for the patient’s psychosocial adaptation as well as the set up of adapted rehabilitation procedures (Mitchell & Bradley, Reference Mitchell and Bradley2006).
Many studies have focused on low-level visual processes in patients with AMD. The decrease of contrast sensitivity in these patients has been clearly demonstrated by a number of experiments with simple stimuli-like gratings and letters (Kleiner et al., Reference Kleiner, Enger, Alexander and Fine1988; Midena et al., Reference Midena, Degli Angeli, Blarzino, Valenti and Segato1997; Faubert & Overbury, Reference Faubert and Overbury2000). Other research pointed to an impairment in shape discrimination of simple radial frequency patterns (Wang et al., Reference Wang, Wilson, Locke and Edwards2002). Studies on the recognition of alphanumeric characters (Legge et al., Reference Legge, Rubin, Pelli and Schleske1985, Reference Legge, Ross, Isenberg and LaMay1992; Fine & Peli, Reference Fine and Peli1995; Wang et al., Reference Wang, Wilson, Locke and Edwards2002) provided evidence for the deleterious impact of central scomata on reading performance. There is scarce research on the abilities of AMD patients to process and recognize complex visual stimuli, such as faces and scenes. The studies revealing a face recognition deficit in AMD patients have not directly addressed the nature of the impaired visual component in face recognition processes. They actually explored the relationship between low-level visual processes, evaluated through clinical measures of visual functions (e.g., visual acuity, contrast sensitivity), and high-level visual processing that were approached via the performance on visual cognitive tasks involving face recognition (Bullimore et al., Reference Bullimore, Bailey and Wacker1991; Tejeria et al., Reference Tejeria, Harper, Artes and Dickinson2002).
Only, Boucart et al. (Reference Boucart, Dinon, Despretz, Desmettre, Hladiuk and Oliva2008b) investigated directly the core visual mechanism underlying the recognition deficit of facial emotional expressions in AMD patients. They showed that the patients could identify facial emotions when the decision relied on low spatial frequency (LSF) information. The perception of finer details conveyed by high spatial frequency (HSF) information was impaired. However, in this study, the HSF processing deficit in AMD patients was rather inferred than clearly demonstrated because the spatial frequency content of the faces was not manipulated explicitly. The aim of the present research was to investigate this functional hypothesis by manipulating the spatial frequency of the components of natural scene images as we did in previous behavioral, neuropsychological, and neuroimaging studies (Peyrin et al., Reference Peyrin, Chauvin, Chokron and Marendaz2003, Reference Peyrin, Baciu, Segebarth and Marendaz2004, Reference Peyrin, Chokron, Guyader, Gout, Moret and Marendaz2006a,Reference Peyrin, Mermillod, Chokron and Marendazb, Reference Peyrin, Michel, Schwartz, Thut, Seghier, Landis, Marendaz and Vuilleumier2010; Cavézian et al., Reference Cavézian, Gaudy, Perez, Coubard, Doucet, Peyrin, Marendaz, Obadia, Gout and Chokron2010). As face recognition, scene perception is impaired in AMD patients (Boucart et al., Reference Boucart, Despretz, Hladiuk and Desmettre2008a). Object categorization (animals or faces) in natural scene photographs was clearly impaired in comparison to age-matched healthy participants, even if the color information as well as the suppression of the background drastically helps the perception.
There is considerable evidence suggesting that spatial frequency information is one of the most diagnostic low-level visual features involved in the perception of natural images. Indeed, visual perception is fundamentally based on spatial image processing that can be characterized in terms of Fourier components: the amplitude spectrum that summarizes the image in terms of spatial frequencies and orientations as well as the phase spectrum that describes spatial relationships between spatial frequencies (Ginsburg, Reference Ginsburg, Boff, Kauman and Thomas1986; Hughes et al., Reference Hughes, Nozawa and Kitterle1996). On the one hand, the primate primary visual cortex is widely dominated by complex cells that preferentially respond to orientation and spatial frequency (DeValois et al., Reference DeValois, Albrecht and Thorell1982; Shams & von der Malsburg, Reference Shams and von der Malsburg2002). On the other hand, simulation and psychophysical experiments showed that the information from low/medium frequencies of amplitude spectrum is sufficient to categorize scenes (Torralba & Oliva, Reference Torralba and Oliva2003; Guyader et al., Reference Guyader, Chauvin, Peyrin, Herault and Marendaz2004). This suggests that visual recognition is predominantly based on the spatial frequency (Fourier) analysis of the image. Given the fundamental role of spatial frequencies in visual perception, it seems extremely relevant to evaluate AMD patients’ abilities to process spatial frequency information during the perception of complex visual stimuli-like photographs of natural scenes.
The present research was designed to investigate the residual abilities in AMD patients to process spatial frequencies in natural environments. AMD patients and age-matched healthy participants had to categorize natural scenes (indoors and outdoors) that were filtered in LSF and HSF in two experiments. Within the visual system, the magnocellular (M) pathway conveys LSF information, while the parvocellular (P) pathway mainly conveys HSF information (Van Essen & DeYoe, Reference Van Essen, DeYoe and Gazzaniga1995). The M pathway originates from parasol retinal ganglion cells, and the P pathway originates from midget ganglion cells. Thus, the P pathway mainly conveys visual information, such as HSF from central retina, whereas the M pathway conveys visual information, such as LSF from peripheral retina (Dacey & Packer, Reference Dacey and Packer2003; Callaway, Reference Callaway2005; Lee et al., Reference Lee, Telkes and Grünert2005). According to the central position of the retinal lesion and the neurophysiology of the P and M pathways, we hypothesize that AMD patients will be deficient on the categorization of HSF scenes. We therefore expected that AMD patients would have difficulties when categorizing HSF scenes relative to age-matched healthy participants. Their performance should be relatively preserved during the categorization of LSF scenes.
Experiment 1
Participants
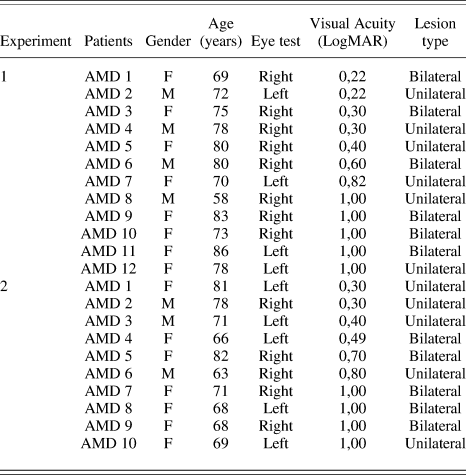
Twelve patients (mean age = 75 ± 6 years), diagnosed with exudative AMD (Table 1) at the Ophthalmology Department of the University Hospital of Grenoble (Grenoble, France) for treatment with intravitreal antivascular endothelial growth factor injections, were recruited for the study. The inclusion criterion was a visual acuity between 1 and 0.22 LogMAR on the most impaired eye (mean visual acuity = 0.66 LogMAR). They were tested monocularly, and the worse eye was selected for bilateral patients. Twelve healthy age-matched volunteers (mean age = 76 ± 7 years) were tested monocularly with their best eye. For control participants, the inclusion criterion was a visual acuity between 0.30 and 0 LogMAR on the selected eye (mean visual acuity = 0.11 LogMAR). Participants with psychiatric, neurological, and ocular (glaucoma and multiple sclerosis) disorders and medications (benzodiazepines and drugs affecting cholinergic system) were not included in the study.
Clinical data of AMD patients of Experiment 1 and Experiment 2

F, female; M, male.
Stimuli
Stimuli were 40 black and white photographs (256 gray scales) of natural scene classified in two distinct categories (20 indoors and 20 outdoors) whose size was 32 × 24 degrees of visual angle. They had similar dominant orientations (as shown by the mean amplitude spectrum of nonfiltered natural scenes in each category) to avoid their identification on the basis of this kind of cue (Guyader et al., Reference Guyader, Chauvin, Peyrin, Herault and Marendaz2004). There were two types of images for each scene: LSF and HSF (Fig. 1). They were elaborated with the image processing toolbox on MATLAB (Mathworks Inc., Sherborn, MA). They were obtained by multiplying the Fourier transform of the original images with Gaussian filters. The standard deviation of Gaussian filters is a function of the spatial frequency cutoff for a standard attenuation of 3 dB. We removed the spatial frequency content above 1 cycle/degree of visual angle (i.e., low-pass cutoff of 32 cycles per image) for LSF stimuli and below 1 cycle/degree (i.e., high-pass cutoff of 32 cycles per image) for HSF stimuli. The average energy level for LSF and HSF stimuli was equalized for each sceneFootnote 1. Moreover, the mean luminance of the stimuli was equivalent for indoor and outdoor scenes, mean luminance = 116 ± 5 and 115 ± 5, respectively, on a 256 gray-level scale; F(1,38) < 1, and there was no interaction between Categories and Spatial frequencies, F(1,38) < 1. Thus, the difference in performance between LSF and HSF images could not result from their intrinsic luminance difference or their luminance difference in each scene category. We used a backward mask, built by the random sum of several natural scenes belonging to the two categories, to prevent retinal persistence of the scene.
(A) Examples of natural scenes in LSF (<1 cycle/degree) and HSF (>1 cycle/degree) and mean amplitude spectra of nonfiltered scenes in Experiment 1 and Experiment 2. Experimental design of Experiment 1 (B) and Experiment 2 (C).

Procedure
Stimuli were displayed using E-prime software (E-prime Psychology Software Tools Inc., Pittsburgh, PA) on a computer monitor (17 inch, with a resolution of 1024 × 768 pixel size, 85 Hz, minimum luminance = 0.4 cd/m2, maximum luminance = 98.8 cd/m2) at a viewing distance of 55 cm. To respect the distance and the central position, the participant’s head was maintained. The experiment consisted of 80 trials. In half of the trials, the scene (filtered in either LSF or HSF) was an indoor, while in the other half of trials, the scene was an outdoor. This resulted in 20 trials for each experimental condition: LSF indoor, LSF outdoor, HSF indoor, and HSF outdoor. Each trial began with a central fixation point for 700 ms with a sound, immediately followed by a filtered scene 150 ms and a mask for 30 ms. The quality of the central fixation was controlled by the experimenter. Participants had to make a categorical choice. They had to decide whether the scene took place indoor or outdoors by pressing on two response buttons (aligned on the midsagittal plane of each participant) with the forefinger and the middle finger of their dominant hand. Half of the participants had to answer “indoor” with the forefinger and “outdoors” with the middle finger, while the second half of the participants had to answer “indoor” with the middle finger and “outdoors” with the forefinger. For each trial, reaction times were recorded to the nearest millisecond following the response as well as response accuracy. If participants did not give any response within the 3 s after the stimuli presentation, the experimenter asked to the participant if he could, however, give a response. For each no-response, none of the participants were able to categorize the scene. Thus, all no-responses were considered as errors. Then, the experimenter presented the next trial. So, an error could be either a no-response or a false categorization. Analyses were conducted on mean no-response error rate (mNR), mean false categorization rate (mFC), and mean correct reaction times (mRT). Three 2 × 2 × 2 analyses of variance (ANOVA) with Participants (AMD patients vs. healthy participants) as between-subjects factors and Categories (Indoors vs. Outdoors) and Spatial frequencies (LSF vs. HSF) as within-subjects factors were conducted on mNR, mFC, and mRT. The ANOVA on mRT was performed after inverse transformation to ensure variance homogeneity. Before the experiment, participants underwent a training session of eight practice trials with stimuli that differed from the ones used in the experiment.
Results
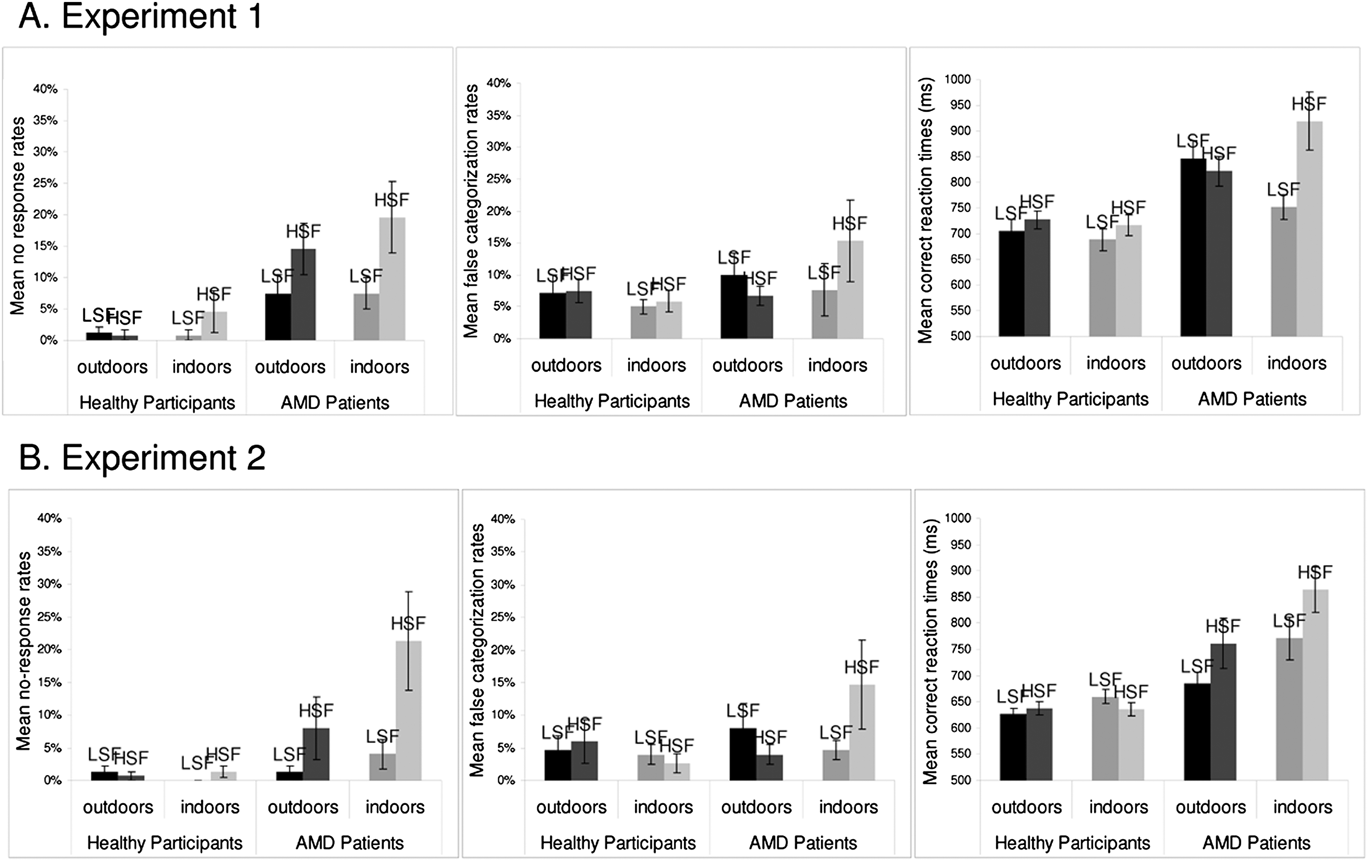
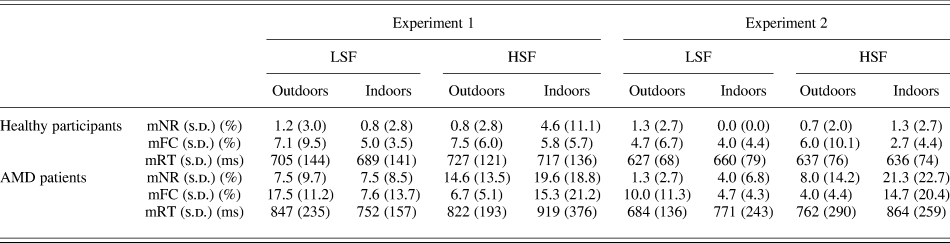
The ANOVA on mNR (Table 2 and Fig. 2a) revealed that AMD patients made more no-response errors than healthy participants, 12.3 ± 14.2% and 1.9 ± 6.3%, respectively; F(1,22) = 9.32, P < 0.01. The expected Participant × Spatial frequency was not significant, F(1,22) = 3.59, P = 0.07. However, planned comparisons showed that AMD patients made significantly more no-response errors for HSF than LSF, 17.1 ± 16.5% and 7.5 ± 9.1%, respectively; F(1,22) = 10.53, P < 0.005; there was no difference for healthy participants, 2.7 ± 8.3% and 1.0 ± 2.9%, respectively; F(1,22) < 1. AMD patients made more no-response errors to categorize HSF and LSF scenes than healthy participants, F(1,22) = 8.01, P < 0.01 and F(1,22) = 6.73, P < 0.05, respectively. Finally, the Category × Participant × Spatial frequency was not significant, F(1,22) < 1, and the planned comparisons did not yield a significant interaction between Participants and Spatial Frequencies, neither for Indoors, F(1,22) = 1.86, P = 0.19, nor for Outdoors, F(1,22) = 3.92, P = 0.06. The ANOVA on mFC did not show main effect of Participants, F(1,22) = 3.72, P = 0.07; interaction between Participants and Spatial frequencies, F(1,22) < 1; or interaction between Participants, Spatial frequencies, and Categories, F(1,22) = 2.66, P = 0.12.
mFC, mNR, and mRT according to spatial frequencies (LSF and HSF) and categories (Outdoors and Indoors) of scenes for AMD patients and healthy participants in (A) Experiment 1 and (B) Experiment 2. Error bars correspond to standard errors.

mNR, mFC, mRT in milliseconds, and s.d. for LSF and HSF outdoor and indoor scenes for healthy participants and patients with AMD in Experiment 1 and 2

The ANOVA on mRT (Table 2 and Fig. 2a) did not reveal a Participants main effect, F(1,22) = 1.65, P = 0.21, even if AMD patients were slower to categorize scenes than healthy participants, 835 ± 202 and 709 ± 137 ms, respectively; F(1,22) = 1.65, P = 0.21. Furthermore, the expected Participant × Spatial frequency was not significant, F(1,22) < 1, but the Category × Participant × Spatial frequency was significant, F(1,22) = 4.48, P < 0.05. The planned comparisons did not yield a significant interaction between Participants and scene Spatial Frequencies, neither for Indoors, F(1,22) = 2.28, P = 0.15, nor for Outdoors, F(1,22) = 2.98, P = 0.10. However, in order to examine the Category × Participant × Spatial frequency interaction, planned comparisons were performed for Indoors and Outdoors separately. For Indoors, planed comparisons showed that AMD patients were significantly slower to categorize HSF than LSF indoors, 919 ± 376 and 752 ± 157 ms, respectively; F(1,22) = 10.88, P < 0.01; there was no difference for healthy participants, 717 ± 136 and 689 ± 141 ms, respectively; F(1,22) = 1.35, P = 0.26. For Outdoors, there was no difference between HSF and LSF outdoors for AMD patients, 822 ± 193 and 847 ± 235 ms, respectively; F(1,22) < 1, and healthy participants, 727 ± 121 and 705 ± 144 ms, respectively; F(1,22) = 3.38, P = 0.08.
We also investigated the relationship between the variability of the data and the variability of visual acuity deficits in AMD patients using Pearson correlation tests between patient’s performance (mNR, mFC, and mRT) and visual acuity. Results show no correlations between LSF and Visual acuity (mNR: r = 0.33, P = 0.30; mFC: r = −0.15, P = 0.64; mRT: r = 0.45, P = 0.15) and HSF and Visual acuity (mNR: r = 0.24, P = 0.44; mFC: r = 0.19, P = 0.56; mRT: r = 0.48, P = 0.32). Considering the mean global error rate (i.e., the mNR and the mFC taking together), there was no correlation between LSF and Visual acuity (mER: r = −0.09, P = 0.78) and HSF and Visual acuity (mER: r = −0.31, P = 0.32).
Descriptive analyses on single participant data (Figs. 3 and 4) showed that 9 out of 12 patients have a higher no-response rate for HSF than LSF. Besides, 7 out of 12 patients have a higher NR rate for HSF–Indoors than LSF–Indoors. Concerning correct reaction times (RTs), 9 out of 12 patients have longer RTs for categorizing HSF than LSF scenes and 11 out of 12 patients have longer RTs for HSF–Indoors than LSF–Indoors.
Individual results (mNR, mFC, and mRT) of Control and AMD patient groups in Experiment 1 as a function of the spatial frequency content (LSF and HSF) of scenes.

Individual results (mNR, mFC, and mRT) of Control and AMD patient groups in Experiment 1 as a function of the spatial frequency content (LSF and HSF) and the category (Indoors and Outdoors) of scenes.

Discussion
The results are consistent with the idea that AMD patients exhibit a deficit in HSF processing and preserve skills in LSF processing. AMD patients categorized scenes as correctly as healthy participants when they had to perform the task on the basis of LSF information. Their performance dropped drastically when they had to do the categorization task on the basis of HSF information. Furthermore, the results suggest that the processing of spatial frequencies differed according to scene category (indoor vs. outdoor). Indeed, on mRT, we observed a deficit in the processing of HSF information especially during the categorization of indoors scenes.
However, the photographs of the outdoor scenes used in Experiment 1 included many elements (e.g., streets, mountains, trees, cars) and were displayed very quickly. This could alter the recognition of the scenes regardless of their spatial frequencies, even for healthy participants. Using Ruth Rosenholtz’s matlab code (http://hdl.handle.net/1721.1/37593), we computed for each image of our database a measurement of visual clutter. Because the software only runs with color images, we modified it to obtain the same measures for gray-level images. The software proposes two different visual clutter measures: the Feature Congestion and the Subband Entropy (see Rosenholtz et al., Reference Rosenholtz, Li and Nakano2007). Both measures give very similar results for different images and different visual search task except that the Feature Congestion seems to be more appropriate to color images. Hence, we computed the Subband Entropy measures of visual clutter for each scene. Then, we compare the mean Subband Entropy measure of visual clutter for the different categories of images (Indoors vs. Outdoors). The mean subband entropy was higher for outdoor than indoor scenes, mean subband entropy = 3.27 ± 0.28 and 3.04 ± 0.19, respectively; F(1,38) = 9.41, P < 0.01. Thus, outdoor scenes are more cluttered than indoor scene. Differences in cluttering might have biased the investigation of spatial frequency processing in AMD patients.
Therefore, in Experiment 2, we presented simple outdoor scenes. They were more uncluttered images with groups of buildings or houses. Furthermore, in order to increase accuracy, we extended the presentation time of the photographs, as previous studies on complex visual stimuli have done (Boucart et al., Reference Boucart, Despretz, Hladiuk and Desmettre2008a,Reference Boucart, Dinon, Despretz, Desmettre, Hladiuk and Olivab) and removed the mask.
Experiment 2
Participants
Ten AMD (Table 1; mean age = 72 ± 6 years) ranged in visual acuity from 1 to 0.30 LogMAR (mean visual acuity = 0.70 LogMAR) were recruited. The control group consisted of 10 healthy age-matched volunteers (mean age = 72 ± 6 years) ranged in visual acuity from 0.30 to 0 LogMAR (mean visual acuity = 0.12 LogMAR). The other criteria were the same as in Experiment 1.
Stimuli and procedure
Stimuli were 60 black and white filtered scenes as in Experiment 1. The averaged stimuli luminance was equivalent between indoors and outdoors stimuli, mean luminance = 122 ± 7 and 121 ± 7 respectively, on a 256 gray-level scale; F(1,58) < 1, and there was no interaction between Categories and Spatial frequencies, F(1,58) < 1. Furthermore, outdoor and indoor scenes are thus equivalent in terms of cluttering. The mean subband entropy was equivalent for indoor and outdoor scenes, mean subband entropy = 3.13 ± 0.26 and 2.04 ± 0.23, respectively; F(1,58) = 2.15, P = 0.15. Each experimental trial began with a central fixation point for 700 ms, immediately followed by a filtered scene (300 ms). The other criteria remained unchanged.
A control study was conducted on 10 undergraduate students in order to verify that the central information did not constitute a bias favoring HSF categorization. In this study, we presented the same images filtered in LSF and HSF with a central mask of 13 deg of visual angle (that approximately corresponds to a lesion sized 4 mm in AMD patients in Experiment 2; Cheung & Legge, Reference Cheung and Legge2005). Results showed that performance did not differ between LSF and HSF scenes, mER: 1 vs. 1%, respectively, F(1,9) < 1; mRT: 686 vs. 678 ms, respectively, F(1,9) = 1.11, P = 0.32, suggesting that the presentation of HSF information in the periphery only does not disturb the categorization relative to LSF information. Furthermore, there was no interaction between Spatial frequencies and Categories, mER: F(1,9) < 1; mRT: F(1,9) < 1.
Results
The ANOVA on mNR (Table 2 and Fig. 2b) revealed that AMD patients made more no-response errors than healthy participants, 8.7 ± 15.9% and 0.8 ± 2.2%, respectively; F(1,18) = 5.65, P < 0.05. The expected Participant × Spatial frequency was significant, F(1,18) = 4.53, P < 0.05. Planned comparisons showed that AMD patients made significantly more no-response errors for HSF than LSF, 14.7 ± 20.1% and 2.7 ± 5.3%, respectively; F(1,18) = 9.59, P < 0.01; there was no difference for healthy participants, 1.0 ± 2.4% and 0.7 ± 2.0%, respectively; F(1,18) < 1. AMD patients made more no-response errors for HSF scenes than healthy participants, F(1,18) = 5.36, P < 0.05; there was no difference for LSF scenes, F(1,18) = 2.13, P = 0.16. There was no significant Category × Participant × Spatial frequency interaction, F(1,18) = 3.58, P = 0.07, but planned comparisons showed a significant Participant × Spatial frequency interaction for Indoors, F(1,18) = 4.71, P < 0.05, and not for Outdoors, F(1,18) = 3.31, P = 0.09. AMD patients made more no-response errors to categorize HSF–Indoors than LSF–Indoors, F(1,18) = 11.06, P < 0.01; there was no difference for healthy participants, F(1,18) < 1. In addition, AMD patients made significantly more errors to categorize HSF–Indoors than healthy participants, F(1,18) = 6.91, P < 0.05. There were no differences between the groups in the categorization of LSF–Indoors, F(1,18) = 3.11, P = 0.09. The ANOVA on mFC did not show main effect of Participants, F(1,18) = 1.86, P = 0.19; interaction between Participants and Spatial frequencies, F(1,18) < 1; or interaction between Participants, Spatial frequencies, and Categories, F(1,18) = 3.20, P = 0.09.
The ANOVA on mRT (Table 2 and Fig. 2b) did not show a Participant main effect, AMD: 770 ± 247 ms and Controls: 640 ± 75 ms; F(1,18) = 2.51, P = 0.13. The analysis revealed a main effect of Categories indicating that participants categorized Outdoor scenes faster than Indoor scenes, 677 ± 176 and 733 ± 216 ms, respectively; F(1,18) = 10.33, P < 0.01. As for mNR, we observed the expected significant interaction between Participants and Spatial frequencies, F(1,18) = 6.36, P < 0.05. Planed comparisons showed that AMD patients were significantly slower to categorize HSF than LSF, 813 ± 279 and 728 ± 202 ms, respectively; F(1,18) = 9.52, P < 0.01; there was no difference for healthy participants, 636 ± 75 and 643 ± 75 ms, respectively; F(1,18) < 1. Furthermore, AMD patients were slower to categorize HSF scenes than healthy participants even if the difference did not reach significance, F(1,18) = 4.30, P = 0.05; they categorized LSF scenes as quickly as healthy participants, F(1,18) < 1. Finally, the Category × Participant × Spatial frequency interaction was not significant, F(1,18) = 4.05, P = 0.06.
Pearson correlation tests between patient’s performance (mNR, mFC, mRT) and visual acuity show no correlation between LSF and Visual acuity (mNR: r = −0.23, P = 0.53; mFC: r = 0.36, P = 0.31; mRT: r = 0.26, P = 0.46) and between HSF and Visual acuity (mNR: r = 0.41, P = 0.23; mFC: r = 0.47, P = 0.17; mRT: r = 0.42, P = 0.23). However, considering the mean global error rate (i.e., the mNR and the mFC taking together), there was no correlation between LSF and Visual acuity (mER: r = −0.29, P = 0.42) but a significant correlation between HSF and Visual acuity on the Error rate only (mER: r = −0.71, P = 0.02).
Descriptive analyses on single participant data (Figs. 5 and 6) showed that 7 out of 10 patients have a higher NR rate for categorizing HSF than LSF scenes. Besides, 7 out of 10 patients have a higher NR rate for HSF–Indoors than LSF–Indoors. Concerning RTs, 7 out of 10 patients have longer RTs for categorizing HSF than LSF scenes and 7 out of 10 patients have longer RTs for HSF–Indoors than LSF–Indoors.
Individual results (mNR, mFC, and mRT) of Control and AMD patient groups in Experiment 2 as a function of the spatial frequency content (LSF and HSF) of scenes.

Individual results (mNR, mFC, and mRT) of Control and AMD patient groups in Experiment 2 as a function of the spatial frequency content (LSF and HSF) and the category (Indoors and Outdoors) of scenes.

Discussion
Experiment 2 revealed a global deficit in HSF processing for AMD patients and preserved skills in the processing of LSF. The main effect of Categories on reaction times indicates that the outdoor scenes were simpler than in Experiment 1, and that they are processed faster than the indoor scenes. On mRT and mNR, the scene category did not interact with the processing of spatial frequencies by participants. These results globally suggest that the experimental manipulations applied in Experiment 2 (simplification of outdoor images, longer presentation time, and suppression of the mask) provided more suitable conditions to assess a HFS deficit in AMD patients.
Furthermore, the mean global error rate (i.e., the mNR and the mFC taking together) for HSF scene categorization is found to be correlated to visual acuity. This correlation is not surprising since there is a close link between visual acuity and the ability to process HSF information. Indeed, visual acuity is the spatial resolving capacity of the visual system. This may be thought as the ability of the eye to see fine detail. HSF represent abrupt spatial changes in the image, such as edges, and generally corresponds to fine details. Gratings of different spatial frequencies can be used as a method of measuring visual acuity, that is the maximum resolution of the eye (see Campbell & Green, Reference Campbell and Green1965), and visual acuity can also be expressed in spatial frequencies. The higher spatial frequencies can be detected, the greater the eye resolution is, and consequently, the better the visual acuity is.
General discussion
In Experiment 1, AMD patients made more no-responses to categorize HSF than LSF scenes, irrespective of the scene category. In addition, AMD patients had longer reaction times to categorize HSF than LSF scenes only for indoors. Healthy participants’ performance was not differentially affected by spatial frequency content of the scenes. In Experiment 2, AMD patients demonstrated the same pattern of errors than in Experiment 1. Furthermore, AMD patients had longer reaction times to categorize HSF than LSF scenes, irrespective of the scene category. Again, spatial frequency processing was equivalent for healthy participants. Globally, AMD patients made more errors (mainly no responses) and were slower to categorize the images on an HSF basis than healthy patients. Furthermore, individual data showed that the deficit during the processing of HFS in AMD would be stronger for patients with low visual acuities. The patients with more preserved visual acuity present patterns of results similar to those of healthy participants.
The patients’ performance was relatively preserved when they were constrained to process the same visual scenes but on an LSF basis. According to the literature, the information conveyed by the LSF would be sufficient to categorize complex natural scenes (Torralba & Oliva, Reference Torralba and Oliva2003; Guyader et al., Reference Guyader, Chauvin, Peyrin, Herault and Marendaz2004). Thus, when this information is available in the visual stimuli, the AMD patients would use their preserved abilities in LSF processing.
Although the methods are different, the deficit observed in HSF processing in AMD patients is in keeping with previous studies on contrast sensitivity in AMD. Midena et al. (Reference Midena, Degli Angeli, Blarzino, Valenti and Segato1997) investigated contrast sensitivity using sinusoidal gratings of different spatial frequencies in patients with early AMD without neovascular exudation. Their results showed a decrease in contrast sensitivity, particularly in HSF (20 cycles/degree), when compared to healthy age-matched participants. Furthermore, Kleiner et al. (Reference Kleiner, Enger, Alexander and Fine1988) showed that the loss of contrast sensitivity at HSF increased with drusen severity. Our results are also consistent with those of Boucart et al. (Reference Boucart, Dinon, Despretz, Desmettre, Hladiuk and Oliva2008b) on face perception. These authors focused on the processing of spatial frequency information contained in expressive faces by using two tasks known to selectively induce the analysis of either LSF or HSF information in healthy people (Schyns & Oliva, Reference Schyns and Oliva1999). In the HSF-based detection task, AMD patients and healthy participants had to detect whether the face had an expression or not, and in the LSF-based categorization task, they had to name the facial expression. Since low vision is associated to reduced sensitivity to contrast and HSF (Kleiner et al., Reference Kleiner, Enger, Alexander and Fine1988; Midena et al., Reference Midena, Degli Angeli, Blarzino, Valenti and Segato1997; Faubert & Overbury, Reference Faubert and Overbury2000), the authors expected that AMD patients should perform the tasks on the basis of LSF information. The results showed that the patients performed better in the categorization than the detection task (in comparison to normally sighted observers). The inability to determine whether the same face was expressive or not suggests a specific impairment in HSF processing. In contrast, they were very fast to categorize facial emotion, and it is likely that they based their decision on LSF information. However, the patients’ abilities to process spatial frequencies were inferred rather than empirically demonstrated. This is the reason why in the present study, we manipulated the spatial frequency spectrum of stimuli explicitly. This is the first empirical evidence of an HSF deficit in AMD patients during the perception of complex visual stimuli as scenes. Furthermore, our results might account for the effect of context observed by Boucart et al. (Reference Boucart, Despretz, Hladiuk and Desmettre2008a) in AMD patients when analyzing complex photographs of natural scenes. The authors showed that AMD patients categorized more accurately isolated objects than objects in scenes; no difference was observed for normally sighted observers. We hypothesized that the detection of a target (e.g., a face or animal) in a context, as in task of Boucart et al. (Reference Boucart, Despretz, Hladiuk and Desmettre2008a), requires a fine analysis of visual information that would be HSF based, and that this process would affect AMD patients’ performance.
Our results are also consistent with a very recent study conducted by Tran et al. (Reference Tran, Rambaud, Despretz and Boucart2010) on AMD patients. The authors showed that patients were able to categorize large nonfiltered scenes, sized 15 × 15 degrees of visual angle and belonging to indoor and outdoor categories with a high correct detection rate (even if the performance was lower than that of age-matched controls). They explained these results by the fact that their task could be accomplished at a coarse spatial resolution based on LSF in peripheral vision. Our study directly demonstrated that LSF information allows an efficient scene categorization in AMD patients.
The present findings point to a deficit in the processing of HSF information contained in photographs of natural scenes in AMD patients. The processing of LSF information seems relatively preserved. AMD is a retinal disease that leads to the loss of photoreceptors in the central area of the macula (fovea). The density of cones and midget ganglion cells, which are used for high acuity vision and to process HSF information, is greatest in the center of the retina. Since the P pathway originates from midget ganglion cells and mainly conveys HSF information from central retina, our results could suggest that AMD patients exhibit a deficit of the P pathway and preserved abilities of the M pathway. However, future studies manipulating spatial frequencies as well as contrast, chromatic, and temporal characteristics are needed to fully investigate the relative deficits in the P and M pathways in AMD patients. Clarifying how much spatial frequencies contribute to the exploration of their functioning is also a matter of further research.
An alternative explanation could be linked to the nonhomogeneous distribution of retinal photoreceptors (Osterberg, Reference Osterberg1935; Curcio et al., Reference Curcio, Kenneth and Robert1990). The density of cones decreases rapidly with retinal eccentricity. Also, the receptive fields of the photoreceptors are larger in the perifoveal region. During the progression of the disease with central scotoma, the sampling density of photoreceptor mosaic decreases. At the late stage of the disease, the patient has to use their paracentral retina, with lower photoreceptor/ganglion cell sampling density, to process visual information. This might result in the loss or misrepresentation of HSF information.
The two experiments globally suggest that the complexity of visual scenes could modulate our results. In fact, the categories differ on the spatial organization of the visual elements in the scene. The complex outdoor scenes in Experiment 1 (that had many details as trees, cars, streets, mountains) were replaced by simpler outdoor scenes in Experiment 2 (e.g., buildings and houses). The organization of the elements in the scene remained similar, especially the invariants like the floor below the scene and the direction of natural light from above to below the stage. These elements are not present in the indoor scenes. In the outdoor scenes, the AMD patients could detect these invariants on the basis of LSF and HSF information. However, as the indoors information is not prototypical, AMD patients could not develop alternative strategies to compensate their deficit in HSF processing, which would lead to a performance decrease. To conclude on differences between categories, this study provides new perspectives on spatial frequency processing in AMD. Indeed, the results for complex scenes were slightly different from those that used gratings (Kleiner et al., Reference Kleiner, Enger, Alexander and Fine1988; Midena et al., Reference Midena, Degli Angeli, Blarzino, Valenti and Segato1997; Faubert & Overbury, Reference Faubert and Overbury2000). In the present experiments, AMD patients did not exhibit deficits during the categorization of HSF outdoors, despite the complexity of this category and their retinal lesions and visual loss. Instead, the deficit in HSF processing in AMD was amplified when they had to categorize indoors. This suggests that additional visual information, such as spatial organization, might interfere with the spatial frequency processing and thus emphasize the importance of considering more complex and ecological stimuli when investigating residual visual abilities in AMD patients. These results could also provide interesting perspectives to investigate the locomotion of patients in indoor and outdoor environments.
Studies on the rehabilitation of AMD patients suggest that rehabilitation procedures consist of scotoma awareness and visual training techniques such as fixation stability (Wright & Watson, Reference Wright and Watson1995; Seiple et al., Reference Seiple, Szlyk, McMahon, Pulido and Fishman2005). Many studies indicate that the decline in reading performance, which involves fine perception, leads to an impoverishment in quality of life (West et al., Reference West, Munoz and Rubin1997; Williams et al., Reference Williams, Brody, Thomas, Kaplan and Brown1998). The present results are consistent with a deficit of fine perception but also point to the importance of semantic information. Regarding rehabilitation strategies, these data suggest that maybe more efforts should be done to develop tasks that train detailed perceptual processes.
Retinal lesions caused by AMD induce a lack of stimulation in the visual cortex that is devoted to the processing of the central visual field. The presence of deafferented cortical tissue may suggest a reorganization of the human cortex. Several studies in cats, rats, and monkeys have demonstrated recovery of responses in part of the deprived visual cortex after retinal lesions (Kaas et al., Reference Kaas, Krubitzer, Chino, Langston, Polley and Blair1990; Heinen & Skavenski, Reference Heinen and Skavenski1991; Gilbert & Wiesel, Reference Gilbert and Wiesel1992; Chino et al., Reference Chino, Smith, Kaas, Sasaki and Cheng1995; Calford et al., Reference Calford, Wright, Metha and Taglianetti2003; Keck et al., Reference Keck, Mrsic-flogel, Afonso, Eysel, Bonhoeffer and Hübener2008). In contrast, a few studies in macaques failed to demonstrate any functional recovery following retinal lesions (Murakami et al., Reference Murakami, Komatsu and Kinoshita1997; Horton & Hocking, Reference Horton and Hocking1998; Smirnakis et al., Reference Smirnakis, Brewer, Schmid, Tolias, Schüz, Augath, Inhoffen, Wandell and Logothetis2005). In human adults, recent neuroimaging studies point to cerebral reorganization (Baker et al., Reference Baker, Peli, Knouf and Kanwisher2005, Reference Baker, Dilks, Peli and Kanwisher2008) and changes in cortical gray matter density consecutive to AMD (Boucard et al., Reference Boucard, Hernowo, Maguire, Jansonius, Roerdink, Hooymans and Cornelissen2009); other studies fail to show any changes (Sunness et al., Reference Sunness, Liu and Yantis2004). Further research is needed to examine the possibility of a functional cerebral reorganization in AMD patients for processing spatial frequencies, particularly in regions classically involved in HSF processing (Peyrin et al., Reference Peyrin, Baciu, Segebarth and Marendaz2004).
Acknowledgment
This work was supported by Région Rhone-Alpes.
 and
 represent the value of the pixel at position
 of respectively the low- and the high-pass filtered images of a scene, their energies are given by
 and
 . The stimuli are then normalized by a fixed energy
 ,
 and
 .