Introduction
Maternal undernutrition (MUN) results in fetal intrauterine growth restriction (IUGR). IUGR occurs when nutrient delivery and/or gas exchange to the fetus are not sufficient to allow it to thrive in utero. As first proposed by Barker,Reference Barker1 IUGR can impact a critical point in gestational development that ‘reprograms’ the offspring for adaptation to a nutrient-deprived environment. However, these programmed changes are maladaptive in a postnatal, high-caloric environment as found in westernized diets, and can lead to adult disease. Human epidemiological studies have shown a clear correlation between IUGR and increased risk of disorders later in life such as obesity, type II diabetes, hypertension and cardiovascular disease.Reference Ross and Beall2 In addition, the IUGR human fetal kidney has less volume and a significant reduction in the number of glomeruli compared with normal kidneys.Reference Silver, Decamps, Korst, Platt and Castro3, Reference Latini, De and Del4
Animal models have been established that recapitulate IUGR and allow the study of mechanisms of programming. Metanephric nephrogenesis in the rat begins at approximately day 12 of gestation and continues postnatally to approximately day 8.Reference Moritz and Wintour5 In the rat, a model of 50% caloric restriction from embryonic day (E) 10 to birth (P1) leads to a reduction in nephron number and adult offspring hypertension (MUN phenotype).Reference Henry, Mansano and Nast6 Similar animal models based on protein restriction, uterine arterial ligation and nutrient restriction during gestation result in growth-restricted offspring with deficits ranging from 13% to 41%.Reference Ojeda, Grigore and Alexander7 Nutrient restriction occurring after birth in the rat also results in reduced nephron number,Reference Schreuder, Nyengaard, Remmers, van Wijk and Delemarre-van de Waal8 and studies have shown that both stages affect hypertension.Reference Pham, MacLennan and Chiu9 The underlying mechanisms for these effects are unknown but may result from disrupted signaling due to nutrient deprivation.
Our previous studies have identified decreased expression of nephrogenic growth-signaling factors including glial cell-derived neurotrophic factor (GDNF), wingless/integrated gene (WNT) and mitogen activated protein kinase/extracellular receptor kinase (MAPK-ERK) signaling pathways, suggesting that loss of growth signaling may inhibit the formation or maturation of glomeruli.Reference Henry, Mansano and Nast6, Reference Abdel-Hakeem, Henry and Magee10 These pathways are critical for reciprocal signaling between metanephric mesenchyme and ureteric bud tips.Reference Hida, Omori and Awazu11 Growth signaling from the ureteric bud tip can inhibit undifferentiated metanephric mesenchymal apoptosis, thereby allowing aggregation and differentiation into epithelial cells and nephrons. In turn, metanephric mesenchyme rescues ureteric buds from degeneration;Reference Hida, Omori and Awazu11 therefore, loss of reciprocal signaling may induce an aberrant apoptotic cascade. The reported peak rate of apoptosis in a normal developing rat kidney is 2.7% in the nephrogenic zone of embryonic kidneys.Reference Coles, Burne and Raff12 Further, at E15, apoptosis was observed in the uninduced mesenchymal cells of the cortical nephrogenic zone as well as the medullary interstitiumReference Hida, Omori and Awazu11 but decreased significantly to a low postnatal level.Reference Okada, Iwamoto and Mukamoto13 These reports suggest that apoptosis plays an important function in nephrogenesis.
Apoptosis can be divided into two main pathways, extrinsic and intrinsic. Extrinsic is induced by inflammatory stress signals originating from macrophages and cytokine-producing cells that signal a cell to self-destruct.Reference Sanz, Santamaria, Ruiz-Ortega, Egido and Ortiz14 Some of the genes involved include Fas ligand and Fas receptor. The intrinsic pathway involves signals that originate within the cell due to DNA damage or other internal cell signals.Reference Sanz, Santamaria, Ruiz-Ortega, Egido and Ortiz14 Critical genes are p53, Bax and Bcl2, while caspases 9 and 3, as part of the caspase cascade, facilitate the expression of apoptotic cellular machinery. In a previous study, we demonstrated significant (>1.5-fold change) dysregulation of four components of the apoptotic pathway in E20 MUN kidneys assessed by microarray.Reference Magee, Tafti and Desai15
In addition, another model of IUGR, maternal protein restriction during pregnancy, demonstrated increased apoptosis of metanephric progenitor cells, reducing the final proportion of glomeruli by up to one out of three.Reference Welham, Wade and Woolf16 Given the importance of apoptosis in the organization and development of fetal organs, and data suggesting that it plays a significant role in nephron number, we evaluated apoptosis and apoptotic gene expression during late fetal and early postnatal nephrogenesis as a potential mechanism for MUN-induced nephropenia. Our findings demonstrate significant upregulation of pro-apoptotic and downregulation of anti-apoptotic factors after birth predominantly in the nephrogenic zone, implicating apoptosis as a key mechanism in this model.
Methods
Maternal rat diets
Studies were approved by the Animal Care and Use Committee of the Los Angeles Biomedical Research Institute at Harbor, UCLA Medical Center, and were in accordance with the American Association for Accreditation of Laboratory Care and National Institutes of Health guidelines. A model of rat dams that were 50% food-restricted (MUN) during pregnancy was used. First-time pregnant Sprague Dawley rats (Charles River Laboratories, Hollister, CA, USA) were housed in a facility with constant temperature and humidity and a controlled 12:12-hour light/dark cycle. At 10 days of gestation, rats were provided either an ad libitum diet of standard laboratory chow (Lab Diet 5001, Brentwood, MO, USA; protein, 23%; fat, 4.5%; metabolizable energy, 3030 kcal/kg) or a 50% MUN diet that was determined by quantification of normal intake in the ad libitum fed rats. The respective diets were given from 10 days of pregnancy until gestational day 20 (E20) or P1.
Animal tissue collection
Rat dam litter sizes used in this study ranged from 10 to 14. Fetuses or P1 pups from dams with <10 or >14 were not used in order to avoid any possible effects of over or undernutrition related to litter size. At E20, dams (five control and five MUN) were anesthetized with isoflurane, and fetuses were quickly removed and placed on ice-cold dishes. Male fetuses were dissected, intact kidneys removed and kidneys for mRNA and protein quantitation flash frozen in liquid nitrogen. Owing to the limiting size of the E20 kidneys, all kidneys for RNA and Western blotting were pooled from three to four male fetuses derived from each dam for a total of five control and five MUN pools. Only male kidneys were studied. This was based on previous reports of more profound effects of programming on male v. female kidney function and hypertension.Reference Gilbert and Nijland17–Reference Woods, Ingelfinger and Rasch20 In addition, kidneys for TUNEL and immunohistochemistry assays were removed and placed into 4% paraformaldehyde (n = 4 per group).
P1 pups were euthanized by decapitation, kidneys removed and flash frozen in liquid nitrogen or placed in 4% paraformaldehyde. MUN and control male fetal kidneys, each from a separate dam, were randomly selected and processed for either protein (n = 5 per group), immunohistochemistry (n = 4 per group) or TUNEL assay (n = 4 per group).
Real-time reverse transcriptase PCR
RNA extraction
Total RNA was extracted from 75 mg of pooled kidneys with the use of the RNAqueous-4 PCR column kit (Ambion, Austin, TX, USA). Residual DNA was digested with DNase I enzyme and inactived with DNase removal reagent (Turbo DNase kit, Ambion). Purified total RNA was quantitated by spectrophotometry (Nanodrop instrument, Thermo Scientific, Waltham, MA, USA).
Primers
Primer sets were designed and supplied by Invitrogen (Carlsbad, CA, USA) using Primer select web-based software. The primer sets were: Fas ligand (gene accession no. NM_012908: Forward, GGTGGCTCTGGTTGGAATGG; Reverse, GCTGTGGTTGGTGAACTCA); Fas receptor (NM_139194: Forward, TAAATACATCTGGAGAACTGC; Reverse, GATCTTGCTTTCCGGGATCTTG); caspase 3 (NM_012922: Forward, GAGGTACAGAGCTGGACTG; Reverse, GTCGGCCTCCACTGGTATCTTC); Caspase 9 (NM_031632: Forward, GAGCGGTTCCTGGTACAT; Reverse, TTGGCGACCCTGAGAAGGAG); Bcl-2 (NM_016993: Forward, GGGAGAACAGGGTATGATAAC; Reverse, TCTCCAGTATCCCACTCGTAGCC); Bax (NM_017059: Forward, TGTTTGCTGATGGCAACTTC; Reverse, GATCAGCTCGGGCACTTTAG); p53 (NM_030989: Forward, GGCCCATCCTTACCATCAT; Reverse, CGAACCTCAAAGCTGTCC) and 18S (M11188: Forward, ATTCCGATAACGAACGAGACT; Reverse, AGCTTATGACCCGCACTTACT).
Real-time quantitative PCR
Complementary DNA (cDNA) was generated from 5 μg of total RNA using Superscript III reverse transcriptase kit (Invitrogen). In brief, RNA was incubated in 20 μl of a reverse transcription reaction mixture [1 × reverse transcription buffer, 6.25 mm MgCl2, 10 mm DTT, 0.5 mm deoxyribonucleoside triphosphates, 50 ng random hexamers, 40 U RNaseOUT (RNase inhibitor) and 10 U Superscript III reverse transcriptase] at 50°C for 50 min. PCR was performed in 96-well optical reaction plates (Applied Biosystems, Foster City, CA, USA) on cDNA equivalent to 500 ng RNA (50 ng for 18S reactions) in a volume of 25 μl that contained 1X Sybr green reaction buffer (Eurogentec North American Inc., San Diego, CA, USA), and forward and reverse appropriate primers (300 nm). PCR was performed for respective mRNAs and the 18S ribosomal RNA (normalization), with the ABI-Prism 7000 Sequence System (Applied Biosystems) at the following conditions: 10 min at 95°C for one cycle, 15 s at 95°C and 1 min at 60°C for 40 cycles. All samples were run in triplicate. Control PCR samples replaced cDNA with water and gave a threshold level (Ct) value of 40, which indicated no detectable PCR product. 18S ribosomal RNA was found to be unchanged in expression between treatment groups in preliminary studies. ABI Sequence Detection System 1.6 software (Applied Biosystems) was used to select a threshold level of fluorescence that was in the linear phase of the PCR product accumulation. Results from the reverse transcription-PCR assay was determined as the difference between the Ct for a specific mRNA gene and the Ct for the 18S reference RNA, normalized to 18S threshold expression and was expressed as fold change with the formula 2−ΔΔCt.Reference Livak and Schmittgen21
Western blot
Antibodies
The primary and secondary antibodies were diluted accordingly. Fas ligand (SC-834; Santa Cruz Biotechnology, Santa Cruz, CA, USA): primary 1:400, secondary 1:10,000; Fas receptor (SC-74540; Santa Cruz Biotechnology): primary 1:500, secondary 1:10,000; Bax (SC-7840; Santa Cruz Biotechnology): primary 1:300, secondary 1:25,000; pro-caspase 3 (SC-56055; Santa Cruz Biotechnology): primary 1:500, secondary 1:10,000; pro-caspase 9 (SC-7885; Santa Cruz Biotechnology): primary 1:500, secondary 1:10,000; p53 (SC-73566; Santa Cruz Biotechnology): primary 1:500, secondary 1:10,000; Bcl-2 (SC-6899; Santa Cruz Biotechnology): primary 1:300, secondary 1:10,000; β-actin (A5441; Sigma Chemical Co., St. Louis, MO, USA): primary 1:10,000, secondary 1:10,000. Secondary horseradish Peroxidase-conjugated antibodies were anti-goat (SC-2020; Santa Cruz biotechnology), anti-rabbit (170-6515; Bio-Rad, Hercules, CA, USA) and anti-mouse (170-6515; Bio-Rad).
Protein extraction
Protein was extracted in radioimmuno precipitation assay buffer that contained protease inhibitors (HALT cocktail, Thermo Scientific) by homogenization of frozen kidneys on ice. Supernatants were clarified by 20-min microcentrifugation at 12,000 g. Supernatant protein concentration was determined by bicinchoninic acid solution (Thermo Scientific). Supernatants were frozen at −80°C until use.
Western blot
Protein expression was analyzed as previously done by our group.Reference Choi, Tosh and Garg22 Equal amounts of protein (25 μg) were mixed with criterion sodium dodecyl sulfate sample buffer (Bio-Rad), boiled for 5 min, and separated on a criterion 12% Bis-Tris denaturing gel (Bio-Rad). The separated proteins were transferred electrophoretically to a nitrocellulose membrane (Bio-Rad) for 1.5 hours at 120 V( 4°C). Nonspecific antibody binding was blocked by incubation for 1 hour with 5% nonfat dry milk in Tris-buffered saline (TBS) solution containing 0.1% Triton X-100 [TBS Tween-20 (TBST); Bio-Rad]. The membrane was incubated and gently shaken with the appropriate primary antibody in 5% milk in TBST buffer overnight at 4°C, and the next day washed twice for 10 min each with TBST buffer at room temperature. Blots were incubated for 1 hour with anti-goat, anti-rabbit or anti-mouse secondary antibodies depending on the primary antibody, followed by washing as before and a final TBS-only wash. Super Signal West Pico Chemiluminescent Substrate (Thermo Scientific) was used to detect the targeted protein. The band density on the X-ray film was optically scanned using a Bio-Rad Scanner and quantitated using Bio-Rad Opti-One software. Blots were stripped with Restore stripping buffer (Thermo Scientific), re-probed with antibody against β-actin, normalized to the reference protein β-actin and graphically presented as fold change relative to the control level (control fold = 1.0).
Apoptotic TUNEL assay
Apoptotic nuclei were detected using a TUNEL apoptosis detection kit according to the manufacturer's instructions (Millipore, Billerica, MA, USA). Four kidneys were examined for both control and MUN groups, with each kidney derived from an offspring of a separate maternal dam. Offspring kidneys were randomly chosen for analysis. Tissue sections were deparaffinized, washed and pretreated with diluted protein digestion enzyme. Quenching endogenous peroxidase was performed, followed by application of equilibration buffer. After incubation, working strength terminal deoxy-transferase enzyme was applied followed by anti-digoxigenin conjugate. After washing, peroxidase substrate was added until brown chomagen precipitate was detected. Sections were rinsed in dH2O (distilled water), and then slides were counterstained in 0.5% methyl green and cover-slipped with organic mounting medium. All slides were scanned and digitized with a ScanScope CS System (Aperio, Vista, CA, USA). Negative control sections were incubated with non-immune serum instead of primary antibody and no immunoreactivity was observed (data not shown). Quantitative evaluation of the stained sections was performed by computerized densitometry using Image Pro, version 6.0 software (Media Cybernetics, Silver Spring, MD, USA). The nephrogenic zone of the cortexReference Georgas, Rumballe and Wilkinson23 was visualized and identified by methyl green counter-staining. The area encompassing the nephrogenic zone was delineated using the Image Pro software and the integrated optical density per area was determined as in our previous study.Reference Henry, Mansano and Nast6 All slides were quantified in a blinded fashion to avoid counting bias.
Immunohistochemistry (IHC)
The 4-μm serial sections in sequence with sections for TUNEL were cut. Staining was performed using the Ventata Benchmark Ultra automated IHC/ISH (in situ hybridization) instrument, using the Ventana ultraview DAB detection kit (Ventana, Tuscon, AZ, USA). Antibodies used included WT-1 (Dako, Carpinteria, CA, USA) at a dilution of 1:50 and predilute PAX2 (Cell Marque, Rocklin, CA, USA). Pretreatment was performed on board the instrument using high pH buffer. After staining on the instrument, slides were counterstained with Mayer's hematoxylin for 5 min and with ammonium hydroxide, and then cover slipped.
Statistical analyses
Differences between control and MUN groups were compared by unpaired t-test. P-values < 0.05 were considered significant. For mRNA and protein expression analysis, means were transformed into fold changes and s.e.m. was expressed as a percentage proportional to the original mean and s.e.m.
Results
MUN offspring weights
We have previously shown that 50% MUN from embryonic day 10 (E10) to P1 reduces both maternal and newborn offspring's weight.Reference Desai, Gayle, Babu and Ross24, Reference Jelks, Belkacemi and Han25 In this study, at E20 MUN fetuses showed a reduction in weight (C 2.76 + 0.26 g v. MUN 2.38 + 0.20 g; P < 0.001) as well as P1 pups (C 7.13 + 0.82 g v. MUN 6.76 + 0.71 g; P = 0.02).
E20 MUN kidney mRNA gene expression
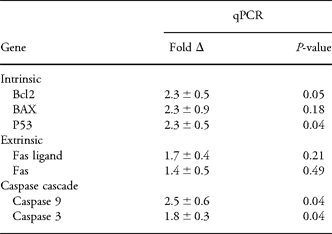
At E20, mRNA expression of intrinsic pro-apoptotic factors was increased in MUN compared with C rat kidneys, with significant upregulation of p53 (P = 0.04) no significant increase was detected in Bax mRNA expression (P = 0.18; Table 1). Interestingly, mRNA of the anti-apoptotic gene Bcl-2 also was increased significantly (P = 0.05). There was no significant difference in mRNA expression of the extrinsic factors Fas ligand and Fas in E20 MUN kidneys. However, there was significant augmentation in MUN kidney mRNA expression of caspase cascade factors: caspases 9 and 3 (both P = 0.04).
Apoptotic factor gene expression in E20 MUN offspring kidneys
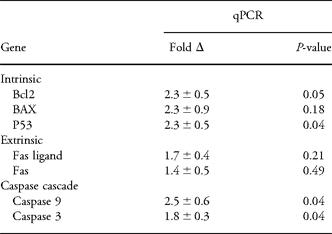
E, embryonic day; P1, MUN, maternal undernutrition; qPCR, quantitative PCR.
E20 MUN kidney protein data show trend to increased apoptosis
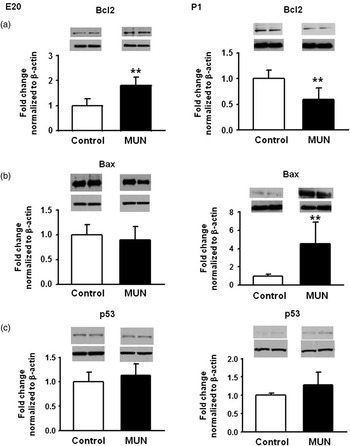
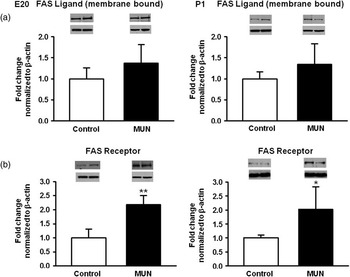
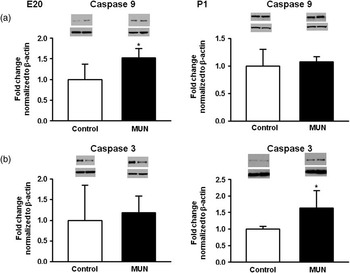
Intrinsic pro-apoptotic factors Bax and p53 did not have significantly different protein levels in MUN kidneys compared with C at E20 (P = 0.52 and P = 0.40, respectively; Fig. 1). In contrast, the anti-apoptotic factor Bcl2 protein expression was significantly increased in E20 MUN kidneys (1.8-fold, P = 0.003; Fig. 1), in agreement with mRNA expression (Table 1). The extrinsic factor Fas-receptor protein was significantly increased at E20 in MUN kidneys (2.2 relative fold, P = 0.002), whereas Fas ligand protein trended up but was not significantly changed (1.4-fold, P = 0.14; Fig. 2). The caspase cascade showed a significant increase in Caspase-9 expression at E20 (1.5-fold, P = 0.03) but no change in the final pathway caspase 3 (1.2-fold, P = 0.69), suggesting no significant overall increase in caspase cascade upregulation (Fig. 3).
Protein expression of intrinsic apoptotic signaling pathway factors – (a) anti-apoptotic Bcl2 (b) pro-apoptotic Bax, (c) pro-apoptotic – p53 as determined by Western blotting for E20 (left) and P1 (right) kidneys. Representative bands for the target protein and β-actin are depicted above each graph (**P ⩽ 0.01; E, embryonic day; P1, birth).

Protein expression of extrinsic apoptotic signaling pathway factors – (a) Fas ligand and (b) Fas receptor – as determined by Western blotting for E20 (left) and P1 (right) kidneys. Representative bands for the target protein and β-actin are depicted above each graph (*P ⩽ 0.05, **P ⩽ 0.01; E, embryonic day; P1, birth).

Protein expression of caspase cascade signaling factors – (a) caspases 9 and (b) 3 – as determined by Western blotting for E20 (left) and P1 (right) kidneys. Representative bands for the target protein and β-actin are depicted above each graph (*P ⩽ 0.05; E, embryonic day; P1, birth).

P1 kidney protein data demonstrate upregulated apoptosis
In contrast to E20, MUN kidneys at P1 showed a significant reduction in the intrinsic anti-apoptotic factor Bcl2 (0.6-fold, P = 0.01) with a concomitant increase in pro-apoptotic Bax protein expression (4.5-fold, P = 0.01; Fig. 1). There was no significant change for p53 protein expression although it trended upward (1.3-fold, P = 0.09; Fig. 1). Similar to E20, the extrinsic factor Fas-receptor protein was significantly increased at P1, (2.0-fold, P = 0.04), whereas the Fas ligand was unchanged from C (1.3-fold, P = 0.18; Fig. 2). In contrast to E20, the caspase cascade showed no change in caspase 9 (1.1-fold, P = 0.59). However, there was a significant increase in the final pathway caspase 3 (1.6-fold, P = 0.03) in P1 MUN kidneys (Fig. 3). These data indicate an increase in apoptotic protein expression after birth.
TUNEL assay detects increased apoptosis in nephrogenic zone mesenchymal cells
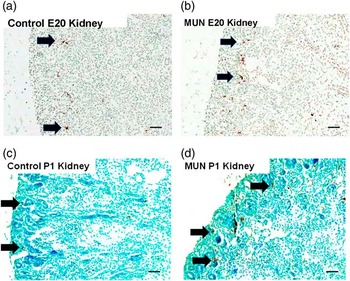
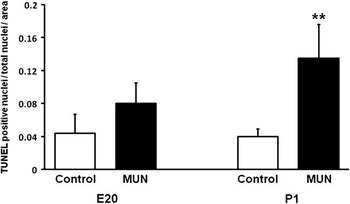
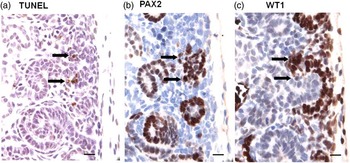
Using the TUNEL assay, apoptotic cells were identified in E20 and P1 MUN offspring kidneys, primarily in the nephrogenic zone and extending to the subnephrogenic zone in P1 kidneys (Fig. 4). Small numbers of apoptotic cells also were seen in epithelial cells of the medullary papillae (data not shown). There was a greater number of apoptotic nuclei in MUN v. control offspring kidneys. Quantitative image analysis of the nephrogenic zones showed a trending increase of apoptosis at E20 (1.8-fold, P = 0.07) and a statistically significant increase at P1 (3.3-fold, P = 0.002; Fig. 5) in MUN kidneys compared with controls. In the nephrogenic zone, apoptotic nuclei were located primarily within the renal mesenchymal compartment, likely in capping mesenchyme and pretubular aggregates as TUNEL stained cells co-expressed PAX2 and/or WT-1 mesenchyme markers for these cell types (Fig. 6).
Apoptotic nuclei in offspring kidneys as determined by TUNEL assay (color online). Apoptotic nuclei (arrows) are evident in control E20 (a) and P1 (c) kidneys. There is an increase in the number of TUNEL-stained nuclei (arrows) in MUN offspring kidneys at E20 (b) and P1 (d) (bar = 50 um; E, embryonic day; P1, birth; MUN, maternal undernutrition).

Quantitative image analysis of TUNEL staining in nephrogenic zones for E20 and P1 kidneys (n = 4 per group). Nuclei were quantitated and normalized to the nephrogenic area of each kidney. E20 trended but was not significantly different (P = 0.07). E20 showed a relative increase in apoptosis of 1.8 and P1 of 3.3-fold (**P ⩽ 0.01; E, embryonic day; P1, birth).

Localization of apoptotic cells in the nephrogenic zone in P1 MUN offspring kidney (color online). Serial sections show (a) cells with apoptotic nuclei stained by TUNEL (arrows), co-express (b) PAX2 (arrows) and (c) WT-1 (arrows) indicating a mesenchymal lineage of the cells undergoing apoptosis (bar = 15 um; P1, birth; MUN, maternal undernutrition).

Discussion
We and others have shown that MUN in the pregnant rat reduces nephron number in adult offspring.Reference Henry, Mansano and Nast6, Reference Schreuder and Nauta26 and results in hypertension; these phenotypes have been documented in human epidemiological studies as well.Reference Silver, Decamps, Korst, Platt and Castro3, Reference Latini, De and Del4 Our MUN model, examined in males, results in a 19% nephron reduction and a 10% increase in adult systolic blood pressure,Reference Henry, Mansano and Nast6 considered to be a moderate undernutrition model. Metanephric nephron formation is a multistage process that occurs entirely during gestation in humans but continues in the rat until postnatal day 8.Reference Moritz and Wintour5 The mechanisms by which MUN lead to loss of nephrons and hypertension are unknown, but have been hypothesized to include altered regulation of ureteric branching gene expression, impaired nephron formation, changes in intra-renal renin-angiotensinogen expression, glucocorticoid tissue responsiveness, epigenetic modulation and possibly increased apoptosis.Reference Ojeda, Grigore and Alexander7, Reference do Carmo Pinho Franco, Nigro and Fortes27, Reference Fowden, Giussani and Forhead28 Apoptosis can result from extracellular signaling, known as the death receptor-mediated or extrinsic signaling pathway or from intracellular signals such as DNA damage that activate the intrinsic apoptotic pathway. All signaling, however, are facilitated by the downstream caspase cascade. Our results show an augmented apoptotic mRNA expression at E20 and protein levels at both E20 and P1, with higher protein expression in P1 v. E20 MUN offspring kidneys.
Increased apoptosis in intrauterine growth-restricted fetal kidneys has been reported earlier in fetal development compared with our study. Welham et al.Reference Welham, Wade and Woolf16, Reference Welham, Riley, Wade, Hubank and Woolf29 examined the effect of protein restriction during gestation and showed upregulated apoptosis primarily in renal mesenchymal cells at E13. Ours is the first report identifying significantly increased apoptosis in nephrogenic zone mesenchymal cells after birth compared with late gestation in MUN offspring kidneys. This timing of MUN-induced fetal kidney apoptosis corresponds to a vulnerable period in nephrogenesis, and is likely important in the resulting phenotype.
Apoptosis during normal nephrogenesis has been detected at embryonic days E13–E15Reference Welham, Wade and Woolf16, Reference Koseki, Herzlinger and Al-Awqati30 and E19Reference Koseki, Herzlinger and Al-Awqati30 in the rat. Similarly, in the mouse, apoptosis has been measured from E11.5 to E16.5Reference Foley and Bard31 and E17Reference Coles, Burne and Raff12 with no appreciable change in apoptosis in the postnatal period,Reference Hartman, Lai and Patterson32 and with mitosis and apoptosis decreasing significantly at kidney maturation.Reference Coles, Burne and Raff12 Although apoptosis has not been evaluated during the entire nephrogenic period, it is likely that normal apoptosis is associated with metanephric growth until completion of at least ureteric bud branching. Whether the loss of nephrons during MUN programming is a gradual process that occurs throughout gestation and the postnatal period or results from loss in a specific time frame is unknown. In some IUGR models such as bilateral uterine vessel ligation, postnatal restoration of nutrition prevents nephron loss,Reference Wlodek, Mibus and Tan33 while postnatal food restriction alone can induce nephropenia.Reference Schreuder, Nyengaard, Remmers, van Wijk and Delemarre-van de Waal8 The MUN model used in this study does not appear to recover nephron loss when rats are placed on a normal postnatal diet,Reference Henry, Mansano and Nast6 suggesting that nephron loss occurs during prenatal and postnatal periods in MUN offspring kidneys.
We observed apoptosis primarily in the nephrogenic zone of the developing kidney, and specifically within the interstitial mesenchyme, adjacent to developing nephrons (Figs 4 and 6) and to lesser degrees in the papillary medulla (data not shown). This was seen for both control and MUN kidneys, with augmented apoptosis in the nephrogenic zone of the later. Apoptosis in normal nephrogenesis occurs primarily in the mesenchymal nephrogenic compartmentReference Carev, Krnic, Saraga, Sapunar and Saraga-Babic34 as well as in the rat medullary papilla.Reference Coles, Burne and Raff12 This suggests that gestational programming is not altering the regional position of apoptosis, but instead is increasing the normal apoptotic rate. In normal mice after birth, there is loss of capping mesenchyme with evidence for increased renal vesicle formation but no replacement from the progenitor pool or increase in apoptosis.Reference Hartman, Lai and Patterson32 In contrast, our data show a significant increase in postnatal apoptosis in this compartment at P1 in MUN offspring kidneys, evidenced by co-localization of TUNEL with WT-1 and PAX2. PAX2 stains cells of capping mesenchyme and the developing proximal nephron, while WT-1 stains these cells as well as uninduced mesenchyme.Reference Hartman, Lai and Patterson32 The loss of these mesenchymal cells would reduce maturation to nephrons, likely impacting ultimate nephron number. It has been suggested that apoptosis occurring during normal nephrogenesis is important in limiting epithelial condensation to discrete fociReference Coles, Burne and Raff12 and impeding interative branching of the ureteric bud tips. If true, MUN programming, which results in a trend to increased apoptosis at E20 and more pronounced apoptosis following birth (P1) when nephrogenesis is increasing rapidly, may result in a further limit of this inductive signaling and a subsequent loss of completed nephrons. This mechanism may explain, in part, how postnatal factors can cause reduction in nephron number in the rat.
During normal nephrogenesis in the mouse, Foley and BardReference Foley and Bard31 reported that the level of apoptosis is much lower than in our study, on the order of 0.25% in the mouse cortex when examined by confocal imaging of whole mount kidneys and counting propidium iodine-labeled apoptotic nuclei. Our findings show 4% apoptosis in the control nephrogenic region at E20 and P1 (Figs 4 and 5) and are roughly in agreement with Coles et al.Reference Coles, Burne and Raff12 (∼3% control apoptotic nuclei). We detected little apoptosis of the medullary region, where it was primarily localized to the medullary papillae (data not shown), also in agreement with this study.Reference Coles, Burne and Raff12 These differences in the degree of apoptotic nuclei may be related to the method of tissue preparation and analysis. We performed TUNEL assay on paraformaldehyde fixed tissue that may allow better identification of apoptotic nuclei; therefore, this is likely to be a more accurate determination of apoptosis at this stage of development. However, there may be an impact of timing, as Foley and Bard's study examined mice at E16.5 (equivalent to E18 in the rat). As there have been no systematic studies of apoptotic rates inclusive of late gestational and early postnatal time periods, this may differ from E20 and P1 under normal circumstances.
Our findings show that genes involved in both the extrinsic and intrinsic pathways of apoptosis as well as the downstream caspase cascade are increased by MUN to various extents at E20 and P1. The extrinsic apoptotic pathway is characterized by activation of pro-apoptotic receptors by extrinsic ligands. There is little known about extrinsic pathway expression in the kidney and our finding is the first report showing an increase in Fas-receptor expression in programmed nephrogenesis. Activation of Fas receptor by Fas ligand results in the formation of the death inducing signaling complex that leads to activation of the protease caspase cascade leading to cell death.Reference Wajant35 Fas overexpression can result is sensitization of cells for Fas ligand binding and increased apoptosis.Reference Jones, Day, Jennings and Sherman36, Reference Muschen, Warskulat, Douillard, Gilbert and Haussinger37 Therefore, it is possible that extracellular signaling processes, such as inflammation, may play a role in programmed kidney apoptosis. Despite this, the majority of apoptotic signaling was detected in the intrinsic pathway. Interestingly, p53 was essentially unchanged in protein expression, but this result may be explained by the fact that p53 is largely regulated by protein phosphorylation and acetylation, which remains to be examined in future studies. An exception to the upregulated factors was the expression of Bcl2, an anti-apoptotic gene that was increased significantly at E20 but decreased in P1 kidneys. Bcl2 expression is associated with proliferation, and Bcl2-deficient mice develop smaller kidneys and reduced nephron numbers,Reference Sorenson, Rogers, Korsmeyer and Hammerman38 suggesting that a lack of or reduction in Bcl2 expression may result in increased apoptosis during nephrogenesis. Bcl2's increased expression in late gestation (E20) may be compensatory in the MUN model, reflecting a relative balance of proliferative signaling to apoptotic signaling that explains why there is less apoptosis at E20, and is negated after birth.
In addition to upregulated apoptosis signaling, there likely are changes in other signaling pathways in MUN offspring kidneys that indirectly affect apoptosis. Loss of signaling in some pathways may decrease proliferation, thereby increasing the ratio of apoptotic cells. Little is known about pro- and anti-proliferative signaling in this model. Simon et al.Reference Welham, Riley, Wade, Hubank and Woolf29 showed that Prox-1 and Cofilin 1 genes are downregulated in developing rat kidney. However, these genes are involved in proliferation and organization of renal mesenchyme as opposed to apoptosis.Reference Welham, Riley, Wade, Hubank and Woolf29 Our studies have shown a decrease in the proliferative GDNF growth factor pathway in E20 MUN fetal kidneysReference Henry, Mansano and Nast6, which may also impact the proliferation to apoptosis ratio. In addition, we recently showed significant reduction of Notch2 in E20 MUN offspring kidneys.Reference Magee, Tafti and Desai15
Notch2 has been shown to suppress apoptosis, and loss of Notch2 activity is associated with apoptosis induction.Reference Liu, Hsiao, Tsou and Lai39, Reference Duechler, Shehata and Schwarzmeier40 Therefore, this mechanism also may play a role in upregulated apoptosis in MUN programming.
A central question in programming of nephrogenesis is the mechanism of nephron loss. Presumably, loss of nephrons can result from a defect in a stage(s) of nephron formation, degradation of existing nephrons or in a reduction in the rate of ureteric branch tip number that reduces the number of forming nephrons or possibly a combination of all these. In addition, it is unknown whether a particular time point is more susceptible to nephron loss or that increased nephron loss is a gradual, steady effect of malnutrition during nephrogenesis. On the basis of our finding that increased apoptosis is occurring primarily in the nephrogenic zone, in the interstitial mesenchyme and likely in early stage nephron formation, and that many early developmental factors (GDNF, WNT11 and others) are reduced by MUN, we speculate that MUN impacts early stages and not preexisting nephrons. We have not detected apoptosis of fully formed nephrons but this remains to be investigated. A reduction in branch tip formation, however, is likely to also play a role since branching migration factors are also affected by MUN.Reference Henry, Mansano and Nast6, Reference Abdel-Hakeem, Henry and Magee10
In conclusion, we have shown upregulation of mRNA and proteins involved in apoptosis in the MUN offspring rat's kidney. We have also shown that the apoptotic increase is primarily in interstitial mesenchyme and is significantly increased at a postnatal time point. It remains to be determined whether this increased apoptosis directly leads to loss of nephrons in this model.
Acknowledgements
This study was supported by NIH Grant no. R03HD060782 to TRM. We thank Qinghai Liu for technical assistance, Linda Day and Stacy Behare for animal husbandry, Diane Park for manuscript preparation and Shalin Patel for reference assistance. The authors have no conflict of interest to declare.