I. INTRODUCTION
The efficient electrochemical conversion of H2O and CO2 into fuel is an attractive technique for storing energy produced by intermittent renewable energy sources such as solar or wind. Feasible large-scale deployment of this type of system requires the discovery of improved electrocatalysts containing only earth-abundant elements.Reference Walter, Warren, McKone, Boettcher, Mi, Santori and Lewis1–Reference Suntivich, May, Gasteiger, Goodenough and Shao-Horn3 In particular, the 4-electron oxygen evolution reaction (OER) is kinetically slow and improved catalysts are required for artificial photosynthesis and electrolysis of hydrogen or carbon-containing fuels.Reference Cook, Dogutan, Reece, Surendranath, Teets and Nocera2 Because a robust fundamental understanding of the basic science and mechanistic details of multi-electron heterogeneous electrocatalysis is lacking, an efficient high throughput synthesis and property screening methodology is well suited to empirically discover the requisite new catalytic materials.Reference Woodhouse and Parkinson4–Reference Liu, Shen, Yang, Zou, Ji, Shi, Zhang, Liu, Xiao, Zheng, Li, Fan and Stucky12 Mixed metal oxides in the (Ni–Fe)Ox and (Ni–Co)Ox composition spaces are among the most active and most studied OER catalysts,Reference Cook, Dogutan, Reece, Surendranath, Teets and Nocera2,Reference Trotochaud, Ranney, Williams and Boettcher13–Reference Nikolov, Darkaoui, Zhecheva, Stoyanova, Dimitrov and Vitanov16,Reference Castro and Gervasi17–Reference Bocca, Barbucci, Delucchi and Cerisola20 and combinatorial methods have been deployed to search pseudo-ternary spaces for improved OER catalysts.Reference Seley, Ayers and Parkinson7–Reference Gerken, Shaner, Masse, Porubsky and Stahl9,Reference Minguzzi, Alpuche-Aviles, Lopez, Rondinini and Bard11 We have established high throughput methods to systematically investigate the performance of pseudo-quaternary material libraries as OER electrocatalysts and have reported a new, highly active catalyst composition region in the (Ni–Fe–Co–Ce)Ox composition space.Reference Haber, Cai, Jung, Xiang, Mitrovic, Jin, Bell and Gregoire21 Our continued investigation of this material system has revealed systematic trends in electrochemical signalsReference Haber, Xiang, Guevarra, Jung, Jin and Gregoire22; while our expansion of this composition space has led to the discovery of a new, highly active catalyst composition region in the (Ni–La–Co–Ce)Ox composition space.Reference Haber, Guevarra, Jung, Jin and Gregoire23
In conventional electrocatalyst research the parameters of primary interest relate to stability, cost, and the current–voltage (Tafel) behavior at the current densities of interest. However, additional physical parameters are relevant for OER catalysts for use in distributed solar fuel generators, in which the catalyst is deposited on the surface of the light absorber (e.g., semiconductor(s)). The overall device performance in this configuration will critically depend not only upon the Tafel behavior at relatively low current densities (∼10 mA cm−2), but also upon the catalyst transparency at the operating potential, as this may strongly impact the photon flux reaching the light absorber. The overall device performance will also depend upon the interfacial chemistry and electronic interactions (e.g., junction formation) between the catalyst and the light absorber, which could be unique to the particular combination of catalyst, light absorber and synthesis method.Reference Boettcher, Strandwitz, Schierhorn, Lock, Lonergan and Stucky24–Reference Riha, Klahr, Tyo, Seifert, Vajda, Pellin, Hamann and Martinson26 Because these interactions, as well as the impact of a particular catalyst transmission spectrum, depends upon the light absorber it is in contact with, no single “best” catalyst can be identified in isolation from the entire device architecture and operating conditions. However, the transparency of the catalyst under operating potential is a critical parameter that can be measured as a function of catalyst composition and then combined with the band gap or absorption spectrum of a potential light absorber to generate an improved figure of merit for catalyst performance.Reference Gregoire, Xiang, Mitrovic, Liu, Marcin, Cornell, Fan and Jin27 Herein we report high throughput capabilities for acquisition of the requisite spectral data on catalyst libraries under OER operating conditions.
An overview of in situ and operando catalysis research focused on gas-phase heterogeneous catalysis was provided by Banares.Reference Bañares28 While considerably less effort has been dedicated to in situ and operando studies of electrocatalysts, a recent review of electrochemical methods includes an excellent summary,Reference Bandarenka, Ventosa, Maljusch, Masa and Schuhmann29 with most methods focused on either elucidating a catalytic mechanism or providing performance metrics such as product analysis and stability. Previous studies have combined x-ray spectroscopy with an electrochemical cell to study x-ray fine structure and optical reflectance of nickel-based thin films to investigate structure–activity relationships.Reference Hu, Bae, Mo, Scherson and Antonio30,Reference Bediako, Lassalle-Kaiser, Surendranath, Yano, Yachandra and Nocera31 These metrics sufficiently describe the performance of electrocatalysts for many applications, but for solar fuel generation, the optical properties of the OER catalyst have significant impact on device efficiency. The most common earth-abundant OER catalysts for use in basic aqueous media are transition metal oxide alloys containing Ni. Nickel oxide is a highly studied anodic electrochromic material known to exhibit markedly different optical properties under OER conditions compared to ambient conditions.Reference Rauh32,Reference Niklasson and Granqvist33 Many other transition metal oxides of interest as OER catalysts have also been investigated as electrochromic materials, including oxides of Co,Reference Svegl, Orel, Hutchins and Kalcher34 Fe,Reference Orel, Macek, Svegl and Kalcher35–Reference Ozer and Tepehan37 and Ir.Reference Beni and Shay38–Reference Chen, Taylor and Scherson40
To evaluate optical properties of catalysts under solar fuel conditions, Trotochaud, et al. recently reported in situ transmission and absorption spectra of commonly used thin film catalysts such as NiOx, IrOx, Ni50Co50Ox, and Ni90Fe10Ox.Reference Trotochaud, Mills and Boettcher41 Yoshida et al. have investigated the electrochromic behavior of nickel borate thin films.Reference Yoshida, Iida, Mineo, Yomogida, Nitta, Kato, Nitani, Abe, Uruga and Kondoh42 As expected, the Ni-based catalysts are much less transparent under operational conditions with variations in catalyst transmission noted for the different compositions. For OER in base, the range of viable catalyst compositions is quite extensive and encompasses metal oxides containing 3 or 4 cations including mixtures of transition metals and rare earths.Reference Gerken, Chen, Masse, Powell and Stahl8–Reference Smith, Prévot, Fagan, Trudel and Berlinquette10,Reference Haber, Cai, Jung, Xiang, Mitrovic, Jin, Bell and Gregoire21–Reference Haber, Guevarra, Jung, Jin and Gregoire23 Due to the wide range of optical properties of the elemental oxides, the optical transmission of the mixed-metal oxide compositions must be mapped under operating potentials to ascertain the optimal materials for solar fuel applications.
We present a combined electrochemical and optical instrument incorporated within a high throughput framework to robotically characterize a material library. Spectral transmission is measured and synchronized with electrochemical signals to ascertain the transmission of mixed metal oxides under OER conditions. In general, high throughput electrochemistry with in situ spectroscopy enables a wealth of combinatorial experiments. In this manuscript we focus on its application for the identification of optimal OER catalysts for solar fuel applications.
II. EXPERIMENTAL
A. Library synthesis
The composition library of mixed-metal oxide catalysts containing Ni, Co, Ce, La, and Fe was prepared by synthesizing the following 6 pseudo-ternary composition spaces: (Ce–Ni–La)Ox, (Ni–La–Co)Ox, (La–Co–Ce)Ox, (Co–Ce–Ni)Ox, (Ce–Ni–Fe)Ox, and (Ni–Fe–Co)Ox. In addition to the unary end-member compositions, these spaces include 9 pseudo-binary systems: (Ce–Ni)Ox, (Ce–La)Ox, (Ni–La)Ox, (Ni–Co)Ox, (La–Co)Ox, (Co–Ce)Ox, (Ni–Fe)Ox, (Ce–Fe)Ox, and (Fe–Co)Ox. The composition spaces were synthesized as a discrete library with 5 at.% composition steps for each element, resulting in a set of 1031 unique compositions. The array of composition samples was deposited by inkjet printing onto the FTO-coated side of a 10 cm × 15 cm glass plate at a resolution of 2880 × 1440 dpi, as described previously.Reference Gregoire, Xiang, Mitrovic, Liu, Marcin, Cornell, Fan and Jin27,Reference Gregoire, Xiang, Liu, Marcin and Jin43 Each composition was synthesized as a 1 mm × 1 mm composition sample containing 3.8 nmol of the metal on a 2 mm pitch. Elemental precursor inks, of the type previously described,Reference Liu, Shen, Yang, Zou, Ji, Shi, Zhang, Liu, Xiao, Zheng, Li, Fan and Stucky12,Reference Haber, Cai, Jung, Xiang, Mitrovic, Jin, Bell and Gregoire21–Reference Haber, Guevarra, Jung, Jin and Gregoire23,Reference Gregoire, Xiang, Mitrovic, Liu, Marcin, Cornell, Fan and Jin27,Reference Gregoire, Xiang, Liu, Marcin and Jin43,Reference Fan, Boettcher and Stucky44 were prepared by mixing 5 mmol of each metal precursor with 0.80 g Pluronic F127 (Aldrich), 1.0 mL glacial acetic acid (T.J. Baker, Inc.), 0.40 mL of concentrated HNO3 (EMD), and 30 mL of 200 proof ethanol (Koptec). The metal precursors were Ni(NO3)2–6H2O (1.56 g, ≥98.5%, Sigma Aldrich), Co(NO3)2–6H2O (1.49 g, 99.999%, Sigma Aldrich), Ce(NO3)3–6H2O (2.47 g, 99.99%, Sigma Aldrich), La(NO3)3–6H2O (2.19 g, 99.999%, Sigma Aldrich), and Fe(NO3)3–9H2O (2.14 g, ≥98%, Sigma Aldrich). The Fe-containing compositions were printed on one glass plate and all other compositions printed on a second glass plate, with identical printing and processing conditions applied to each plate. After inkjet printing the library, the inks were dried and the metal precursors converted to metal oxides by calcination in air at 40 °C for 18 h, then at 70 °C for 24 h, followed by a 5 h ramp and 10 h soak at 350 °C. The oxygen stoichiometry for each sample is not known and thus we refer to samples using the intended cation composition. While we do not report catalyst composition measurements here, we have demonstrated that the intended compositions are produced within the uncertainty of energy-dispersive spectroscopy measurements.Reference Haber, Cai, Jung, Xiang, Mitrovic, Jin, Bell and Gregoire21,Reference Haber, Guevarra, Jung, Jin and Gregoire23 Select compositions NiOx, Co0.25La0.75Ox, and Ni0.25Co0.25Ce0.5Ox were deposited with a higher loading of 7.5 nmol of metal per 1 mm2 sample on a separate library plate and characterized individually, as described below.
For each library plate, the catalyst compositions were distributed randomly over the grid of library sample positions so that any spatial and temporal artifacts would not be convoluted with composition and appear as systematic composition trends in the measured figures of merit (FOM). The measurements exhibited some experimental noise and to better visualize the systematic composition trends, a simple smoothing algorithm was applied in the composition space. For a select composition, the reported FOM is the average FOM over the set of samples including the select composition and its composition neighbors (compositions within 5 at.%). For each set of FOM values, any outlier FOM values beyond 2 standard deviations of the mean FOM were disregarded.
B. High throughput in situ optical characterization of electrocatalysts
Combined electrochemistry–spectroscopy measurements were performed on individual composition samples using a custom built scanning drop cell (SDC) with integrated optical illumination and detection. The previously reported SDC is an electrochemical flow cell that isolates solution contact to an individual 1 mm2 sample without a gasket.Reference Gregoire, Xiang, Liu, Marcin and Jin43 The 3-electrode cell with Ag/AgCl reference electrode and Pt wire counter electrode was controlled by a Gamry G 300 potentiostat (Gamry Instruments, Warminster, PA) and custom software, and chronoamperometry (CA) and cyclic voltammetry (CV) experiments were performed in aqueous 1 M NaOH electrolyte.
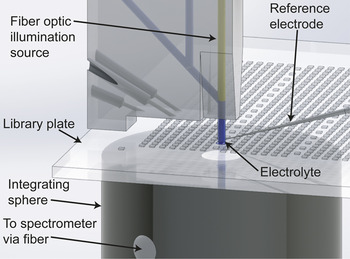
The SDC, shown in Fig. 1, was suspended above the library plate and rastered over the array of library samples. A 0.4-mm-diameter optical fiber was integrated into the central port of the SDC and terminated in the electrolyte solution, approximately 1 mm above the library plate. The resulting illumination footprint on the catalyst was slightly less than 1 mm in diameter. This optical fiber was coupled to a xenon arc lamp (Newport 66921, 450 W) to provide broadband illumination of the catalyst. Light transmitted through the catalyst was collected by an integrating sphere (Spectral Products AT-IS-1) positioned approximately 1 mm from the bottom surface of the library plate, as shown in Fig. 1. The integrating sphere was fiber-coupled to an ultraviolet–visible (UV–vis) spectrometer (Ocean Optics USB 4000, Ocean Optics, Inc., Dunedin, FL) to record transmission spectra. The 8 mm orifice of the integrating sphere collected all light transmitted by the catalyst with scattering angle less than approximately 50°. Optical characterization of the as-prepared materials was performed in the absence of electrochemistry by using the same configuration without flowing electrolyte through the SDC. The apparatus was enclosed to block ambient light from entering the integrating sphere.
Drawing of the apparatus for combined electrochemistry and spectroscopy measurements. The SDC with integrated optical fiber (light source), sample plate library, and integrating sphere are emphasized by removing some components of the SDC for clarity.

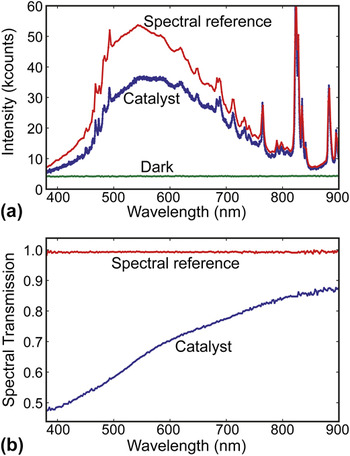
The illumination spectrum, whose intensity varied gradually due to the lamp, was calibrated using reference spectra acquired at designated positions on the library plate through bare FTO/glass. Reference spectra were acquired before and after each sample for experiments lasting longer than 1 min per sample and once per 14 samples for shorter experiments. For each sample, the average of the spectra collected at the preceding and subsequent reference spots was used as the reference spectrum. The dark spectrum of the spectrometer was collected at the start of the experiment with the light source blocked. Spectral transmission was calculated for each sample as:
 $$T\left( \lambda \right) = {{\left( {{S_{\rm{c}}} - {S_{{\rm{dark}}}}} \right)} \mathord{\left/ {\vphantom {{\left( {{S_{\rm{c}}} - {S_{{\rm{dark}}}}} \right)} {\left( {{S_{{\rm{ref}}}} - {S_{{\rm{dark}}}}} \right)}}} \right. \kern-\nulldelimiterspace} {\left( {{S_{{\rm{ref}}}} - {S_{{\rm{dark}}}}} \right)}}\quad {\rm{,}}$$
where S c is the measured spectrum for the catalyst, S ref is the spectral reference, and S dark is the dark spectrum, as shown in Fig. 2.
(a) Example spectra are shown for a spectral reference site (red), catalyst sample (blue), and a dark scan collected with the light source blocked (green). (b) The spectral transmission [see Eq. (1)] is shown for a spectral reference site (red) and catalyst sample (blue).

The optical transmission efficiency for each sample was calculated by weighting the spectral transmission by the ASTM 6173-03 standard for global air mass 1.5 spectral irradiance (E AM1.5(λ)) and integrating over the wave lengths of interest:
 $$\alpha _T = {{\int_{\lambda _1 }^{\lambda _2 } {T\left( \lambda \right)E_{{\rm{AM}}1.5} \left( \lambda \right)\,\,{\mathop{\rm d}\nolimits} \lambda } } \mathord{\left/ {\vphantom {{\int_{\lambda _1 }^{\lambda _2 } {T\left( \lambda \right)E_{{\rm{AM}}1.5} \left( \lambda \right)\,\,{\mathop{\rm d}\nolimits} \lambda } } {\int_{\lambda _1 }^{\lambda _2 } {E_{{\rm{AM}}1.5} \left( \lambda \right)\,\,{\mathop{\rm d}\nolimits} \lambda } }}} \right. \kern-\nulldelimiterspace} {\int_{\lambda _1 }^{\lambda _2 } {E_{{\rm{AM}}1.5} \left( \lambda \right)\,\,{\mathop{\rm d}\nolimits} \lambda } }}\quad {\rm{.}}$$
The wave length interval 380–900 nm was chosen as the primary range of interest for solar fuel applications.
III. RESULTS AND DISCUSSION
A. In situ optical characterization of electrocatalysts
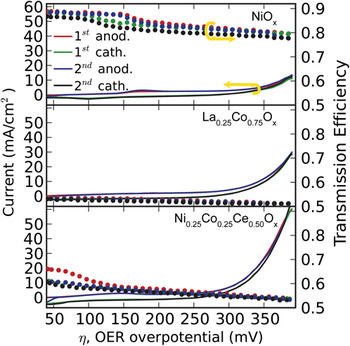
The integration of the UV–vis transmission measurements into the SDC provides the capability to measure optical properties during electrochemical experiments. By performing CVs over a range of OER overpotential (η) and recording time-resolved transmission spectra, the relationships among potential, catalytic current, and optical transmission were mapped for select catalyst compositions with a relatively high loading of 7.5 nmol of the metal per 1 mm2 sample. Figure 3 shows catalytic current and transmission efficiency data for NiOx, La0.25Co0.75Ox, and Ni0.25Co0.25Ce0.5Ox compositions for CV experiments (20 mV s−1, 2 cycles, η = 40–390 mV) with 0.5 s spectrometer integration time.
Current density (solid lines, left scale) and optical transmission efficiency (circles, right scale) for NiOx, La0.25Co0.75Ox, and Ni0.25Co0.25Ce0.5Ox composition samples acquired during CVs from 40–390 mV OER overpotential. For each composition, the data are colored according to the segment from the 2 CV cycles (red, green, blue, and black in chronological order).

Nickel oxide is a well-studied electrochromic material and is presented as a standard sample in Fig. 3. NiII oxide is a highly transparent oxide known to undergo oxidation to a brown NiIII hydroxide at low OER overpotential, and NiOOH exhibits moderate catalytic activity at higher overpotentials.Reference Rauh32Figure 3 shows excellent reproduction of this behavior, with the reversible redox reaction clearly seen in both the electrochemical and optical signals. While the sample redox is specific to the cation composition, other behavior is common to all 3 catalyst compositions. The transmission efficiency decreases monotonically and fairly linearly with OER overpotential. Since this trend is maintained on both the anodic and cathodic voltage sweeps and are well reproduced over both CV cycles, we conclude that the catalysts have reached quasi-equilibrium at each potential. We also note that the underlying cause for the linear trend in transmission with respect to potential is unknown. It is worth noting that due to the efficient solution flow of the SDC instrument, no O2 bubbles were observed on the active cell during these experiments.
The (La–Co)Ox composition space contains well-known OER catalysts, and as shown in Fig. 3 the La0.25Co0.75Ox catalyst exhibits higher catalytic current than Ni but remains relatively dark with transmission efficiency near 0.5 over the measured range of OER overpotential. The Ni0.25Co0.25Ce0.5Ox catalyst composition is in a family of Ce-rich catalysts that we reported previously.Reference Haber, Cai, Jung, Xiang, Mitrovic, Jin, Bell and Gregoire21 The only notable feature in the optical transmission efficiency is the initial darkening of the catalyst at the very start of the CV, which is likely due to oxidation of the catalyst at potentials below the observed NiII/III transition, in agreement with our previous characterization of redox in this composition region.Reference Haber, Xiang, Guevarra, Jung, Jin and Gregoire22 This catalyst exhibits the largest catalytic current of the three compositions, with optical transmission efficiency between that of the NiOx and La0.25Co0.75Ox catalysts.
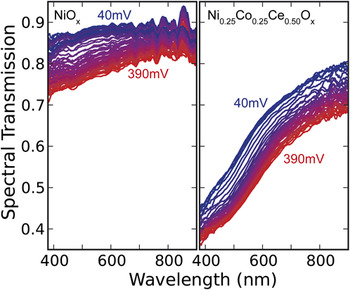
As noted by Eq. (2), the transmission efficiencies reported in Fig. 3 were calculated from the full transmission spectra measured at 0.5 s or 10 mV intervals during the CV experiments. For the NiOx and Ni0.25Co0.25Ce0.5Ox catalysts, the transmission spectra are shown for the first anodic sweep of the CVs. Other than the gradual decrease in transmission with increasing potential, the primary observation from the NiOx catalyst is the sharp drop in transmission for wave lengths near 500 nm, which occurs at the NiII/III transition, in excellent agreement with reported behavior of Ni oxide.Reference Trotochaud, Mills and Boettcher41 As discussed above and reported previously, the redox behavior of the Ni0.25Co0.25Ce0.5Ox catalyst is markedly different from that of NiOx, and a substantial difference is also observed in the spectral transmission. The 500 nm spectral signature of NiII/III is not observed and the change in transmission is fairly uniform over the entire wave length range. We note that the spectral transmission, and its variation with time and potential, provides information that can be mined to probe the chemical nature of each cation in compositionally complex catalysts. For the development of optimal OER catalysts for solar fuel applications, we forgo interpretation of the spectral data and apply Eq. (2) to ascertain the optical transmission efficiency.
B. Combinatorial search for optimal solar fuel OER electrocatalyst
The results of Figs. 3 and 4 and our previous characterization of redox in these composition spacesReference Haber, Xiang, Guevarra, Jung, Jin and Gregoire22 were used to design a high throughput mapping of the optical transmission of operational OER catalysts. Each catalyst was operated at η = 330 mV for 6 s. We observed that during these CA experiments, electrochemical and optical transients occur for up to 4 s, yielding the remaining 2 s integration time for measuring the quasi-equilibrium catalytic current and optical transmission.
Spectral transmission of the first anodic sweep described in Fig. 3 for NiOx (left) and Ni0.25Co0.25Ce0.5Ox (right) are shown for potentials ranging from η = 40 mV (blue) to η = 390 mV (red) in 10 mV steps.

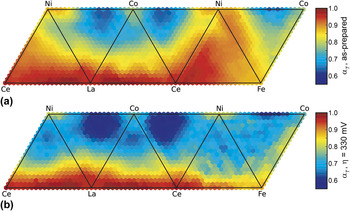
The CA experiments were performed on catalysts with catalyst loading of 3.8 nmol of metal per 1 mm2 sample and covering the 6 pseudo-ternary composition spaces. Figure 5 shows the compositional maps of transmission efficiency for both the as-prepared oxides (before exposure to the electrolyte solution) and operational catalysts at η = 330 mV. The composition trends of the as-prepared oxides are somewhat intuitive given knowledge of the pure metal oxide compositions, with fairly linear trends over the composition space. Exceptions to this behavior include the low transmission of (Ni–Co)Ox compositions compared to that of the end members.
Composition map for the efficiency of transmitting AM1.5 light between 380 and 900 nm for (a) as-synthesized materials and (b) the operational catalysts at η = 330 mV OER overpotential.

Following the observation from Fig. 3, all compositions darkened upon exposure to electrolyte solution and operation at anodic potential. The relative change in transmission is largely governed by the catalyst film redox reactions, which may or may not vary with composition depending on the phase behavior of these high-order composition spaces. This data has rich informatics value and we note some general observations: Ni is the only pure elemental oxide that undergoes significant darkening, compositions with at least 80% Ce or La remain highly transparent, and the largest decrease in transmission occurs for (Ni–Fe)Ox compositions. Literature reports of comparable experiments are limited, but we note that the results are in agreement with recent characterization of select transition metal oxide compositions.Reference Trotochaud, Mills and Boettcher41
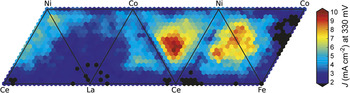
The compositional map of catalytic current density from the same CA measurement at η = 330 mV is shown in Fig. 6. The compositions with highest current density are near Ni0.25Co0.25Ce0.5Ox with slightly lower current near Ni0.6Fe0.4Ox, in agreement with previous reports.Reference Haber, Cai, Jung, Xiang, Mitrovic, Jin, Bell and Gregoire21 In addition, locally optimal activity in the (La–Co–Ce)Ox composition space is in agreement with previously published results.
Composition map of the OER catalytic current at η = 330 mV OER overpotential.

We previously reported a straightforward metric that combines the desired catalyst properties of high catalytic current and high optical transmission.Reference Gregoire, Xiang, Mitrovic, Liu, Marcin, Cornell, Fan and Jin27 To date, the combined efficiency has been calculated using optical data acquired in ambient conditions, but Fig. 5 clearly shows the importance of in situ optical measurements. The combined catalyst efficiency was calculated as the product of the optical transmission efficiency and catalytic current efficiency:
 $${\alpha _C} = {\alpha _T}\left( {{J \mathord{\left/ {\vphantom {J {{J_{{\rm{max}}}}}}} \right. \kern-\nulldelimiterspace} {{J_{{\rm{max}}}}}}} \right)\quad {\rm{,}}$$
where the current density J is normalized by J max, the maximum current density of interest. The CA at η = 330 mV was chosen to yield a maximum catalytic current density near 10 mA cm−2, which is a nominal target for nonconcentrated solar water splitting.
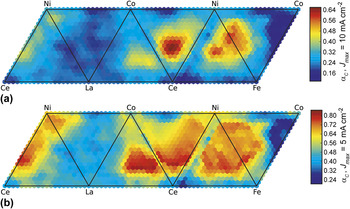
Applying Eq. (3) to the optical and catalytic data in Figs. 5(a) and 6 yields the combined efficiency map of Fig. 7(a). The compositions within 10 at.% of Ni0.25Co0.25Ce0.50Ox emerge as the optimal catalysts with the best αC value near 0.65. In this composition region, both the catalytic current and optical transmission are comparable to or exceed those of the traditional transition metal oxide catalysts. Ce is an important component in the optimal composition region and it is worth noting that in the (Ni–Co–Ce)Ox space, this noted composition region is the only local maximum in combined efficiency. In the (Ni–Fe–Ce)Ox space, the composition trends are quite different and the combined efficiency decreases with increasing Ce concentration above 30 at.%. These trends demonstrate that the highly transparent rare earth oxides are not simply improving performance by diluting the relatively dark transition metal oxides. The differences in CeOx interactions with (Ni–Co)Ox compositions compared to that of (Ni–Fe)Ox compositions merits further investigation.
Composition maps of the combined catalytic and optical transmission efficiency for (a) J max = 10 mA cm−2 and (b) J max = 5 mA cm−2.

As described in detail elsewhere,Reference Gregoire, Xiang, Mitrovic, Liu, Marcin, Cornell, Fan and Jin27 the operational current density and overpotential of the OER catalyst in an integrated solar fuel device is ultimately determined by the light absorber and current-matched cathode. The spectral absorption of the photoabsorber stack is of particular importance and can be added as an additional weighting factor in Eq. (2). That is, more detailed calculation of the catalyst efficiency cannot be performed without detailed knowledge of the rest of the solar fuel generator. Trotochaud et al.Reference Trotochaud, Mills and Boettcher41 used a model semiconductor with complete absorption above the band gap energy and the ideal diode equation with chosen parameters to calculate an optocatalytic efficiency for select catalyst compositions as a function of thickness. Using the data presented here, the same exercise could be performed for a select catalyst thickness as a function of composition. Instead, we present an illustrative example calculation that requires fewer assumptions about the photoabsorber. The photoabsorber stack may place a limit on the desired catalytic current from the OER catalyst and we consider a photoabsorber that provides η = 330 mV and J max = 5 mA cm−2 to the OER catalyst. In this scenario, there is no benefit for catalysts to exhibit a current density in excess of J max, and for those catalysts the current density ratio in Eq. (3) is taken to be unity such that αC is equal to αT. The resulting compositional map of the combined efficiency is shown in Fig. 7(b) and is markedly different from the J max = 10 mA cm−2 scenario of Fig. 7(a). In particular, optimal performance is obtained with Ni-free, Fe-free catalysts in the (Co–La–Ce)Ox space. In this illustrative example, catalysts in the Ni0.25Co0.25Ce0.50Ox and Ni0.6Fe0.4Ox composition regions saturated the maximum catalytic current, so improved performance may be attained in those composition regions by lowering the catalyst loading to sacrifice catalytic current in favor of increased transparency. The catalyst loading is another dimension of the combinatorial parameter space that can readily be explored by the methods outlined above, and will be reported in future work.
It is worth noting that Eqs. (2) and (3) describe extrinsic material properties and the reported compositional trends are likely sensitive to deposition and processing conditions. We have observed that the inkjet printing and calcination technique produce discontinuous films such that the FTO underlayer is exposed over a finite area fraction of each 1 mm2 sample. This film morphology and FTO exposure do not strongly vary with sample composition. These noncontiguous thin films place a lower limit on the measured transmission efficiency. While all of these phenomena should be considered when interpreting the reported data, they do not impact the evaluation of composition-property trends for these mixed-metal oxide catalysts that were synthesized, processed, and screened under identical conditions.
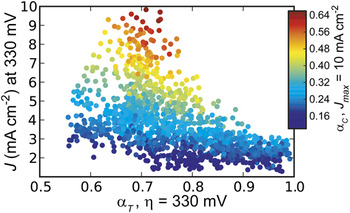
This study of 1031 unique compositions provides the most extensive evaluation of the catalysis and optical transmission functions of OER catalysts for solar fuel applications. The composition space is quite extensive, covering 6 pseudo-ternary composition spaces of 3 transition metal and 2 rare earth oxides. The elemental oxides cover a wide range of optical and catalytic properties, posing a question of the relationship between catalytic activity and optical transparency for the mixed-metal oxide compositions. Combining the data in Figs. 5(b) and 6, Fig. 8 shows the relationship between transmission efficiency and catalytic current at η = 330 mV, with each data point colored by the combined efficiency of Fig. 7(a). For these composition spaces, these performance metrics have a clear anticorrelation. Perhaps the most illustrative observation from this figure is that the set of compositions in the top 20th percentile of transmission efficiency is mutually exclusive from the set of compositions in the top 20th percentile of catalytic current. The combined efficiency of Eq. (3) provides a metric for navigating this trade-off, but the data reveal that the best catalysts are not highly transparent. The combination of rare earth oxides with the standard transition metal oxides is beneficial in this regard, but significant opportunities remain for development of superior materials.
A scatter plot of current density versus transmission efficiency for all 1031 compositions with points colored by the combined efficiency from Fig. 7(a).

IV. CONCLUSIONS
For technologies that rely on integration of several functional materials, each material must meet a number of design specifications, requiring in situ techniques to properly characterize the material performance. The primary functions of OER catalysts for solar fuel applications are to catalyze the OER and pass light to the underlying light absorber(s). Since the optical transparency of metal oxides changes under operational OER conditions, the performance of a catalyst can be well characterized by a combined optical-electrochemical experiment. A wide range of metal oxides have been reported as active OER catalysts in basic water, and high throughput screening techniques offer a powerful approach to ascertain the optimal materials. A new high throughput electrochemistry instrument with in situ spectroscopy measurements was developed and used to screen 1031 unique mixed-metal oxides containing Ni, Co, Ce, La, and Fe. Simultaneous measurements of catalytic current and spectral transmission demonstrate that addition of rare earths, in particular Ce, to transition metal oxides can effect improvements in catalytic activity and optical transparency. An efficiency metric that combines optical and catalytic performance was defined, and at 330 mV OER overpotential several important composition trends were observed, with Ni0.25Co0.25Ce0.50Ox identified as the optimal composition. Other compositions may be optimal for pairing with particular solar fuel subsystems, and the archived high throughput data can be mined to generate compositional maps of catalyst efficiency for given operational parameters.
ACKNOWLEDGMENTS
This manuscript is based upon work performed by the Joint Center for Artificial Photosynthesis, a DOE Energy Innovation Hub, supported through the Office of Science of the U.S. Department of Energy (Award No. DE-SC0004993). The authors thank Ryan R.J. Jones for assistance with preparation of graphics.