1 Introduction
Contact between languages has always been recognised as a major factor in language change (Thomason Reference Thomason2001: 59ff.). Changes due to contact are to be found in all aspects of language, lexical, grammatical, phonological, even aspects of idiom and usage. When language revitalisation is added to the mix, the capacity for change is even greater. The actual changes involved and the mechanisms vary from case to case and depend on an array of factors including the type and degree of contact, and to some extent the degree of parallelism between the systems and structures of the language concerned (King et al. Reference King, Harlow, Watson, Keegan, Maclagan, Reyhner and Lockard2009).
Hebrew is a well-documented example of a revitalised spoken language that has undergone sound change (see for example Ravid & Shlesinger Reference Ravid and Shlesinger2001), although it is not in the shadow of a dominant contact language. In contrast sound change has been identified in the revitalised language of Scottish Gaelic (Nance & Smith Reference Nance and Stuart-Smith2013), which exists in an environment dominated by Scottish English, and in lower Sorbian, which is struggling to survive in the same environment as German (Marti, Andreeva & Barry Reference Marti, Andreeva and Barry2009). In this paper, we focus on phonetic change in two quite disparate languages which have been in very close contact for some 180 years, one of which, Māori, has undergone extensive revitalisation in the last 30 years. We examine the speech from three groups of Māori, who are fluent Māori and English speakers, and whose birth dates span over 100 years. We investigate the changes occurring over time in the two languages and seek to establish how they are related.
1.1 Māori and New Zealand English
Māori is the language of the indigenous people of New Zealand (NZ). It is the most southerly of the Polynesian languages, which are a subgroup of the Austronesian language family (Harlow Reference Harlow2007). Around 14% of the total Māori population of 598,605 (Statistics New Zealand 2013) claim to speak Māori well or very well (Te Puni Kōkiri Reference Kōkiri2008: 22). At present it is spoken to at least some extent by around 150,000 people, which is approximately 3.5% of the total population of New Zealand.
Māori were the first people to settle in NZ in approximately 1200 ad (Anderson Reference Anderson and Byrnes2009). Abel Tasman was the first European to sight NZ in 1642 but he did not land. There is no record of any other voyage to NZ from anywhere else in the world until the late 1700s, when once again there were voyages from Europe. Therefore up till the 1700s, Māori had no contact with speakers of other languages. However, from this point in time onwards the number of European voyagers to New Zealand increased, and for the last 180 years the Māori language has had increasing contact with English (Harlow Reference Harlow2007: 192–196). Europeans (predominantly British) began settling in New Zealand in earnest from the mid-1800s, and by about the 1860s the European (English-speaking) population outnumbered the Māori population.
Orthography for the Māori language was produced in the early 1800s (see for example Kendall & Lee Reference Kendall and Lee1820),Footnote 1 reaching more or less its present form by the early 1840s, and the early missionaries taught Māori to read in their own language. But by the end of the 1800s most Māori were receiving schooling in English. Nevertheless, most Māori were bilingual speakers of Māori and English well into the first half of the 1900s.
Between the 1950s and 1980s there was a dramatic shift to English, which coincided with a time when a large number of Māori moved from the country to the cities. Consequently by the second half of the 20th century there was a sharp decline in the number of fluent speakers of Māori and the language had become seriously threatened (Benton Reference Benton1997). Since the mid-1980s there has been a strong revitalisation effort (Benton & Benton Reference Benton, Benton and Fishman2001, Harlow & Barbour Reference Harlow, Barbour, Vandenbussche, Jahr Håkon and Trudgill2013) leading to a growing number of first language (L1) speakers, all of whom are also fluent in English. However there was a break in the intergenerational transmission of Māori (Fishman Reference Fishman1991), leading to instances of L1 speakers learning Māori from their parents and teachers, who were themselves L2 speakers of the language. There are no longer any monolingual adult speakers of Māori in New Zealand.
The European colonisation and the break in transmission are both strong enough factors in themselves to cause fundamental changes to Māori. However in addition to this, the dominant language in New Zealand, New Zealand English (NZE), has itself been undergoing extensive sound changes.
A distinct NZE accent emerged around the late 1800s (McBurney Reference McBurney1887, Wall Reference Wall1939, Gordon Reference Gordon1998). From this time NZE has undergone substantial sound change: the front vowels kit, dress and trap /ɪ e æ/ are involved in a substantial chain shift, with dress and trap raising and kit retracting and falling (see e.g. Watson, Maclagan & Harrington Reference Watson, Maclagan and Harrington2000, Gordon et al. Reference Gordon, Campbell, Hay, Maclagan, Sudbury and Trudgill2004), goose /uː/ has fronted substantially (see e.g. Gordon et al. Reference Gordon, Campbell, Hay, Maclagan, Sudbury and Trudgill2004), nurse, lot and thought /ᴈː ɒ ɔː/ have risen (see e.g. Gordon et al. Reference Gordon, Campbell, Hay, Maclagan, Sudbury and Trudgill2004, Watson et al. Reference Watson, Maclagan, King and Harlow2008); the diphthongs near and square /ɪə/ and /eə/ have merged (see e.g. Watson, Harrington & Evans Reference Watson, Harrington and Evans1998, Gordon et al. Reference Gordon, Campbell, Hay, Maclagan, Sudbury and Trudgill2004), and the diphthongs face, price, mouth and goat /ei ai au ou/ have also shifted substantially (Maclagan, Gordon & Lewis Reference Maclagan, Gordon and Lewis1999, Gordon et al. Reference Gordon, Campbell, Hay, Maclagan, Sudbury and Trudgill2004). (The Keywords in Wells (Reference Wells1982: 127ff.) will be used throughout the paper to refer to the English vowels, to avoid confusion with the Māori vowels.)
Although Māori is spoken by relatively few speakers, the language is kept in the public awareness through radio and television, through both mainstream and special interest media. There is considerable lexical borrowing between the two languages (see Duval (Reference Duval1995) for Māori loan words from English, and Macalister (Reference Macalister2005) for NZE loan words from Māori). Words such as marae ‘meeting place’, whānau ‘family’, iwi ‘tribe’, hui ‘meeting’, pōwhiri (welcome ceremony), tangi (funeral ceremony) are used in the media without translation (Davies & Maclagan Reference Davies and Maclagan2006), and Māori words are included in New Zealand English curriculum vocabulary (see, for example the Action English series, Davis Reference Davis2009). Although there is often a call for the ‘correct’ Māori pronunciation of Māori words in English, once these words have become part of NZE, they usually acquire a NZE pronunciation. Pōwhiri, for example, is /poːfiri/ [p h oːfɪɾɪ] in Māori, but becomes /poʊfri/ [p hh oʊfɹi] in NZE.Footnote 2 Such borrowing of vocabulary is the most obvious influence from Māori to NZE although, as we will demonstrate, NZE has had considerably more effect on Māori.
1.2 The phonology of Māori
Māori segmental phonology is fairly simple and straightforward (Bauer Reference Bauer, Parker and Evans1993). There are ten consonants /p t k m n ŋ f r w h/. There are no voicing contrasts within the stop consonants, and in addition they were originally unaspirated (Bauer Reference Bauer, Parker and Evans1993: 530; Harlow Reference Harlow2007: 12; Maclagan & King Reference Maclagan and King2007). The Māori vowel system is usually described in terms of the five short vowels /i e a o u/ (see Bauer Reference Bauer, Parker and Evans1993).
Māori syllables have an optional onset consisting of a single consonant and a peak of up to three morae in length, thus taking the form (C)V(V(V)). This relatively simple structure is shared with many other Polynesian languages (Krupa Reference Krupa1982, Maclagan et al. Reference Maclagan, Watson, Harlow, King and Keegan2009). Syllable peaks may consist of one single short vowel, a sequence of two like short vowels, realised as a phonemically long vowel, or a diphthong. Monophthong length is phonemic in Māori, and minimal pairs exist for all five pairs of long vs. short monophthongs, but it is really only the distinction between /a/ and /aa/Footnote 3 that bears much functional load.
The arguments for regarding the long vowel phonologically as sequences of two like short vowels can be found in Bauer (Reference Bauer, Parker and Evans1993: 543–545). Similar arguments can be made for regarding the diphthongs as underlying sequences of short vowels; see, for instance, the partial reduplication of words like pai ‘good’ > papai ‘good (of plural noun)’, which is parallel to kino ‘bad’ > kikino ‘bad (of plural noun)’. Typically diphthongs at least within morphemes can be formed with any lower vowel followed by a higher vowel and also /oe/. Diphthongs occur variably across morpheme boundaries, where morphological processes such as reduplication or suffixation bring candidate vowels together, e.g. aroha-ina ‘love-passive’ is always pronounced with diphthongisation of the /a+i/.Footnote 4
There is some indication that the phonological analysis of diphthongs as sequences of unlike vowels has some psychological reality. Bauer (Reference Bauer1981: 35–36) reports the observation that native speakers of Māori, when asked to pronounce some words ‘slowly to facilitate spelling’, sometimes segment diphthongs, and sometimes not, e.g. waenganui ‘between’ is variously pronounced /wa.e.nga.nu.i/ and /wae.nga.nu.i/.
Long diphthongs are also found and consist of a sequence of any two like [–high] vowels, followed by a higher vowel, e.g. tēina ‘younger sibling, same sex as EGO, plural’, or the word Māori itself, though syllable peaks consisting of three like vowels phonologically are not overlong, but realised as an ordinary long vowel, e.g. ātaahua ‘beautiful’ = [aːtaːhua] from āta ‘gently, carefully’ + āhua ‘appearance, form’.
1.3 The MAONZE project
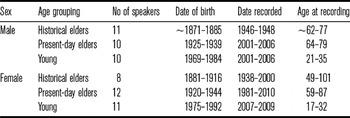
The aim of the MAONZE (Māori and New Zealand English) project is to analyse changes in the pronunciation of the Māori language over time and the relationship of these changes to NZE. This is being achieved by comparing present-day recordings of both elders and young adult speakers with archival materials of Māori born in the late 19th century and recorded, for the most part, in the mid-1940s. The male and female speakers from the database can be divided into three groups: historical elders (born mainly in the 1880s), present-day elders (born mainly in the mid-1930s) and young speakers (born mainly in the 1980s). The speaker details are listed in Table 1. In total, we have investigated the speech of 62 speakers, with roughly equal numbers in each speaker group and for each gender (see King et al. Reference King, Maclagan, Harlow, Keegan and Watson2010a, Reference King, Maclagan, Harlow, Keegan and Watson2011a, Reference King, Maclagan, Harlow, Keegan and Watsonb for more details). All speakers are bilingual in Māori and NZE, and the recordings in the MAONZE database reflect this (King et al. Reference King, Maclagan, Harlow, Keegan and Watson2011b). Data from all these speakers is included in the analyses presented here.
Details of the speakers in the MAONZE project.a

a The copyright for the Mobile Unit recordings is held by Sound Archives/Ngā Taonga Kōrero (http://www.soundarchives.co.nz) while the copyright for the television recordings is held by Television New Zealand Ltd.
1.4 Previous findings on sound change in Māori
To date the MAONZE project has identified a number of sound changes occurring in Māori. We have demonstrated a reduction in the distinction between the short and long vowels over time, in terms of both quality and quantity (Harlow et al. Reference Harlow, Keegan, King, Maclagan, Watson, Stanford and Preston2009, King et al. Reference King, Watson, Maclagan, Harlow, Keegan, Holmes and Marra2010b, Maclagan et al. Reference Maclagan, Harlow, King, Keegan, Watson, Elhindi and McGarry2013). With the exception of /aː/, the long vowels have shortened, and all the short vowels have become more peripheral. There have been substantial shifts in the vowel space including /e eː/ raising, and /u uː/ fronting. We have also demonstrated that there are diphthong mergers in progress for /au/ and /ou/ and for /ai/ and /ae/ (Harlow et al. Reference Harlow, Keegan, King, Maclagan, Watson, Stanford and Preston2009, Maclagan et al. Reference Maclagan, Harlow, King, Keegan, Watson, Elhindi and McGarry2013).
The fronting of /u uː/ was shown to be linked to the advent of aspiration in /t/ (Maclagan et al. Reference Maclagan, Watson, Harlow, King and Keegan2009). Early Māori, like other Polynesian languages, did not have aspiration, yet aspiration is well established in our young speakers (Maclagan & King Reference Maclagan and King2007, Maclagan et al. Reference Maclagan, Watson, Harlow, King and Keegan2009). Maclagan & King (Reference Maclagan and King2007) found that the duration of voice onset time for the voiceless stops /p t k/ increased over time from the historical elders to the young speakers, and argued that this led to an increase in perceived aspiration over time. This finding was confirmed with a larger cohort of speakers for /t/ in Maclagan et al. (Reference Maclagan, Watson, Harlow, King and Keegan2009). We note that sound changes involving increased aspiration have also been found in the two revitalised languages mentioned earlier: namely Scottish Gaelic (Nance & Smith Reference Nance and Stuart-Smith2013), and Lower Sorbian (Marti et al. Reference Marti, Andreeva and Barry2009). In addition, changes have been found in Māori with the tense marker ka, which traditionally had two allomorphs, with the longer variant being lost over time (Harlow et al. Reference Harlow, Bauer, Maclagan, Watson, Keegan and King2011).
Previous publications either did not use data from the full speaker set, or else did not statistically verify the changes noted. Harlow et al. (Reference Harlow, Keegan, King, Maclagan, Watson, Stanford and Preston2009), Maclagan et al. (Reference Maclagan, Watson, Harlow, King and Keegan2009), Maclagan & King (Reference Maclagan and King2007), Harlow et al. (Reference Harlow, Bauer, Maclagan, Watson, Keegan and King2011), and Watson et al. (Reference Watson, Maclagan, King and Harlow2008) used a subset of the male data. King et al. (Reference King, Watson, Maclagan, Harlow, Keegan, Holmes and Marra2010b) and Maclagan et al. (Reference Maclagan, Harlow, King, Keegan, Watson, Elhindi and McGarry2013) compared the data from the full speaker cohort, both male and female, but only trends were analysed and no statistics were reported. In fact only three published studies from the MAONZE project have used statistical analysis to support their empirical findings (Watson et al. Reference Watson, Maclagan, King and Harlow2008, Harlow et al. Reference Harlow, Keegan, King, Maclagan, Watson, Stanford and Preston2009, Maclagan et al. Reference Maclagan, Watson, Harlow, King and Keegan2009). In addition, there has only been a very limited comparison between the English and Māori vowels for the three speaker groups. In Maclagan et al. (Reference Maclagan, Watson, Harlow, King and Keegan2009), /u uː/ were compared to NZE goose, and Watson et al. (Reference Watson, Maclagan, King and Harlow2008) compared monophthongs from the male speakers acoustically in both languages. The focus of most of the previously published research has been on the monophthongs in Māori; there are only two published studies on the Māori diphthongs (Harlow et al. Reference Harlow, Keegan, King, Maclagan, Watson, Stanford and Preston2009, Maclagan et al. Reference Maclagan, Harlow, King, Keegan, Watson, Elhindi and McGarry2013) and no analysis at all has been carried out for the NZE diphthongs of these speakers. One aim of the present paper is to fill in some of these gaps.
1.5 The present study
The purpose of this study is to investigate the noted changes in the Māori monophthongs and diphthongs, and to analyse how these changes are related to changes in NZE. It will be a trend study of sound change, investigating changes via the data of three speaker groups born approximately 50 years apart (see Section 1.3). The historical elders (HE) were L1 Māori speakers; English was acquired through schooling, but there was still a great deal of Māori usage in everyday life. The present-day elders (PE) were also L1 Māori speakers; Māori was their home language, and as in the case of the HE, English was acquired at school. However from then on they had a high usage of English to the extent that it became their main language. The final group, the young (Y) were all heavily exposed to English from the start. The Y group was a combination of L2 speakers who acquired English first and Māori later; and L1 speakers, who at best had parallel acquisition, but in many cases, English was their home language, and Māori was mainly spoken at the immersion schools they attended. None of the parents of the young L1 speakers were L1 speakers of Māori, though their grandparents were, and the grandparents spoke Māori to the young L1 speakers.
We postulate that for the HE speakers there is unlikely to be influence of English on their Māori phonetics; for the PE there is little or none, though some individuals might show some influence. However for the Y group there will be a heavy influence.
2 Method
2.1 Participants and materials
As mentioned earlier our data comprise three speaker groups: historical elders (HE), present-day elders (PE), and young adults (Y). The details about our speakers are given in Table 1; more details can be found in King et al. (Reference King, Maclagan, Harlow, Keegan and Watson2010a, Reference King, Maclagan, Harlow, Keegan and Watson2011b). The recordings for the historical elders and four of the present-day female elders were sourced from radio and TV broadcasts. Most of the recordings for the present-day elders and young speakers were obtained from interviews by members of MAONZE project between 2001 and 2010. We recorded hour-long interviews in both English and Māori. For two of the present-day female elders we only have Māori data.Footnote 5
For the historical elders, there is not always a correspondence between the speakers for whom we have English recordings and those for whom we have Māori recordings. There are five historical female elders for whom we have recordings of both their Māori and English, but there are two speakers for whom we only have Māori, and one other for whom we only have English. With regards to the male historical elders there are five speakers for whom we only have Māori recordings.
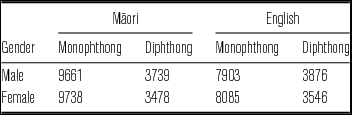
In this study we looked at the five short-long monophthong pairs of Māori, plus the five most common diphthongs /au ou ae ai ao/.Footnote 6 We also looked at the eleven NZE monophthongs, fleece, kit, dress, trap, start, strut, lot, thought, foot, goose, and nurse, and the five closing diphthongs, face, price, mouth, goat, and choice.Footnote 7 All vowels were selected from stressed words and were taken from spontaneous connected speech. For each vowel the aim was to analyse 30 tokens per speaker, with no more than five tokens from any one word. Owing to the uneven nature of vowel distribution in English and in Māori, the target of 30 tokens per vowel per speaker was not always achieved. For example /uː/, /iː/, goose and fleece tokens in particular could be hard to find. Nearly 50,000 vowel tokens were analysed in this study; the breakdown according to gender and language and the numbers of monophthongs or diphthongs is given in Table 2.
The number of English and Māori tokens analysed.

All labelling and formant measurement was done in PRAAT (version 4.125 or later, see Boersma & Weenink Reference Boersma and Weenink2009). Formants were calculated using the default Praat settings (25 ms analysis frame, gaussian window, 10 pole LPC filter). The formant positions were visually checked and corrections made to the analysis parameters as necessary. For each vowel token, the start and end were marked. For each monophthong, the vowel target was identified and the first three formant values at that point were recorded; for diphthongs, the first three formant values were recorded at both the first and second targets. Measurements were taken during the steady state portion of the vowel. If there was no steady state, formant readings were taken at the F2 maximum (and F1 minimum) for front vowels, the F1 maximum (and F2 minimum) for central vowels and the F2 minimum (and F1 minimum) for back vowels. For more details see Harlow et al. (Reference Harlow, Keegan, King, Maclagan, Watson, Stanford and Preston2009) and King et al. (Reference King, Maclagan, Harlow, Keegan and Watson2011b).
2.2 Data analysis
For this study we looked at vowel spaces calculated from the first and second formants (F1 and F2). To investigate vowel movement we looked at changes to F1 and F2, as well as applying a vowel space position measure based on Euclidean distances. The latter is a measure we developed for this study and is described in detail in Section 3.1.2. All analysis, including the statistics, was done in R (R Core Team 2011). For the statistical analysis all formant values were transformed using the perceptually motivated Bark scale (Traunmüller Reference Traunmüller1990). The basic analyses have already been published (see e.g. Harlow et al. Reference Harlow, Keegan, King, Maclagan, Watson, Stanford and Preston2009, King et al. Reference King, Maclagan, Harlow, Keegan and Watson2011a, Maclagan et al. Reference Maclagan, Harlow, King, Keegan, Watson, Elhindi and McGarry2013) and are not repeated in full here.
This paper will present the vowel spaces of two languages, Māori and NZE. For the sake of clarity and readability in the text all NZE vowels will be referred to according to Wells’ (Reference Wells1982) Keywords system, as mentioned earlier. Phonetic realisations of the vowels of all three speaker groups in both languages are shown in Tables A1 and A2 in the appendix. The choice of English vowels to compare with the Māori vowels is determined by the realisation of the various vowels in NZE. For example, although it may seem appropriate to compare Māori /iː/ and /i/ with fleece and kit, in NZE kit is lowered and retracted and is not realised at all like Māori /i/. Fleece is the appropriate NZE vowel to compare with both Māori /iː/ and /i/, just as dress is the appropriate comparison for both /eː/ and/e/.
3 Results
The data for this study were the Bark-scaled values of the first and second formants at the vowel targets.Footnote 8 For each set of vowels studied (e.g. the Māori monophthongs, or the Māori diphthongs) we first present the vowel centroids plotted on F1/F2 plots, we then give a descriptive account of the vowel spaces, and finally we present the statistics. For each formant a repeated measures ANOVA was calculated with vowels being the within-subject factor, and the three speaker groups were the between-subject factors. Sphericity of within-subject factors was assessed with the Mauchly's Sphericity test and when it was violated Greenhouse–Geisser adjustments were made with the adjusted p-value indicated as pGG .Footnote 9 Separate ANOVAs were performed for the monophthongs and diphthongs for both languages and the male and female data were treated separately. If there were significant speaker group–vowel interactions we looked for significant differences using the formant values and/or significant differences between the newly proposed vowel space position measures, which are based on the formant values (see Section 3.1.2). In both cases we used t-tests to identify the significant differences and Bonferroni corrections were always made for multiple testing.
The ANOVAs were always significant for within-subject factors, i.e. the vowels were always significantly different from each other in the formant values. For the most part this is to be expected and will not be dwelt on; however in the instances where we are investigating potential vowel mergers we will present the results of the post-hoc analysis. Typically there was no significant difference for the speaker groups. There was often, however, a significant vowel group interaction and these will be presented in the relevant sections below. Where relevant, we have drawn attention to gender differences, but a fuller analysis of these differences is planned for a subsequent paper.
3.1 Monophthongs
3.1.1 Formant analysis of monophthongs in Māori
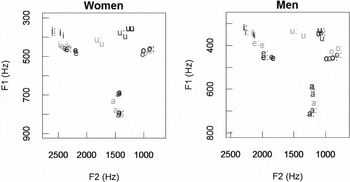
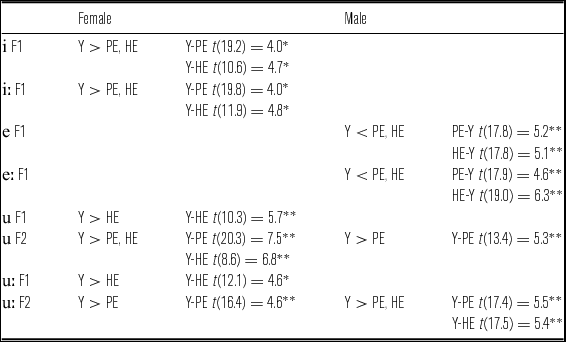
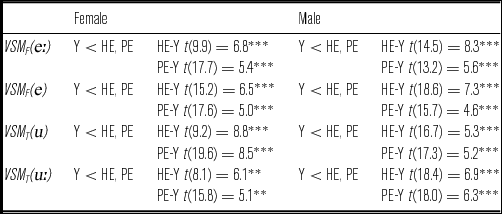
The F1/F2 vowel spaces for the three speaker groups and for female and male speakers can be seen overlaid in Figure 1. Only the vowel centroids are plotted. Overall it can be seen that the shapes of the vowel spaces for all speaker groups, regardless of gender, are essentially triangular, with the point vowels being /iː aː oː/. There is also no noticeable difference in the overall extent of the vowel spaces between the three groups, for either gender, with the exception of the high vowels /i iː u uː/ for the young female speakers. These speakers’ high vowels are noticeably lower in the F1/F2 vowel space than the vowels of either of the elder groups. However this lowering is unlikely to be a sound change. Nor do we believe it an effect of age, as we would expect to see an increase for all F1 values if it were (Torre & Barlow Reference Torre III and Barlow2009, Reubold, Harrington & Kleber Reference Reubold, Harrington and Kleber2010). We can see no motivation for a lowering of /iː i/ and /uː u/, but since these speakers’ English fleece and goose vowels are also lower than those of the historical and present-day elders (see Figure 4), we consider that it is most likely to be a speaker effect.Footnote 10 This is further supported by the ANOVA which shows that, although there are significant differences between the vowels, there are no significant group effects for the women. However for the male speakers there were group effects (F(2,28) = 7.0, p < .01) with the F2 for the present-day elders being significantly lower (and the vowels farther back) than those for the young speakers (t(17.5) = –3.1, p < .05). There are also significant age by vowel interactions for all the data (female F1: F(7.5,101.3) = 7.0, pGG < .001; female F2: F(6.4,86.5) = 9.2, pGG < .001, male F1: F(7.3,102) = 5.7, pGG < .001; male F2: F(6.5,91.6) = 11.7, pGG < .001). The significant vowel movements identified from Bonferroni corrected t-tests are given in Table 3. For the male speakers the significant movements were the F1 of /e eː/ being significantly lower, and therefore the vowels phonetically more raised, for the Y speakers than the two elder groups and the F2 of /u uː/ being significantly higher, and therefore the vowels being fronter, for Y than PE. The F2 of /uː/ is also significantly higher for Y than HE. The fronting of /u uː/ over time was also significant for the female speakers, with the F2 of /u uː/ being significantly higher and the vowels again being fronter for the younger speakers than the present-day elders, F2 was also significantly higher for /u/ for Y compared to the historical elders. However there was no significant phonetic raising of /e eː/. Instead, for the women speakers, F1 for /i iː u uː/ was significantly higher (and the vowels lower) for the younger speakers than for the historical and the present-day elders.
The centroids of the Māori monophthongs in F1/F2 space for the historical elders (black), present-day elders (dark grey), youth (light grey) for female (left) and male (right) speakers.

The values of the significant t-tests for the formants for Māori monophthongs for the female and male speakers.

*p ≤ .05, **p ≤ .01, ***p < .001
3.1.2 Distance measure analysis
The post-hoc analysis of the formant results indicated that a new method for measuring sound change was required. From Figure 1 we saw that the most obvious change over time was the fronting of the /u uː/ pair for both the female and male speakers. There was also a raising of the /e eː/ pair. This can clearly be seen for the male speakers, but it is also present for the female speakers, taking into account the change in the relative distance between /e eː/ and /iː/ over time. Post-hoc t-tests on the formant values revealed that there was a significant increase in F2 of /u uː/ over time for both genders. On the other hand, it was difficult to establish the extent of the front vowel raising over time, as the lowered /i iː/ and /u uː/ for the young female speakers created a problem when we were trying to establish the statistical significance of the vowel movements by using the traditional approach of analysing the first and second formant values of the vowels (e.g. Watson et al. Reference Watson, Maclagan and Harrington2000, Harlow et al. Reference Harlow, Keegan, King, Maclagan, Watson, Stanford and Preston2009). In comparison to the male speakers, the movement of /e eː/ was not significant for the female speakers, even though it was quite clear that a change had taken place over time as shown by the relative distances between /e eː/ and /iː/ in Figure 1. This led us to reflect on the efficacy of the entire approach of considering only the first and second formant values when looking at sound change in vowels. Visual comparisons of F1/F2 plots always involve taking the entire two dimensional vowel space into account when the extent of the vowel movements are considered, and we attempted to replicate this in the vowel space movement measure we adopted.
The vowel movements we have been looking at involve shifts of vowels either rising up the front edge of the vowel space, or moving along the top edge of the vowel space. Although these movements are primarily in F1 and F2 respectively (see Stevens Reference Stevens1998), there is always a noticeable movement on the other axis, particularly for the rising front vowels. Statistical analysis on the separate F1 and F2 measures is problematic, as vowel movements are never strictly in one dimension or the other, nor are F1 and F2 really independent. In terms of articulation there is rarely only one articulator that moves as a speaker goes from one vowel to the next. For example the raising of a front vowel involves changes to both the jaw opening and the tongue position, and both F1 and F2 are affected by these moves. Therefore to measure vowel movement, we decided to use Euclidean distance measures, which incorporate both F1 and F2 movements.Footnote 11
In an F1 vs. F2 vowel space, when the first and second formants for vowel x are (xF1,xF2), and for vowel y are (yF1,yF2), then the Euclidean distance (EU (x, y)) between vowel x and y is calculated by the formula in (1):
-
(1)
 $EU( {x,\!y}) = \sqrt {{{( {{x_{F1}} - {y_{F1}}})}^2} + {{( {{x_{F2}} - {y_{F2}}})}^2}} $

Due to the nonlinearity of the frequency scale, the range of frequencies for F2 is always considerably larger than that for F1. This means that the Euclidean distances calculated from raw F1 and F2 values would place more emphasis on F2 differences than F1 differences, on account of the larger frequency range in Hertz for F2. This is often addressed visually in vowel space plots, as although the plots are usually square in shape, the frequency range for F1 is typically only a third of the range used for F2 (see, for example, Figure 1 above). A better way is to explicitly account for how the signal is auditorily processed and use the perceptually motivated Bark scale (Traunmüller Reference Traunmüller1990) for the formant frequency values. This then counters the undue influence of F2 and ensures that F1 and F2 values have comparable impacts on the Euclidean distances. Calculating Euclidean distances from Bark-scaled formant values is a reasonably common approach (e.g. Harrington Reference Harrington2006, Löfqvist, Sahlén & Ibertsson Reference Löfqvist, Sahlén and Ibertsson2010, Neumeyer, Harrington & Draxler Reference Neumeyer, Harrington and Draxler2010).
Euclidean distances of formants are being used increasingly to measure the size of the vowel space (e.g. Ng, Chen & Sadaka Reference Ng, Chen and Sadaka2008, Löfqvist et al. Reference Löfqvist, Sahlén and Ibertsson2010, Neumeyer et al. Reference Neumeyer, Harrington and Draxler2010, Kaipa et al. Reference Kaipa, Robb, O'Beirne and Allison2012, Sasisekaran & Munson Reference Sasisekaran and Munson2012). However we wish to measure the extent of a vowel movement relative to a vowel space, not the actual vowel space itself. Harrington, Kleber & Reboul (Reference Harrington, Kleber and Reubold2008) use Euclidean distances to measure the fronting of /u/ over time, comparing the distances of /u/ to the point vowels /i/ and /a/ in order to determine how these change over time. This gives a good sense of vowel movement within a vowel space, and we will use a similar process. Although since we wish to measure the movement of more than one vowel, we take a slightly different approach.
Boë et al. (Reference Boë, Perrier, Guérin and Schwartz1989) proposed a maximal F1/F2 vowel space based on known articulatory constraints. Clearly any vowel shifts must occur within this space. In fact vowel shifts would be expected to occur within the vowel space of a particular language, and a vowel shift is described in terms of how the vowel position has changed over time relative to the entire vowel space, or more typically a side of the vowel space. It would be possible to use the model proposed by Boë et al. (Reference Boë, Perrier, Guérin and Schwartz1989) and calculate the extent of the vowel space in the F1/F2 plane for a given language. However a simpler approach is to define the vowel space by its point vowels, and calculate the Euclidean distance between the point vowels. This approach was also adopted by Kaipa et al. (Reference Kaipa, Robb, O'Beirne and Allison2012), although there they were investigating the speaker's recovery of a full vowel space after a glossectomy.
The Māori vowel space is essentially triangular, with the point vowels being /iː aː oː/. We propose to use the sides of the vowel space triangle as reference points to capture the formant movement.Footnote 12 The choice of which side to use depends on the direction of the movement to be measured. For Māori there is no evidence that /aː/ or /oː/ have changed over time in this study, nor has /iː/ for the male speakers (see Table 3). In all these cases none of the post-hoc t-tests between groups were significant.Footnote 13 However the young female group do have /i iː/ and /u uː/ significantly lower in the vowel space than the elder groups even though their /oː/ is similar to the elders’ /oː/. As already noted, we consider that this is most likely to be an unexplained speaker effect rather than a sound change.
To calculate the vowel space movement (VSM) measures, we select the vowel to be investigated, x, identify the reference point vowel, y, and the reference side of the vowel triangle in F1/F2 space. The reference side of the vowel triangle goes between the reference point vowel y and another point vowel z. For each speaker we calculate the centroids of the three vowels (the two point vowels related to the reference side of the vowel triangle, and the vowel to be investigated). We then obtain the Euclidean distance between the reference point vowel and the vowel of interest, EU(y,x), and the Euclidean distance of the reference side of the vowel triangle, EU(y,z). The Euclidean distances are calculated from the first and second formants given in the Bark scale. Finally we take the ratio of the two Euclidean distances, thus yielding a VSM measure in (2)
-
(2) Equation 1
$VSM = \frac{{EU( {y\hbox{\scriptsize\it,}x})}}{{EU( {y\hbox{\scriptsize\it,}z})}}$

Part (a) of Figure 2 illustrates the distances used to calculate a single VSM for a vowel in the front part of the vowel space that is involved in a fronting and raising movement. This VSM is calculated by:
-
(3) Equation 2
$VSM_F(x) = \frac{{EU( {i\itscriptlengthmark \hbox{\scriptsize\it,}x})}}{{EU( {i\itscriptlengthmark \hbox{\scriptsize\it,}a\itscriptlengthmark})}}$
where VSMF(x) is the vowel space measure for vowel x, with respect to the front side of the vowel triangle (i.e. the distance between the point vowels /iː/ and /aː/), the subscript F indicates the front of the vowel triangle, and /iː/ is the reference point vowel, y

Part (b) of Figure 2 illustrates the distances used to calculate a single VSM for a high vowel involved in a fronting movement. This VSM is calculated by:
-
(4) Equation 3
$VSM_T(x) = \frac{{EU( {i\itscriptlengthmark\hbox{\scriptsize\it,}x})}}{{EU( {i\itscriptlengthmark\hbox{\scriptsize\it,}o\itscriptlengthmark})}}$
where VSMT(x) is the vowel space measure for x, with respect to the top side of the vowel triangle (indicated by the subscript T) which is between point vowels /iː/ to /oː/, and the reference point vowel is /iː/

The final plot in part (c) of Figure 2 illustrates the distances used to calculate a VSM for a back vowel that is involved in a vowel shift; this VSM is calculated by
-
(5) Equation 4
$VSM_B(x) = \frac{{EU( {o\itscriptlengthmark\hbox{\scriptsize\it,}x})}}{{EU( {o\itscriptlengthmark\hbox{\scriptsize\it,}a\itscriptlengthmark})}}$
where VSMB(x) is the vowel space measure for x, with respect to the back of the vowel triangle (indicated by subscript B) which is between the point vowels /oː/ and /aː/, and the reference point vowel is /aː/

The distances used to calculate a VSM in the (a) front (b) top and (c) back parts of the vowel space, as defined by the point vowels

To measure the extent of front vowel raising in Māori (i.e. the /e eː/ movement) the reference is the side of the triangle between the high front vowel and the low central vowel, that is the distance between /iː/ and /aː/, and we would calculate VSMF(e) and VSMF(eː) as per equation 2 (in (3) above) for each speaker. We then determined whether there were significant differences in the VSM for the three speaker groups (HE, PE, and Y). To measure the fronting of the high vowels in Māori (i.e. the /u uː/ movement), we calculated a similar ratio, but used as a reference distance the side of the vowel triangle between the high back vowel and the high front vowel, that is the distance between /iː/ and /oː/. We then calculated VSMT(u) and VSMT(uː) as per equation 3 for each speaker, and then investigated the overall speaker group differences as for /e eː/. The smaller the VSM value, the closer the vowel of interest (vowel x) is to the reference point vowel y, which is /iː/ for both the raising and fronting.
The VSM has the further advantage that it provides a method of speaker normalising vowel data based on each speaker's own vowel space. Firstly, using a perceptually based frequency scale has been shown to remove a certain amount of non-speaker-specific information from the signal (Bladon & Lindblom Reference Bladon and Lindblom1981). Secondly, by representing a vowel position as a relative measure made in comparison to an appropriate side of the vowel space, the VSM has the effect of speaker normalising the data.
3.1.3 Measures of vowel movement in Māori monophthongs
As discussed in the previous two sections, the vowels that showed most movement in the F1/F2 plots were /e eː/, and /u uː/, and it is those that we focus on in this section.
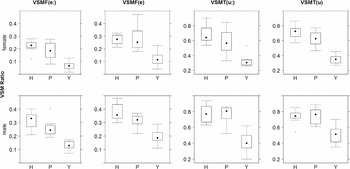
The vowel space movement (VSM) measures for these vowels are shown in box plots in Figure 3. The data for the female speakers are presented on the top and those for the male speakers are on the bottom. The far left plots are for the /eː/ analysis, and the centre left plots are for the /e/ analysis. To ensure the plots are clearly understood we will discuss in detail the top far left plot which shows the median VSMF(eː) for the female speakers.
VSMF(eː) (far left), VSMF(e) (centre left), VSMT(uː) (centre right), and VSMT(u) (far right) in Māori for the three speaker groups, for the female speakers (top) and male speakers (bottom), where H = historical elders, P = present-day elders, Y = young group, and the y-axis shows the VSM ratios. The dots in the centres of the boxes represent the median VSM values, the boxes enclose from the upper to the lower quartiles and the whiskers represent the 95th and 5th percentiles.

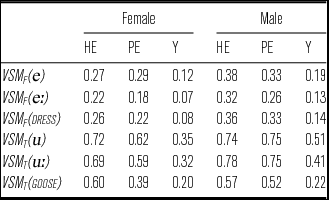
The median for the historical elders is 0.227. Thus the Euclidean distance for /iː/ and /eː/ is 22.7% of the Euclidean distance between /iː/ and /aː/. The smaller the VSMF value is, the closer the vowel of interest (/eː/ in this case) is to /iː/. The median VSMF(eː) for the present-day elders is 0.185, which means the Euclidean distance between /iː eː/ is 18.5% of the Euclidean distance between /iː/ and /aː/. Therefore /eː/ is closer to /iː/ in the vowel space for the present-day elders, than for historical elders. This can also be clearly seen in the formant plots in Figure 1. The VSMF(eː) for the young speakers is 0.065, which means the Euclidean distance between /iː eː/ is only 6.5% of the distance between /iː/ and /aː/: that is, for the young speakers, /eː/ is closer to /iː/ than for both the present-day elders and the historical elders. In summary the smaller the VSMF(eː), the closer the vowel is to /iː/, i.e. the more it is raised and fronted.
It can be seen quite clearly in Figure 3 that the young speakers, regardless of gender, always have the lowest median VSM. That is, both / e / and /eː/ are closer to /iː/ for the younger speakers, compared to both elder groups. The VSM differences between the young and elder groups are all significant according to Bonferroni corrected t-tests (see Table 4). Although there is a trend for the median VSMF of the historical elders all to be greater than those of the present-day elders, the differences are never significant. Overall it can therefore be seen that the raising of both /e eː/ over time in Māori for both female and male speakers, as observed in Figure 1, is significant.
The values of the significant t-tests for VSMF(eː), VSMF(e), VSMT(u), and VSMT(uː).

*p ≤ .05, **p ≤ .01, ***p < .001
The fronting of /u uː/ can clearly be seen in the boxplots of the VSMT , which are in the centre right and far right in Figure 3 (and observed in Figure 1). VSM differences between the young and elder groups are also significant for this vowel pair (see Table 4). Recall in this analysis the top of the vowel triangle was the reference side of the vowel space, and /iː/ remained the reference point vowel, that is we calculated VSMT(x) using equation 3. The historical elders’ median VSMs for /u uː/ were between 0.64 and 0.78, whereas the median values for the young speakers were between 0.3 and 0.51. Consequently /u uː/ tokens for the younger speakers are considerably closer to the reference point vowel /iː/ than those from the elder speakers.
3.1.4 New Zealand English monophthongs
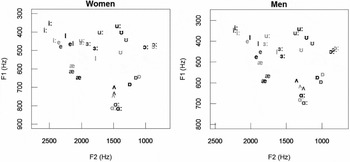
The NZE F1/F2 vowel spaces for the three speaker groups for both genders can be seen in Figure 4. The distribution of the vowels is similar to those of other NZE speakers of a comparable age (e.g. Gordon et al. Reference Gordon, Campbell, Hay, Maclagan, Sudbury and Trudgill2004, Watson et al. Reference Watson, Maclagan and Harrington2000). There was a significant interaction for vowel and group (female F1: F(9.4,113.3) = 12.8, pGG < .001; female F2: F(6.2,74.3) = 9.7, pGG < .001, male F1: F(7.9,86.5) = 9.7, pGG < .001; male F2: F(9.5,104.5) = 12.2, pGG = 0). Also, as for the Māori vowels, there were speaker group effects for the F2 of the male speakers (F(2,22) = 5.2, p < .01), with the present-day elders having a significantly lower F2 (and phonetically farther back vowel) than both the young (t(15.1) = –2.9, p < .05) and the historical elders (t(12.2) = –2.9, p < .05).
Centroids for the NZE vowels of the three different speaker groups: historical elders (black), present-day elders (dark grey), and youth (light grey) for female and male speakers.

From Figure 4 it can be seen that, for both the genders over time, the trap and dress vowels are raising, the kit vowel is retracting and lowering, and the goose vowel is fronting. Trap raises from [
 ] to [ɛ] for the men and from [
] to [
 ] for the women, dress raises from [ɛ] to [e] for the men and from [
 ] to [e] for the women, kit moves from [ɪ] to [
 ] for the men and from [ɪ] to [
 ] for the women and goose moves from [
 ] to [
 ] for the men and from [
] to [
] for the women.
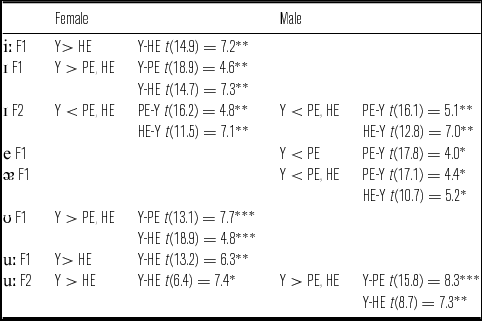
Post-hoc t-tests calculated from F1 and F2 (see Table 5) show these movements are all significant for the male speakers, and the kit and goose movements are significant for the female speakers. These are all well-known changes in NZE (e.g. Watson et al. Reference Watson, Maclagan and Harrington2000, Gordon et al. Reference Gordon, Campbell, Hay, Maclagan, Sudbury and Trudgill2004). However as with the Māori vowel space, the high vowels fleece and goose have considerably higher F1 values for the young female speakers than for either of the female elder groups, so that fleece is closer to start for the young females than for the older speakers. This reduced vowel height difference may give the visual impression that dress and trap have hardly risen for the young female speakers. Because fleece and dress are so close together for the young female speakers in Figure 4, we checked the tokens auditorily to see whether dress could now be confused with fleece but they were still clearly distinct.
The values of the significant t-tests for the formants for New Zealand English monophthongs for the female and male speakers.

*p ≤ .05, **p ≤ .01, ***p < .001
The NZE vowel movements that potentially have some link with vowel movements in Māori are those involving dress, trap, and goose. These three NZE vowels have moved over time in a similar manner to the Māori vowels which are in a similar position in the F1/F2 vowel space. In contrast, while the NZE kit vowel was in a similar position to the Māori /i/ for the historical elders, its path after that point has diverged markedly. There has been considerable movement in the NZE kit vowel over time (retracting and lowering in F1/F2 space); in comparison, /i/ in Māori has not changed its position relative to /iː/ at all (see Figure 1 and Gordon et al. Reference Gordon, Campbell, Hay, Maclagan, Sudbury and Trudgill2004).
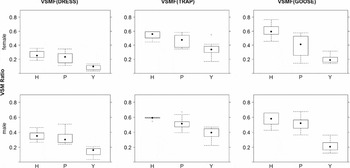
Therefore we will focus our attention on the movements of dress, trap, and goose using the VSM to analyse the extent of the movement (see Section 3.1.2). As the NZE vowel spaces are also triangular, we use an approach similar to the one used to measure Māori vowel movement. Post-hoc t-tests on F1 and F2 indicated that the point vowels start and thought have not changed over time for both men and women, and nor has fleece for the male speakers. Fleece has a significantly higher F1 for the young women compared to the female historical elders (see the comments just above). To measure front vowel raising (i.e. to calculate VSMF( dress ) for dress and VSMF( trap ) for trap) we adapted equation 2. We took the reference as the front side of the vowel space, and calculated the Euclidean distance between the point vowels fleece and start (with fleece being the reference point vowel y). The results of this analysis are shown in Figure 5, and the t-test results are presented in Table 6. The left most plot in Figure 5 is for the VSMF( dress ) for the female (top row) and male (bottom row). Once again the youngest speakers have a lower VSMF( dress ), compared to the two elder groups, which indicates that dress is closer to fleece for the young speakers than for the two elder groups, and these differences are significant (see Table 6). The two middle plots similarly show the VSMF( trap ). The Y groups’ trap vowels are also significantly closer to fleece than for the two elder groups’ vowels (see Table 6). A consistent difference between the two elder groups can be observed in Figure 5, with the historical elder medians always greater than those for the present-day elders, however these differences are not significant except for goose for the female speakers (see Table 6).
VSM F ( dress ) (left), VSMF( trap ) (middle), and VSMT( goose ) (right) for female (top) and male (bottom) speakers, where H = historical elders, P = present-day elders, Y = young group, and the y-axis shows the VSM ratios. The dots in the centres of the boxes represent the median VSM values, the boxes enclose from the upper to the lower quartiles and the whiskers represent the 95th and 5th percentiles.

The values of the significant t-tests for VSMF( dress ) , VSMF( trap ) and VSMT( goose ).

*p ≤ .05, **p ≤ .01, ***p < .001
It is interesting to observe in Figure 5 that the median VSMF( dress ) for the male HE is 0.36 and the median VSMF( trap ) for the male Y group is 0.38. These values are very similar, and suggest the two vowels may occupy a similar position in the F1/F2 vowel space. It can be seen in Figure 4 that this is the case, with the centroid for the younger male speakers’ trap vowels in a very similar space to the centroid of older male speakers’ dress vowels. This emphasises the considerable extent of the trap raising in NZE with dress having raised similarly. A parallel pattern can be observed in the female data. However, because the female HE had raised dress relatively more than the male HE had, the young females’ trap vowels do not overlap with the female historical elders’ dress vowels.
The goose movement measures, VSMT( goose ), were calculated using the VSM adapted from equation 3 in Section 3.1.2, but as the movement of goose is along the top of the vowel space the reference distance was taken to be between fleece and thought, with fleece remaining the reference point vowel. As is apparent in both Figures 4 and 5 NZE goose has fronted considerably. The median VSMT( goose ) values for the historical elders are around 0.59, whereas for the young speakers they are around 0.20 (see Figure 5) and this difference is significant (see Table 6), as is the difference between the young speakers and the present-day elders. There is also a trend for the historical elders to have a backer goose than the present-day elders, but this is only significant for the female speakers.
3.1.5 Correlations between monophthong movements in Māori and NZE
There were substantial movements over time for both the Māori /e eː/ and the NZE dress and trap, which occupy a similar place in the vowel spaces for the respective speaker groups. The same observation can be made for /u uː/ in Māori and goose in NZE. It would therefore be of interest to see whether there are any correlations among these movements.
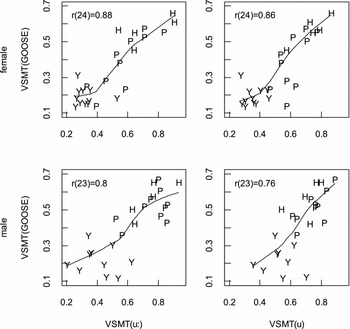
A Pearson's product–moment correlation analysis on the VSM T values showed the Māori /uː/ and /u/ movements over time are highly correlated with the NZE goose fronting (female /uː/ r(24) = 0.88, /u/ r(24) = 0.86; male /uː/ r(23) = 0.8, /u/ r(23) = 0.76). All these correlations are highly significant, with p < .001. Figure 6 plots the VSMT(uː) and VSMT(u) for each speaker against their VSMT( goose ). In the plots, each point represents a single speaker, with the label being the speaker group they belong to. It can clearly be seen that the young speakers (Y) are all clustered in the bottom left of the plots. The historical elders (H on the plots) tend to be in the top right section of the graphs, although a notable number of present-day elders (P on the plots) are also in this section. However from the plots it can be seen that as the VSMT( goose ) or VSMT(uː) and VSMT(u) increase, (i.e. goose, /uː/, /u/ and are produced as more back vowels), the speakers change from the young group to the elder groups.
The correlations of the NZE goose movement with the Māori /uː/ and /u/ using the VSM, female data on the top row, male data on the bottom row (p < .001 in all cases), where Y = young speakers, P = present-day elders, and H = historical elders.

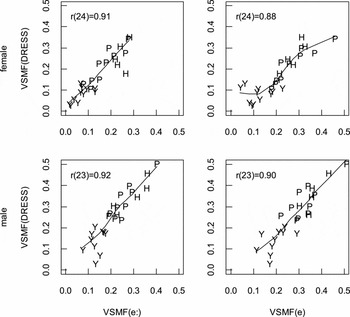
Similarly, the movements (measured with the VSM F values) of the Māori /eː/ and /e/ are highly correlated with the NZE dress (male /eː/ r(23) = 0.92, /e/ r(23) = 0.90, female /eː/ r(24) = 0.91, /e/ r(24) = 0.88). The Māori /eː/ and /e/ are also highly correlated with NZE trap (male /eː/ r(23) = 0.83, /e/ r(23) = 0.78); female /eː/ r(23) = 0.83, /e/ r(23) = 0.78), although the correlation is somewhat lower.Footnote 14 Again all these correlations are highly significant, with p < .001. The correlations of the Māori /eː/ and /e/ data with NZE dress are plotted in Figure 7. As with the /uː/ data, there is a noticeable clustering of the young speakers in the lower left sections of the plots. However both the elder groups are more mixed together compared to the /uː/ data. Nonetheless, as the VSMF(eː) or VSMF(e) and VSMF( dress ) increase (that is as dress becomes more open) the speakers change from the Y group to the elder groups. The correlations plots for trap look very similar to those for dress and will not be plotted.
The correlations of the NZE /e/ dress movement with the Māori /eː/ (left) and /e/ (right) using the VSM, female data on the top row, male data on the bottom row (p < .001 in all cases), where Y = young speakers, P = present-day elders, and H = historical elders.

3.1.6 Monophthong discussion
In this study we showed that the raising of /e, eː/ and fronting /u, uː/ over time is significant as was found in Harlow et al. (Reference Harlow, Keegan, King, Maclagan, Watson, Stanford and Preston2009), which analysed a subset of twenty of the male speakers analysed in the present study. However the extent of the movement shown here is less; the difference here is only between the young and the two elder groups combined. There was no significant difference between the elder groups, although there were usually (non-significant) trends suggesting that sound changes were already occurring between the historical and present-day elders. The less dramatic nature of the significant movements between this study and Harlow et al. (Reference Harlow, Keegan, King, Maclagan, Watson, Stanford and Preston2009) probably arose because the present study uses more stringent statistical tests. The larger speaker cohort in this study may also have played a part, with the larger data set used in the present calculations being more reliable. It is of note that the female and male speakers behave in fairly similar ways.
The significant movements in the analysis of the NZE data again agree with earlier studies that showed that dress and trap were raising, and goose was fronting (see e.g. Watson et al. Reference Watson, Maclagan and Harrington2000, Reference Watson, Maclagan, King and Harlow2008; Gordon et al. Reference Gordon, Campbell, Hay, Maclagan, Sudbury and Trudgill2004). The movement of kit was also revealed to be significant (see Figure 4) in the post-hoc t-test on the formant values. But since in this present study we are interested in vowels that may have influenced the movement of the Māori vowels, and the movement of kit over time is in the reverse direction to the movement of Māori /iː/ and /i/, no VSM values were calculated for kit.
The VSM analysis yielded results similar to the more traditional analysis carried out on the formant values alone. However it enabled us to compare the relative movements of the vowels in the vowel spaces between the speaker groups more easily, and exposed effects that could not be seen with formant analysis. For example, the VSM showed that the raising over time for the females for dress and for /e eː/ in their respective vowel spaces was significant, whereas the formant analysis did not. It was also very informative in the correlation analysis. It is possible to do a correlation analysis on the formant values, but for the raising of /e eː/ separate analyses would need to be done for F1 and F2 whereas the VSM reduced that information down to one measure.
This study has shown that the movements of Māori /e eː/ are highly correlated with the movements of the NZE dress and trap, as are the movements of the Māori /u uː/ with those of NZE goose. The latter result confirms earlier findings in Maclagan et al. (Reference Maclagan, Watson, Harlow, King and Keegan2009). This all strongly suggests that Māori has been influenced by the more dominant and prevalent NZE with the two major sound changes in the Māori monophthongs being linked to NZE influences.
3.2 Diphthongs
There is anecdotal evidence in the Māori community that there are two vowel mergers among the spoken Māori diphthongs: /ae/ is merging with /ai/, and /au/ is merging with /ou/. For the latter merger, there are occasional spellings in published works that provide further evidence for a merger, e.g. the word for ‘mouse’ which is usually spelt mauhi spelt mouhi, presumably by a speaker for whom the two diphthongs are merged.Footnote 15 When we listen to the speech of the historical elders both pairs of diphthongs are clearly distinct; these distinctions are no longer audible for the young speakers. The target that distinguishes /ae/ and /ai/ is the second target, whereas it is the first target that distinguishes /au/ and /ou/. It is therefore relevant to ask whether the raising of the monophthongs /e eː/ impacts on the diphthong pair /ai/ and /ae/, and whether the fronting of /u uː/ has any impact on the merger of the diphthongs /au/ and /ou/, albeit indirectly since it is the first targets, not the second, that have merged. There is also the question of whether these mergers are influenced by the monophthongs and diphthongs in NZE, and the numerous vowel changes that are occurring in that variety of English. In this section we look at /ae ai au ou ao/, the five most common diphthongs in Māori, to ascertain what changes are happening to them, and seek to quantify the impact of both the movements in the Māori monophthongs and the NZE vowels on these changes.
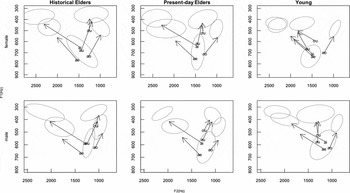
Figure 8 plots the centroids of the first and second vowel targets of /ae ai au ou ao/ for the three speaker groups. The three top plots are from the female data, and the three bottom plots are from the male data. The phonetic symbol for each diphthong is placed on the centroid of the first target, and a line is drawn from this centroid to the second target centroid. To give the diphthongs some context in the vowel spaces, the ellipses of the five short monophthongs are also plotted.
Centroid plots of five Māori diphthongs. The diphthong symbol is at the first target. The arrow is a schematic representation of the movement and ends at the second target. The ellipses represent the speaker group's short monophthongs. Female speakers are in the top line and male speakers in the lower line.

The ANOVA analysis revealed a number of significant differences (see appendix Table A3). There was a significant group effect for the second target for the female speakers with the young speakers having a significantly higher F1 and F2 than the historical elders. There was also a significant interaction between vowel and group for every target formant combination except for F2 of the first target for the female speakers.
It is immediately clear, from Figure 8, that /ao/ has remained stable over time and has always been clearly distinct from /au/ and /ou/. However changes are apparent for the other four diphthongs. The most striking change for /au/ and /ou/ is the fronting over time of the second targets which follow the fronting of /u/, as can been seen by the movement of the /u/ ellipses across the vowel space in Figure 8. Post-hoc t-tests on the F1 and F2 values (see Table A4 in the appendix) show that this fronting is significant. However the distinction between /au/ and /ou/ has always been carried by the first target, not the second target (compare the distinction between face and price in English). The potential merger between /au/ and /ou/ is mainly carried by the apparently less dramatic lowering of the first target of /ou/ over time. Interestingly there has also been a fronting of the first targets over time. These movements were not significant for the female speakers, however for the male speakers the first target of /ou/ has fronted more quickly than /au/ and consequently there is little visual difference in the placement of the first targets of /au/ and /ou/ for the young male speakers, thus suggesting a gender difference in the merger of the /au, ou/ diphthong pair.
A merger of /ae/ and /ai/ over time is much more noticeable. The historical elders make a clear distinction between these two diphthongs, in both targets, however for the young speakers, especially the young females, the two diphthongs are virtually indistinguishable. Although the young male speakers appear to make a distinction in T2 (see Figure 8) the difference is not clearly perceptible in connected speech. When one observes the relationship of the all-important second target of /ae/ to the /e/ ellipse, it does not appear to be linked with the raising of /e/. As the /e/ ellipse raises, the second target of /ae/ does not move. Nor does the movement of the first target seem to be linked to a monophthong movement, rather /ai/ seems to undergo glide weakening (Wells Reference Wells1982: 614) as its second target approaches the second target of /ae/.
3.2.1 Measures of diphthong movement
There are two different types of movements we wish to measure with the diphthong data. Firstly we wish to see whether the movements of the diphthong targets are significant, and secondly we wish to determine acoustically what is happening with the diphthong mergers.
As with the monophthong analysis, we used the VSM measures based on Euclidean distance ratios to ascertain the extent of the diphthong target movements. Here we only focused on /ae ai au ou/ as /ao/ is a stable vowel that has not changed over time. As there have been possible movement in both targets for the four diphthongs, we measured the movements for both. We measured the movement of the first targets with respect to the back of the vowel space. That is, using equation 4 we calculated VSMB(x), with the distance between /oː/ and /aː/ as a reference side of the vowel space and /oː/ being the reference point vowel. For /au/ and /ou/ we also measured the degree of fronting of the first target, measuring the movement relative to the top of the vowel space: that is we calculated VSMT(x), using equation 3. For the movement of the second target of /ae/ and /ai/, the front of the vowel space was the reference and we calculated VSMF(x) using equation 2. For the second targets of /au/ and /ou/, we measured their movement with respect to the top of the vowel space and calculated VSMT(x) (equation 3). For the second target movements /iː/ was the reference point vowel.
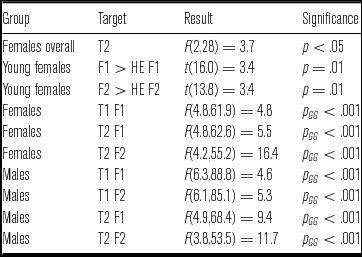
The significant target movements from the Bonferroni corrected t-tests on the VSM values are given in Table 7. The only significant movement for the first targets of /ae/ and /ai/ is their raising for the young male speakers. The centring and lowering of the second target of /ai/ observed in the young speakers (represented by a movement away from /iː/) is not significant for the men, and is only significant for the young female speakers compared to the elders. There is no difference between the elder groups. Since this is the more important target in terms of a potential merger between /ae/ and /ai/, it could indicate that the young women are ahead of the men in any merger.
The values of the significant t-tests for the VSM analysis for Māori diphthongs for the female and male speakers.

*p ≤ .05, **p ≤ .01, ***p < .001
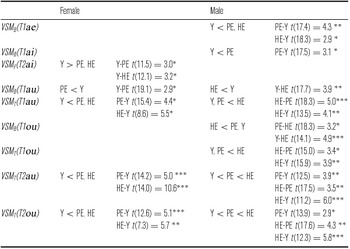
There is considerably more significant movement for the /au/ and /ou/ diphthong pair. The fronting of the second target of /au/ and /ou/ over time, clearly seen in Figure 8, is highly significant for both the female and the male speakers. However the movements of the first targets of these diphthongs are less clear. With respect to the /oː–aː/ side of the vowel space, the first target of /au/ is significantly further from /oː/ for the young speakers regardless of gender, although the behaviour of the two elder groups is inconsistent. There is also a trend for the first target of /ou/ to move away from /oː/, however this movement is only significant for the male speakers.
With respect to any fronting movement, the first target of /au/ is significantly closer to /iː/ for the Y compared to HE, for both genders. The first target of /ou/ is significantly closer to /iː/ (i.e. fronter) for the male young and present-day elders, compared to the historical elders, but for the female speakers there has been no significant movement.
A post-hoc t-test analysis of the formants provided similar results as to which movements were significant for the four diphthongs under analysis (see appendix Table A4). In addition, the post-hoc t-test showed /ao/ did not change with time.
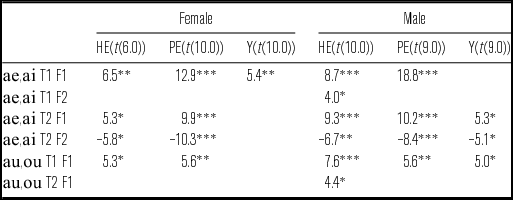
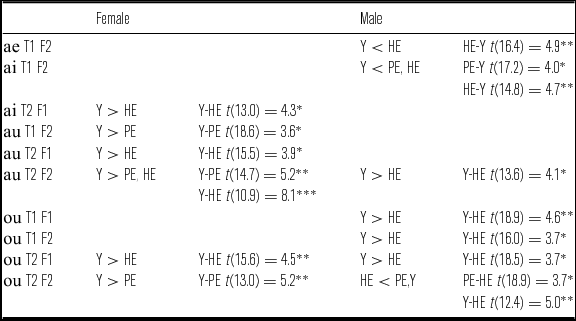
To determine the extent of the mergers between /ae, ai/ and between /au, ou/, t-tests were performed on the first two formant values of both the first and second vowel targets. The significant results are presented in Table 8. For the male speakers, the first targets of /ae/ and /ai/ have merged for the young speakers, but this is not likely to contribute to the perception of a merger. The second target, more important for distinguishing between the diphthong pairs, is kept distinct for all male speaker groups. However, for the female speakers the young women do not distinguish the more important second targets at all and the less important first targets of /ae/ and /ai/ are distinguished only by first formant differences. This combination is likely to lead to the perception that /ae/ and /ai/ are merged for the young female speakers.
The values of the t-tests where the F1 or F2 values for the diphthong pairs /ae, ai/ or /au, ou/ were significantly different at either the first (T1) or second (T2) target. The degrees of freedom for each speaker group are given in the appropriate column heading.

*p ≤ .05, **p ≤ .01, ***p < .001
The most pertinent target for the other diphthong pair, /au/ and /ou/, is the first target. From Table 8, it can be seen that all speaker groups except the young females keep the first targets of these diphthongs distinct in F1, which is the important dimension of relative vowel height. Only the male historical elders make a distinction between the less important second targets for the diphthong pair. There are no significant differences in F2 for either target. The young females therefore appear to have a merger between /au/ and /ou/ and the young males only just keep them distinct (p < .05).
3.2.2 Comparison with New Zealand English diphthongs
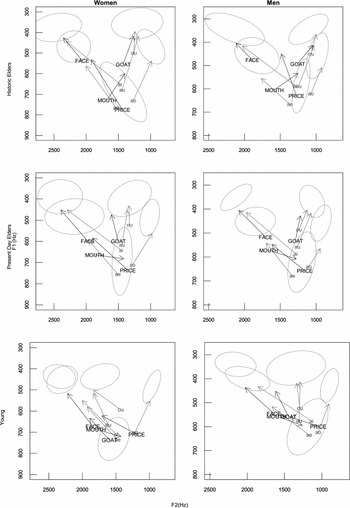
There are no direct correspondences between the Māori and the NZE diphthongs. However the most relevant NZE diphthongs to compare with the five Māori ones studied are the four NZE closing diphthongs face, price, goat, and mouth.Footnote 16 Figure 9 plots the centroids of the two targets for these four diphthongs for each of the three speaker groups, for both genders. The formant plots for the NZE diphthongs are superimposed on those for the Māori diphthongs, i.e. those from Figure 8, to enable easy comparison. This includes the ellipses for the short Māori vowels.
Centroid plots of the four English diphthongs face, price, goat, and mouth are plotted in black for the three speaker groups. The data for the five Māori diphthongs are plotted in grey. The diphthong symbol is at the first target. The arrow is a schematic representation of the movement and ends at the second target. The ellipses represent each speaker group's short Māori monophthongs. Male speakers are in the right column and female speakers in the left.

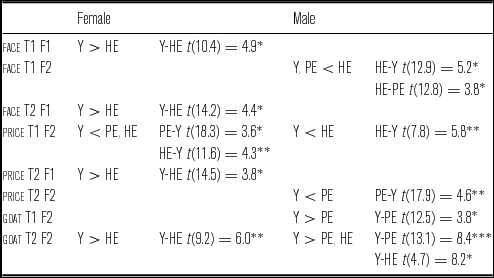
The ANOVAs on F1 and F2 values of the four NZE diphthongs revealed a number of significant relationships. There was a significant group effect for F1 of the second target of the female speakers (F(2,24) = 9.3, p < .01). Post-hoc t-test analysis revealed that the young females have a significantly greater F1 (and therefore phonetically lower vowels) than the present-day elders (t(18.4) = 2.6, p < .05), and the historical elders (t(13.5) = 4.3, p < .01). In addition there was a significant interaction between speaker group and vowel with the exception of F1 for the second target for both genders (female T1F1: F(3.5,41.8) = 4.2, pGG < .01; female T1F2: F(4.6,55.5) = 3.9, pGG < .01; female T2F2: F(3.0,36.3) = 11.8, pGG < .001; male T1F1: F(2.9,31.6) = 7.5, pGG < .001; male T1F2: F(4.1,45.6) = 8.6, pGG < .001); male T2F2: F(3.0,33.5) = 6.7, pGG = .001).
If we consider the female historical elders (top left hand plot in Figure 9), it is apparent that, for these speakers, the Māori and NZE diphthongs are relatively similar. Face has a phonetically higher T1 than /ai/, but price and /ae/ are very similar, with both targets for each vowel being in very similar positions in the vowel space. mouth and /au/ are also similar. Both start within or near to the ellipse for /a/, though T1 for mouth is more central than that for /au/. T1 for goat is more central in the vowel space than is T1 for /ou/, but both finish at the same point within the /u/ ellipse. By contrast, the differences between the historical elders’ Māori and NZE diphthong targets and the young speakers’ diphthong targets is quite striking. One notable change over time is the lowering of the second target for face and price. Post-hoc t-tests show that this movement is significant in F2 for the female speakers (see appendix Table A4). This movement is probably NZE glide weakening (see Gordon et al. Reference Gordon, Campbell, Hay, Maclagan, Sudbury and Trudgill2004) though it is possible that the lowering of the second target of price may also be linked to the /ai ae/ merger. However the most noticeable change over time for the NZE diphthongs is the fronting of the second target of goat, which is significant in post-hoc t-tests for both genders (see Table A5 in the appendix). It is this that appears to have the strongest parallel movement with any of the Māori diphthongs.
No VSM values will be given for the NZE diphthongs to investigate the significance of the vowel movements, although the values were calculated for the following correlation analysis.
3.2.3 Correlation investigation for the Māori diphthongs
The observed movements of the Māori diphthongs may well have been influenced by the monophthong movements in both Māori and English, as well as the NZE diphthong movements. All three categories will be considered in the following correlation analysis.
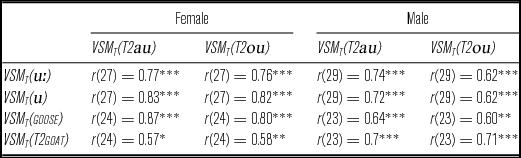
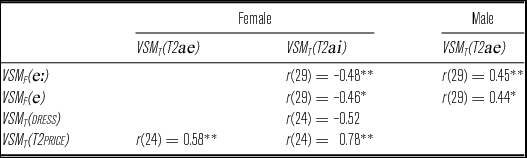
The strongest movement in the five Māori diphthongs investigated was the dramatic fronting of the second target of /au/ and /ou/. It was this movement that had the strongest correlation with any of the monophthongs studied, for either Māori or English. The VSM correlation results are given in Table 9. For both the female and the male speakers, the fronting movement of /au/ and /ou/ is very highly correlated with the fronting of Māori /u uː/, and NZE goose. It is also correlated with the second target of NZE goat, although the correlation is lower for the women than for the men.
Significant correlations of VSMT(T2au) and VSMT(T2ou) with a number of different VSM values.

*p ≤ .05, **p ≤ .01, ***p < .001
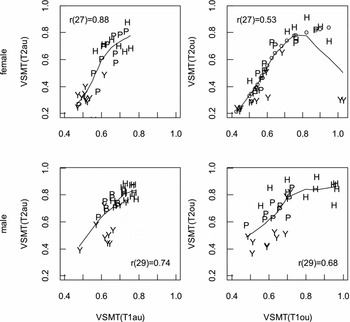
Although the second targets of /au/ and /ou/ are less important to their distinction, it may well be that the dramatic movement of these second targets contributed to the merger between them (see Figure 8, and Table 8). A correlation analysis of the appropriate VSMs shows that fronting of the first target of /au/ is highly correlated with the fronting of the second target (female: r(27) = 0.88, male r(29) = 0.74, p < .001), and the fronting of the first target of /ou/ is also correlated with the fronting of its second target, but to a lesser degree (female r(27) = 0.53, male r(29) = 0.68 p < .01). The correlation plots are given in Figure 10. Here it can clearly be seen that as the second target of /au/ fronts in the vowel space (i.e. gets closer to /iː/), so too does the first target, regardless of gender. This also happens for the male /ou/. There are two young female speakers shown at the bottom right of the second plot whose first target of /ou/ is quite different from the other speakers. If their data is removed from the analysis the correlation between the two targets of /ou/ for the female speakers increases to r(25) = 0.88, p < .01. Finally, the young speakers are predominantly in the bottom left of the plots, indicating that the second targets of their diphthongs are relatively close to /iː/, and there is a tendency for the historical elders to be in the top right, indicating that the second targets of their diphthongs are relatively farther from /iː/.
The correlations of the T1 /au/ and T1 /ou/ movements with the T2 /au/ and T2 /ou/ movements, respectively, using the VSM, female data top row plots, male data bottom row plots (p < .001 in all cases), where Y = young group, P = present-day elders, and H = historical elders. The dotted line in the top right plot, VSMT(T1ou)~VSMT(T2ou), shows the correlation that is obtained when two outlier female Y speakers are removed from the analysis.

The movements of the second targets of /ae/ and /ai/ are difficult to attribute to any particular vowel movement, as can be seen in Table 10. The raising of /e eː/ is correlated with the movement of the T2 target of /ae/ for the male speakers, but for the female speakers it is, by contrast, inversely correlated with the T2 target of /ai/. However it is difficult to see how the raising of /e eː/ can have any bearing on the lowering of the second target of /ai/. The second target of price has lowered and backed over time which follows a similar pattern to the second target of Māori /ai/ (see Figure 9). However although these movements are highly correlated for the female speakers, there is no significant correlation at all for the male speakers. This lack of consistent results in the correlation analysis strengthens the hypothesis that the merger is more likely to be due to glide weakening in /ai/ rather than to mirroring the movements of the associated monophthongs.
Significant correlations of VSMT(T2ae) and VSMT(T2ai) with a variety of different VSM values.

*p ≤ .05, **p ≤ .01, ***p < .001
3.2.4 Diphthong discussion
There is strong evidence that there are changes in the Māori diphthongs, and this study has provided acoustic evidence of the merging of both /ou/ with /au/, and /ae/ with /ai/. However the motivation for the mergers is quite different for the two pairs.
Our data suggests that /ou/ and /au/ have always been fairly similar in the second target; the differences between them are only marked in the first formant of the first target, and these have been lost for the young female speakers (see Figure 8 and Table 8). The largest change over time for /au/ and /ou/ has been the fronting of the second target (see Figure 8) which is highly correlated with the movement in the Māori vowel space of /u uː/ but it is also correlated with the movement of goose and the second target of goat in the NZE vowel space. The first targets of /au/ and /ou/ have also fronted, and this fronting is correlated with the fronting of the second targets (Figure 10). It is possible that fronting of the entire diphthongs which can be seen in Figure 9 has caused the differences between the first targets of /au/ and /ou/ to be lost for the young female speakers, and to be very weak for the young male speakers (see Table 8).
Another factor in the loss of the distinction between /au/ and /ou/ may be because /ou/ has become unrounded over time. The closest NZE diphthong to /ou/ is goat, and the first target of this vowel has been unrounded in NZE since at least the early 1900s (Gordon et al. Reference Gordon, Campbell, Hay, Maclagan, Sudbury and Trudgill2004: 158). This may well have had some influence on Māori /ou/. There is anecdotal evidence to suggest that Māori /ou/ was originally lip rounded. The increase of F2 over time for the T1 of /ou/ may be partly due to the unrounding of the first target (lip unrounding means the vocal tract length shortens, causing the formants to raise; Lindblom & Sundberg Reference Lindblom and Sundberg1971). In support for this suggestion, we note that the HE speakers have a lower average F3 for /ou/ than either the PE or Y speakers, indicating that their T1 for /ou/ was more rounded than the first targets of the other speaker groups.
In Māori, the most fronted versions of both targets of /ou/ occur after /t/ in the plural pronouns mātou ‘we (exclusive)’, tātou ‘we (inclusive)’, koutou ‘you’, rātou ‘they’. In Maclagan et al. (Reference Maclagan, Watson, Harlow, King and Keegan2009) we noted that Māori /u uː/ which follow /t/ are more fronted than tokens that follow other consonants. The /ou/ phonemes in pronouns appear to follow a pattern similar to the tokens of /u/ that follow /t/ so that most tokens of /ou/ occur in a fronting context. The first element of the diphthong, /ou/, appears to have moved forward and lowered within the vowel space until it has moved from its initial position nearer the /o/ region (within the /o/ ellipse for the historical male speakers) so that it is now very central within in the vowel space, and closest to /a/. This means that the first targets of both /ou/ and /au/ are now closest to the same monophthong, /a/. This will have added perceptually to the merger.
It is difficult to attribute the merging of /ae/ and /ai/ to any one factor. It is quite clear that whereas these two diphthongs were distinct for the historical elders, this distinction has reduced over time (see Figure 8). But it is not clear precisely which factors caused the merger. Because of the prevalence of glide weakening over time in NZE, we suggest that the process of glide weakening has reduced the length of the glide in /ai/. Historically, NZE diphthongs have been subject to both diphthong shift and glide weakening (see Wells Reference Wells1982, Gordon et al. Reference Gordon, Campbell, Hay, Maclagan, Sudbury and Trudgill2004). Diphthong shift affected the first targets of the NZE vowels, resulting in more extensive diphthongisation with greater formant shifts. Glide weakening then reduced the lengths of the glides. The second targets of the Māori vowels appear to be more strongly affected by NZE than do the first targets, with /ai/ seeming to parallel the lowering of the second target of both face and price, a result that can be attributed to glide weakening.
These mergers have little effect on intelligibility because most or possibly all potential minimal pairs of words are different parts of speech so there is little possibility of misinterpretation. For /ai/ and /ae/, compare, for example, tae ‘to arrive (verb)’ and tai ‘sea, tide (noun)’, and for /au/ and /ou/ pau ‘to be used up (verb)’ and pou ‘post (noun)’. Because the most common contexts for /ou/ are the plural pronouns, this removes potential misinterpretations with /au/. In addition, Ngāti Porou, one of the largest tribes in the North Island of New Zealand, along with other groups speaking ‘Eastern’ dialects (Harlow Reference Harlow2007: 45–47), has traditionally pronounced and written the plural pronouns with /au/ thus potentially reinforcing the merger between /ou/ and /au/. The authors were not able to think of any plausible misinterpretations that could occur because of the diphthong mergers studied here.
Finally, though, in the midst of all this change, it is important to note that /ao/ has not changed at all over time. This is possibly a reflection on the stability of both the /a aː/ and /o oː/ vowels, which have essentially remained the same for all our speakers, regardless of the passage of time.
4 Overall discussion and conclusion
In this sound change study we introduced a new measure to investigate sound change adapted from Harrington et al. (Reference Harrington, Kleber and Reubold2008). This measure used Euclidean distances based on Bark-scaled F1 and F2 values and enabled us to identify the position of the vowel of interest with respect to the relevant side of the vowel space, defined by the point vowels. By investigating data from speakers with different birth dates, we were able to see how the positions of the vowels of interest changed with respect to the point vowels, and thereby to establish whether sound change had occurred. The results we obtained from this study were similar to those calculated via traditional formant analysis but we were also able to account for speaker effects which were affecting the results for the women speakers. In addition, we were able to represent the movements relative to the vowel space as a whole – which is what happens both visually when assessing formant plots, and perceptually when listening to speech.
From the results of our earlier studies (see for example Harlow et al. Reference Harlow, Keegan, King, Maclagan, Watson, Stanford and Preston2009, Maclagan et al. Reference Maclagan, Watson, Harlow, King and Keegan2009, King et al. Reference King, Watson, Maclagan, Harlow, Keegan, Holmes and Marra2010b), we have long suspected that these sound changes in Māori were due at least in part to the impact that NZE was having on the language and the fact that NZE itself has been undergoing extensive sound change (see e.g. Watson et al. Reference Watson, Maclagan and Harrington2000, Gordon et al. Reference Gordon, Campbell, Hay, Maclagan, Sudbury and Trudgill2004). The results from the present study reinforce our earlier conclusions, but also provide a much more comprehensive picture of the changes in progress. This has been achieved through the analysis of both monophthongs and diphthongs, and also through being able to compare the results of parallel male and female speaker groups.
The changes in the Māori monophthongs are clearly influenced by comparable changes in acoustically similar vowels in NZE. The raising of /e eː/ is caught up with the raising of dress and trap in the front vowel chain shift in NZE. We saw that these movements were all highly correlated (Figures 6 and 7). It would be useful to be able to compare how the vowels in the two languages change over time in relationship to the entire vowel space, and the VSM measures provide a possible mechanism for doing this. The mean values for VSMF(e), VSMF(eː), and VSMF( dress ) for the female and male speakers are given in Table 11. It is very striking that the VSMF(eː) is essentially the same as VSMF( dress ) for each speaker group, regardless of gender. This strongly suggests that the Māori /e eː/ was a relatively high front vowel to begin with, and it was completely swept up in the NZE front vowel chain shift. However, we note that the comparison of VSMs from the Māori vowel space and the NZE vowel space should be done with great caution, since the point vowels of the vowel triangles are not exactly in the same places in the F1/F2 plane, even though the data for the two languages are essentially from the same set of speakers (see Section 2.1).
Selected mean VSM values for female and male speakers.

By comparison, the fronting of the Māori /u uː/ seems to lag behind the fronting of the NZE goose. Regardless of gender, the mean VSMT( goose ) are all smaller than the VSMT(uː) and VSMT(u) for each speaker group (see Table 11 for more details) indicating that goose is more front than the Māori vowels. In Maclagan et al. (Reference Maclagan, Watson, Harlow, King and Keegan2009) we argued that the fronting of /uː/ and /u/ was due in part to the influence of the NZE goose. But it was also due in part to the fact that NZE had an aspirated /t/, whereas Māori had an unaspirated /t/. The production of this new aspirated variant of /t/ for the Māori speakers meant that the /u, uː/ was much more vulnerable to fronting in a /t/ context. This lagging of the VSMT(uː) and VSMT(u) behind VSMT( goose ) adds support to this argument, since the fronting of the Māori /u uː/ is not happening at the same pace as the fronting of NZE goose. Although once again we stress the caveat about comparing the VSM from different languages noted in the previous paragraph.
One of the interesting findings to emerge from the data is that, whereas the short NZE kit has retracted and lowered over time (see Figure 4, and Watson et al. Reference Watson, Maclagan and Harrington2000, Gordon et al. Reference Gordon, Campbell, Hay, Maclagan, Sudbury and Trudgill2004), the Māori /i/ remains phonetically close to /iː/; neither has been affected by the kit movement. The Māori vowel system has traditionally been regarded as a five vowel system, with the long vowels interpreted underlyingly as two short vowels. The lack of movement of Māori /i/ in contrast with the behaviour of NZE kit provides continued support for this view. As do the findings that it was the vowel pair /e eː/ that moved with dress, not just the short /e/, and it was the vowel pair /u uː/ that moved with goose, not just the long /uː/.
It was hoped that the diphthongs would give a clearer picture of whether the changes in the Māori monophthongs could solely be attributed to the impact of NZE, or whether there was some evidence of internally motivated sound change. There is evidence that the movements of the diphthong targets, or lack of movement in the case of /ao/, are linked with the Māori monophthongs. There is also evidence that NZE has influenced the movements of the diphthongs. However, when one compares the degrees of correlations between the diphthong movements and the Māori and English monophthongs, NZE seems to have had less influence on the diphthongs than on the monophthongs. Māori has other diphthongs beyond those studied here, and perhaps expanding the study to include them would add to our understanding of the impact NZE is having on Māori.
The acoustic evidence observed in this study of Māori from speech recordings by both male and female speakers has provided an even fuller picture of the sound changes in progress. Although gender differences are not the major focus of this paper, there are already some observations we can make. With regards to the significant monophthongal changes in Māori there is in fact no difference due to gender, although women have led in the raising of /eː/ and /e/ (compare the relative positions of these vowels for the present-day male and female elders in Figure 3). In contrast, there have been greater differences between the male and female speakers for the diphthong data: for example there are gender differences in the /au ou/ merger. It would be worthwhile to do a thorough contrast between the men's and women's data in a future study to see whether these can shed further light on the sound changes happening within Māori.
In this study, when significant sound change was found in vowels over time it was typically found between the young speakers, on the one hand, and the two elder groups, on the other hand, although the trends could usually be seen across all speaker groups. That is, the historical elders usually lagged behind the present-day elders, but this difference was often not significant. However, it is not likely that the differences between the Y group and the two elder groups were age effects. The major movements discussed here are either fronting or raising and neither are likely to be the result of aging. Aging is expected to result in lowering of F1 (Linville & Rens Reference Linville and Rens2001, Harrington, Palethorpe & Watson Reference Harrington, Palethorpe and Watson2007, Torre & Barlow Reference Torre III and Barlow2009, Reubold et al. Reference Reubold, Harrington and Kleber2010). We found no evidence for this for the male speakers. For the female speakers we did find that the two elder groups had significantly lower F1 for /i iː/, /u uː/, and the diphthongs’ second targets. However, this was not the case for the remaining vowels. For this reason, we do not believe this is an aging effect. We also found some group effects in F2 for the men in the monophthongs of both languages, and for the women in the diphthong second targets for Māori: these are both likely to be speaker rather than aging effects. The most likely reason why we are seeing the most significant changes over time between the young and two elder groups is due to the break in the intergenerational transmission of Māori that would have affected the younger speakers (Fishman Reference Fishman1991), but not the two elder groups.Footnote 17
At the start of the paper we postulated that we would see the least influence of NZE on the Māori of the HE speakers, and a slightly greater influence on the Māori of the PE speakers. In contrast, the Māori of the Y speakers should be the most influenced by NZE, since they learnt and produced their Māori vowels through the filter of their already or simultaneously acquired English vowels. This is indeed what this study has found: it was the Y speakers who had the significantly raised /e eː/ and dress vowels and fronted /u uː/ and goose vowels. The raised dress and fronted goose are both features of modern NZE (Gordon et al. Reference Gordon, Campbell, Hay, Maclagan, Sudbury and Trudgill2004). The fronted goose also influenced Māori diphthong production, contributing indirectly to the merger of /ou/ and /au/. The merger of /ae/ and /ai/ seen in the younger speakers has also been attributed to the influence of glide weakening that has historically been prevalent in NZE.
Our analysis confirms the traditional interpretation of Māori long vowels as two like short vowels in that the long and short pairs of vowels tend to move together. However, if these two diphthong mergers are occurring, the phonological analysis of Māori diphthongs as underlyingly two unlike short vowels is weakened, in that all candidate pairs of short vowels that could be realised as diphthongs do not now have a unique realisation. Allied to the suggestion that glide weakening has played a role in the changes in these diphthongs, this point leads to the speculation that at least for some younger speakers, the diphthongs are becoming detached from the monophthong system and are developing as unit phonemes.
We do not believe that it is simply a matter of modern speakers of Māori ‘copying’ English, or that modern speakers are all acquiring Māori with a ‘foreign accent’ (though it is interesting, in this regard, to note that some Hawaiian speakers say that Māori sounds like NZE to themFootnote 18 ). Other systemic factors, such as the preservation of the traditional Polynesian five-vowel system, the related analysis of long vowels as geminate short ones, and the strong influence of the Māori monophthongs on the Māori diphthongs, show that new generations of speakers of Māori are acquiring a phonemic system with its own internal parameters and consistencies.
In this paper we have shown that Māori has undergone, and is still undergoing sound changes, and that these sound changes are, for the greater part, due to the influence of NZE. Many sound change studies focus on the dominant language, typically English, and focus on internal motivations for change. However sound change has many motivators, and it is very rare that a language is uninfluenced by external factors. In fact there are many languages throughout the world which coexist with a more dominant variety, and outside the English-speaking world, many or even most speakers are multilingual. We hope this study of sound change in Māori will motivate more studies like this, so we can gain a greater understanding of the mechanisms behind sound change.
Acknowledgements
This research was supported by grants from the Marsden Fund of the Royal Society of NZ. We thank the participants in this study for their speech recordings and the anonymous reviewers for their comments. The first author would also like to thank the Institutute of Phonetic Science at the Ludwig Maximilian University, Munich for hosting her visit, during which most of this paper was written.
Appendix. Additional material
Phonetic realisations of Māori phonemes by the different speaker groups.

Phonetic realisations of English phonemes by the different speaker groups.

Significant results from the ANOVA analysis for the first and second vowel targets of /ae ai au ou ao/ for all three speaker groups.

The values of the significant t-tests for the formants for Māori diphthongs for the female and male speakers.

The values of the significant t-tests for the formants for New Zealand English diphthongs for the female and male speakers.