I. INTRODUCTION
The growing emergence of wide band gap semiconductors for power, radio-frequency (RF) electronics, and high power silicon microelectronics has accentuated the need for improved thermal interface materials (TIMs) in providing efficient management of the huge thermal load generated by these devices. The existing TIMs commonly used for such applications can be categorized as thermal grease-type interface materials, thermally conductive adhesives, and thermal tapes. In most thermal greases, high thermal conductivity originates from the filler particles, such as aluminum or silver powder. The thermal conductivity of the best thermal greases is on the order of 8–10 W/(m K).Reference Liu, Michel, Rencz, Tantolin, Sarno, Miessner, Schuett, Tang and Ziaei1 Further, thermal greases are usually oil-based materials so their application is messy and difficult to apply in a thin uniform coating. In addition, these greases are not reusable and usually suffer from drying or voiding within the interface in applications that involve high temperatures or extensive thermal cycling. This eventually increases the thermal barrier in a significant manner. On the other hand, thermal transport properties of thermal tapes and thermally conductive adhesives do not meet the thermal management and structural load requirements of the next generation aerospace structures.Reference Ganguli, Sihn, Roy, Dai and Qu2 These conventional techniques of thermal management relating to interface thermal loads are not an integral part of the packaging architecture and thus do not efficiently address the problems of interfacial thermal resistance, thermal expansion coefficient mismatches, etc. Hence, there is an emerging need for materials research to develop efficient TIMs that can be integrated with the package and address the problems associated with conventional thermal management techniques.
Carbon nanotubes (CNTs) have been proposed as a possible TIM to replace solders because of their excellent thermal properties and one-dimensional structure. Furthermore, it has been shown that CNTs can enhance mechanical compliance between the surfaces.Reference Liu, Michel, Rencz, Tantolin, Sarno, Miessner, Schuett, Tang and Ziaei1 Huang et al.Reference Huang, Liu, Wu and Fan3 developed a TIM based on aligned CNTs embedded in an elastomeric matrix. Though they achieved a 120% enhancement of thermal conductivity using the nanocomposite film, the reported value of 1.21 W/(m K) was much less than that of the value predicted by assuming total thermal transport through the CNTs and matrix interface (i.e., perfect thermal interface).Reference Huang, Liu, Wu and Fan3 While Huang’s work improved the thermal conductivity of the epoxy matrix, in spite of using CNTs, it does not meet the thermal conductivity of thermal grease-type materials, which is around 8–10 W/(m K). This is because of significant resistance to heat flow at the CNT/polymer interface (phonon scattering), which is caused by the acoustic impedance mismatch.
Recent experiments by several researchers have shown that a dense array of vertically aligned CNTs grown on silicon and copper substrates can provide thermal resistance values, which are less than 20 (mm2 K)/W.Reference Liu, Michel, Rencz, Tantolin, Sarno, Miessner, Schuett, Tang and Ziaei1, Reference Ganguli, Sihn, Roy, Dai and Qu2, Reference Amama, Cola, Sands, Xu and Fisher4–Reference Tong, Zhao, Delzeit, Kashani, Meyyappan and Majumdar9 Comparatively, lead-free solders on the market possess similar thermal resistances that range from 7 to 28 (mm2 K)/W.Reference Liu, Michel, Rencz, Tantolin, Sarno, Miessner, Schuett, Tang and Ziaei1 A recent attempt by Ganguli et al.Reference Ganguli, Sihn, Roy, Dai and Qu2 to reduce the interfacial thermal resistance in adhesively bonded structures resulted in high through thickness thermal conductivity [∼262 W/(m K)] of the developed device by incorporating aligned multiwalled carbon nanotubes (MWCNTs) in adhesive joints when compared to that of less than 1 W/(m K) without the MWCNTs. They also calculated a thermal interface resistance of 12 (mm2K)/W in the adhesively bonded joint under study.
Though the aforementioned study achieved superior thermal transport properties, the processing and scale-up of the developed process would be prohibitively expensive. Furthermore, the Au–In interface used in this study is not structurally durable. Even with the right choice of materials as well as the right type of bonding at the interface, one that matches the vibrational density of states of interface components, it is necessary to reduce the interface thermal resistance even further [below ∼12 (mm2 K)/W]. Recent molecular modeling studies have predicted that a three-dimensional hierarchical structure comprising nanotubes bonded on graphene layers can be potentially used as the next generation TIM with significantly reduced interfacial thermal resistance, resulting from all carbon atomic configuration at the CNT/graphene junction.Reference Varshney, Patnaik, Roy, Froudakis and Farmer10 Previous experimental efforts to realize this structure have not investigated the thermal transport behavior at the nanotube graphite junction.Reference Zhang, Xiong and Zhao11–Reference Jousseaume, Cuzzocrea, Bernier and Renard13 Toward experimental realization of such interface morphology, we present a growth and characterization scheme of vertically aligned multiwalled carbon nanotubes (VAMWCNTs) on graphite thin film foils. In the current study, we have demonstrated that catalyst-free covalent bonding between the nanotubes and the graphitic substrate ensures a significant reduction of the interfacial thermal resistance leading the way to a new generation of advanced thermal interfacial materials.
II. EXPERIMENTAL DETAILS
Toward obtaining a self-similar atomic configuration at the CNT–graphene junction, as-purchased graphite thin film was coated with a thin layer of silicon oxide at 1100 °C in a tube furnace by introducing silicon tetrachloride with a gas flow of argon (300 mL/min) and hydrogen (30 mL/min) in the presence of a trace amount of air for 10 min. The SiO2 coating was used to facilitate the growth of VAMWCNTs on the graphite substrate by the pyrolysis of iron phthalocyanine under argon/hydrogen atmosphere at 800–1100 °C. The detailed procedure has been reported elsewhere.Reference Huang, Dai and Mau14, Reference Qu, Zhao and Dai15 The morphology of the as-grown VAMWCNTs was characterized by high-resolution scanning electron microscopy (SEM). A FEI Titan 80-300 transmission electron microscope (TEM; FEI Inc., Hillsboro, OR) operating at 80 kV was used to characterize the interfaces for further detail insights. The TEM specimens were prepared for microtoming according to the procedure described in Supporting Information A. As the nanotubes are extremely beam sensitive, microscope images were taken quickly after all the adjustments were made at an adjacent area of the specimen. The thermal diffusivity and conductivity of the specimens were characterized by a Netzsch laser flash thermal analyzer LFA 457 (NETZSCH Instruments North America, LLC, Pittsburgh, PA).
III. RESULTS AND DISCUSSION
A. Morphological characterization
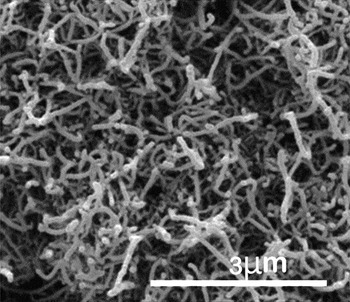
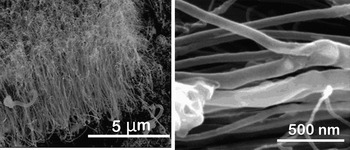
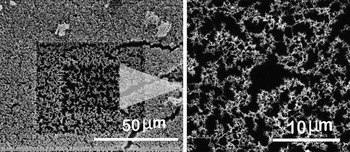
Multiple characterization tools are used to analyze the materials morphology of the CNT–graphene junction. A SEM image showing the top surface of the as-produced VAMWCNTs that were grown on the graphitic surface is given in Fig. 1. A cross-sectional view of the VAMWCNT array, shown in Fig. 2, depicts a general vertical alignment. While the observed alignment is not perfect, it is clear that the upper regions of the nanotubes are mechanically interlocked, where nanotubes have physical entanglements, chemical fusing, as well as multiple branched structures. To get an estimate of the aerial density of the nanotubes for thermal characterization (discussed later), a count of nanotubes within a given area has been made. However, as the top layer of the nanotubes was mechanically interlocked, it is extremely difficult to get an accurate estimate of the number density of the CNTs without further surface modifications. Thus, the top layer of the nanotubes was etched with a gallium ion beam for 30 min in a focused ion beam microscope. The resulting surface is shown in Fig. 3. After the nanotubes were successfully isolated by etching the entangled top surface, we estimated the percentage of nanotubes in a given area by performing a gray scale histogram analysis on the etched image in Adobe Photoshop® to be ∼20%. It is to be noted that this value is an upper bound as contributions from bent tubes have not been eliminated from the analysis.
SEM micrograph of VAMWCNT array (top view). We observe mechanical interlocking of the nanotubes.

SEM micrograph of the aligned nanotubes (cross-sectional view). The left image shows that the nanotubes are generally vertically aligned. A closer look at the nanotubes (right image) shows branched nanotube structures, which result in lowering of the thermal transport in the longitudinal axis of the tubes.

Ion-etched nanotube surface for enabling histogram analysis. After etching, we observe the nanotube tips represented by the bright patterns in the SEM image on the right. Histogram analysis on the right image gives us an upper bound of the nanotube aerial density.

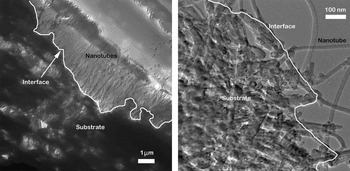
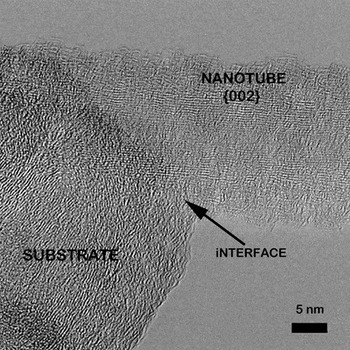
The detailed structure of the graphite/CNT interface was studied by multiple visualization and characterization techniques. This structure is evidenced by the lattice fringe patterns at the interface where high-resolution transmission electron microscopy (HRTEM) was performed. In this context, first, the lower magnification TEM images of the specimen are shown in Fig. 4. Here, the white line in Fig. 4 shows the interface between the nanotubes and the graphite foil. To further investigate the nature of the bonding between the nanotubes and the graphite foils, lattice image micrographs were obtained as exemplified in Fig. 5. It was observed that crystalline lattice fringe patterns of the nanotubes and the graphite foil are, in fact, well aligned. The degree of alignment was further supported by the fringe spacing (∼0.34 nm), which corresponds to the graphitic interlayer spacing (along 002 direction) as well as wall separation between MWCNTs.
TEM cross-sectional micrograph of the studied specimen showing the interface. The image on the left is a lower magnification view of the image. The image on the right is a higher magnification view of a portion of the interface.

HRTEM lattice image at the interface of the nanotube and the substrate. The crystalline lattice fringe patterns of the nanotubes and the graphite foil are well aligned.

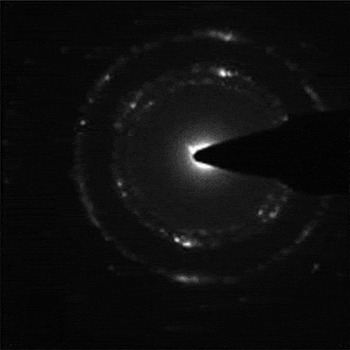
To further assess the orientational order of the atomic entities at the interface, selected area electron diffraction patterns were obtained. The pattern was recorded from the area shown in Fig. 5 containing both graphite and CNTs and is presented in Fig. 6. The electron diffraction patterns of the interface between the nanotubes and the substrate show well-defined polycrystalline hexagonal patterns associated with sp 2hexagonal atomic arrangements of carbon atoms. These diffraction data further confirmed that at some locations, the atomic arrangement at the interface is entirely crystalline and should correspond to a well-bonded interface.
The electron diffraction patterns of the interface between the nanotubes and the substrate show well-defined polycrystalline hexagonal patterns associated with sp 2hexagonal atomic arrangements of carbon atoms.

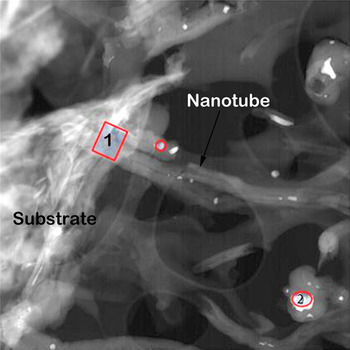
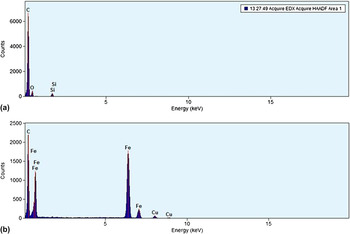
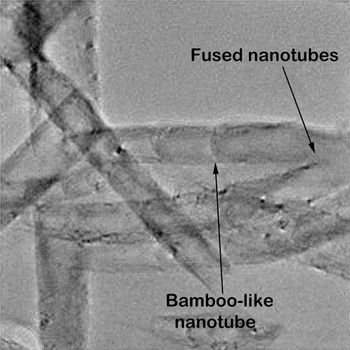
Though the HRTEM images showed good bonding at the interface, the chemical makeup at the interface was analyzed to identify the possible presence of any catalyst particles or other foreign materials that may inhibit thermal transport across the CNT/graphite interface. Figure 7 shows a scanning transmission electron microscopy (STEM) of the interface. Energy dispersive x-ray spectroscopy (EDS) was performed on the selected areas outlined by a box for area 1 and a circle for area 2 in the Fig. 7. The box (area 1) represents a CNT–graphene junction and circle (area 2) is a catalyst-rich location. The EDS spectrum for area 1 is presented in Fig. 8(a). Here, the predominant presence of carbon from the nanotubes and the substrate was observed along with small fractions of silicon and oxygen (silica), possibly originating from the coating on the substrate as previously discussed in Sec. II. The EDS spectrum for area 2 is presented in Fig. 8(b). Here, in addition to the presence of carbon (from the nanotubes), significant proportions of iron (from the catalyst used in the growth of the nanotubes) and copper (from the TEM grid used in this study) were observed as well. This analysis suggests that the bonded CNT/graphite interface is virtually defect and contamination free. For the sake of completeness, it should be mentioned here that near the bonded CNT/graphitic interface, branched nanotubes and bamboo-like node structures as observed by the SEM technique were also observed in the TEM studies. A representative TEM image (Fig. 9) shows the mentioned branched and bamboo-like nanotubes. This nanotube structure is expected to exhibit an intrinsic reduction in thermal transport along the nanotube length due to poor continuity of the atomic layers.
STEM images of the interface showing nanotubes, substrate, and catalyst particles. The graphite foil substrate is to the left in this image. EDS spectrum were acquired from area 1 and 2 in the image.

EDS spectrum from the interface of nanotube and graphite thin film: (a) EDS spectrum from area 1 in Fig. 7; (b) EDS spectrum from area 2 in Fig. 7.

TEM images of the nanotubes. Similar to the SEM images, we see branched and other defects along the length in the nanotubes.

B. Laser flash analysis
The bulk thermal properties of the bare graphite foil and the nanotube grown on the graphite foil were measured by a Netzsch LFA 457 laser flash thermal diffusivity system. The laser flash technique (or heat pulse) allows the measurement of the thermal diffusivity (α) of solid materials. It consists of applying a short duration (<1 ms) heat pulse to one face of a parallel sided sample and monitoring the temperature rise on the opposite face as a function of time. This temperature rise is measured with an infrared detector. Thermal diffusivity (α) can then be calculated using Eq. (1):
 $${\rm{\alpha }}\, = \,{{\varpi d^2 } \over {{\rm{\pi }}t_{1/2} }}\quad,$$
where ϖ is a constant, d is the thickness of the specimen, t 1/2 is the time for the rear surface temperature to reach half its maximum value. Sample weight and dimensions of the samples were accurately measured to calculate the density using a simple ratio of measured weight to volume. Finally, using the heat capacity (C p) measured using a TA Instruments modulated DSC Q5000 instrument (TA Instruments Inc., New Castle, DE), the density (ρ), and the thermal diffusivity (α), the thermal conductivity (k) of the samples were obtained at 24 °C from Eq. (2):
 $$k\, = \,C_{\rm{p}} {\rm{\rho \alpha }}\quad.$$
Thermal resistance (R), a measure to determine the thermal transport performance at an interface, is defined by the ratio of the thickness (d) to the thermal conductivity (k). The values of R were calculated both for the bare graphite foil and the nanotube modified graphite foil. The results of the thermal measurements and calculated thermal resistance are presented in Table I. These data illustrate that introducing the nanotube layer with a thickness of 25 μm only increased the overall thermal device resistance by ∼10 (mm2K)/W. This resistance change results from the interface thermal resistance at the CNT/graphite junction as well as the thermal resistance offered by the 25-μm-thick vertically aligned nanotube forest participating in the thermal transport. We now proceed to estimate the interface thermal resistance using a simple resistance model.
Bulk thermal transport properties of the nanotube on graphite specimen.

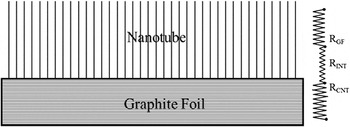
In this context, a schematic illustration of the specimen configuration along with the thermal resistance diagram is presented in Fig. 10. While the thermal resistance of the substrate (R GF) is known experimentally [∼23 (mm2 K)/W], the interface thermal resistance (R INT) and that of nanotubes’ forest (R CNT) need to be estimated, given that R INT + R CNT = ∼10 (K mm2)/W. Now, R NT can be estimated easily if the effective thermal conductivity of 25-μm nanotube forest (k eff) is known by using the simple expression, R CNT = t CNT/k eff, where t CNT is the thickness of the nanotube forest (25 μm in this case). Here, it is easy to observe that if we assume R INT ∼ 0 (i.e., if the CNT–graphene interface resistance is negligible), the value of k eff ∼ 2.5 W/(m K), which is unrealistically a low value for MWCNT of its length (i.e., 25 μm). Thus, the laser flash measurement implies that CNT–graphene interface does exhibits, although low, a finite interface thermal resistance (R INT).
Schematic of the specimen configuration and resistance circuit diagram.

While there is no direct way of measuring effective thermal conductivity of our films (as the nanotubes are bonded and not possible to peel off from the graphitic substrate), we can however estimate the value of k eff from literature. On revisiting published literature on thermal conductivity of MWCNT forests, we find that Yi et al.Reference Yi, Lu, Dian-lin, Pan and Xie16 measured the thermal conductivity of similar MWCNT mats by the 3-ω technique and reported the value of ∼20 W/(m K). Unlike their study, we observe extensive evidence of curved, branched, and bamboo-like nanotube structures from the microscopy. Such defects increase the tendency of phonon scattering along the length of the nanotube and decrease their intrinsic thermal conductivity. Hence, the k eff value reported here should be much lower than that of Yi et al.Reference Yi, Lu, Dian-lin, Pan and Xie16 Considering the areal coverage of the MWCNTs (Fig. 3), their average diameter and thickness, and cylindrical packing efficiency, we estimate our k eff value to be ∼7 W/(m K) (see Supporting Information B for further details). This range leads to the estimated value of R INT to be ∼6 (mm2K)/W, which to our knowledge is the lowest value published in the literature.
It is important to note that as shown in the present study through different SEM and TEM images, not all the nanotubes from the VAMWCNTs forest made the perfect “bonded” contact with the graphitic substrate. The rest were primarily physisorbed on to the substrate and were interacting with the substrate by the van der Waals interactions, predominantly. This fractional value is of great significance interest as this suggests that if all the nanotubes were, in fact, covalently bonded to the graphitic substrate, the interface thermal resistance could be reduced by a considerable amount (possibly, be an order of magnitude or more).
IV. CONCLUSIONS
In spite of excellent thermal behavior of CNTs, it is apparent that many challenges still need to be overcome before CNT-based devices can be incorporated in the next generation advanced TIMs. The primary challenge lies in the engineering of the CNT tips for better thermal energy transmission by reducing phonon scattering at such interfaces. In this study, we have successfully synthesized and characterized a novel graphite–VAMWCNT interface toward the development of next generation TIM devices. Using different techniques, we have demonstrated that excellent bonding between individual nanotubes and the graphitic substrate can be achieved at the local level. Further chemical analysis of the interface revealed that the bonded interface was free of catalyst and foreign particles. The low interface thermal resistance value of ∼6 (mm2K)/W suggests that such a bonded interface would lead to superior thermal energy transmission at nanotube tips. In this study, although only a fraction of the nanotubes from the VAMWCNTs forest made the perfect “bonded” contact with the graphitic substrate (the remaining were interacting through the van der Waals interactions), we foresee that if such excellent bonding can be replicated with much higher success, such interfaces must be considered as an excellent candidate toward the development of next generation of advanced TIMs.
Supplementary Material
Supplementary materials can be viewed in this issue of the Journal of Materials Research by visiting http://journals.cambridge.org/jmr.
ACKNOWLEDGMENTS
S.G. acknowledges support through U.S. Air Force Contract No. FA8650-05-5052. Authors also acknowledge additional support from Air Force Office of Scientific Research (Task 2302BR7P, Program manager: Dr. Byung-Lip Lee).