Introduction
One of the main constraints leading to low productivity in pasture areas is the lack of knowledge regarding the morphophysiological responses of forage plants to environmental variations and imposed management (Carvalho et al., Reference Carvalho, Martuscello, Almeida, Braz, Cunha and Jank2017). Forage grasses use tillering as a means of growth, increased productivity, and, above all, survival of the plant community in established pastures (Hodgson, Reference Hodgson1990).
Tillering depends on water balance, soil water retention capacity, soil fertility, canopy light interception, solar radiation, and ambient temperature (Sousa et al., Reference Sousa, Rizato, Fagundes, Fontes, Backes, Oliveira Júnior, Cruz and Nascimento2019). Limitation of one or more of these environmental factors, or inappropriate grazing management targets, may restrict regrowth capacity and, consequently, forage production (Veras et al., Reference Veras, Difante, Gurgel, Graciano da Costa, Gomes Rodrigues, Marques Costa, Emerenciano Neto, Pereira Md and Ramon Costa2020). Therefore, it is important to understand tillering dynamics by investigating changes in tiller density, survival, and mortality parameters, as well as morphogenic rhythms, so that management practices can be defined to ensure pasture longevity, productivity, and sustainability throughout the year (Gastal and Lemaire, Reference Gastal and Lemaire2015; Souza et al., Reference Souza, Difante, Emerenciano Neto, Lana, da Silva Roberto and Ribeiro2019).
The ability of pastures to maintain or increase leaf and tiller populations under different management strategies reflects, among other traits, the phenotypic plasticity of forage plants. The maximum time to leave pastures in the regrowth phase should correspond to the moment when the canopy intercepts 95% of incident light (Barbosa et al., Reference Barbosa, Nascimento Junior and Euclides2007; Carnevalli et al., Reference Carnevalli, Silva, Bueno, Uebele, Bueno, Hodgson, Silva and Morais2006). However, under environmental instability and frequent dry spells (Habermann et al., Reference Habermann, Oliveira, Contin, Costa, Costa and Martinez2022), pastures often take too long to reach the 95% LI target, disrupting grazing rotations and farm logistics. It is therefore essential to evaluate more frequent defoliation regimes, to identify flexible management ranges that maintain animal flow and forage supply without compromising the system’s longevity.
The ‘BRS Zuri’ guinea grass [Megathyrsus maximus (Jacq.) B.K. Simon & S. W. L Jacobs (syn. Panicum maximum Jacq.)], developed under the coordination of the Brazilian Agricultural Research Corporation (EMBRAPA), is a tufted grass with tall, erect growth, broad leaves, thick stems, and late flowering (Jank et al., Reference Jank, Santos and Braga2022). Although it shows seasonal forage production, BRS Zuri tends to emit a lower proportion of stems outside the reproductive period when managed under 95% LI, maintaining a favourable canopy architecture for efficient light interception and high leaf-to-stem ratio, which optimizes both biomass quality and animal intake.
The tested hypothesis was that increased grazing frequency (lower pre-grazing LI levels) does alter tillering dynamics and tissue flow in BRA Zuri guinea grass. The objective was to evaluate the effect of four grazing frequencies, represented by pre-grazing light interception (IL) levels of 80%, 85%, 90%, and 95% LI, on tillering dynamics and the expression of morphogenic and structural characteristics of BRS Zuri pastures under intermittent stocking.
Materials and methods
Experimental site and period
The experiment was conducted at Embrapa Beef Cattle, Campo Grande, MS. The area is located at latitude 20º27’ S, longitude 54º37’ W, and an altitude of 530 m above sea level. The experimental period was from October 2020 to April 2022.
Climate, soil, and fertilization
The regional climate is tropical savanna (Aw subtype), with seasonal rainfall distribution. Temperature and precipitation data were collected from the Embrapa Beef Cattle meteorological station. Based on monthly average temperature and accumulated monthly precipitation, the experimental water balance was calculated (Figure 1), using a soil water storage capacity (CAD) of 150 mm.
Water balance, monthly precipitation, historical monthly precipitation, and maximum, minimum, and average temperatures during the experimental period.

The experimental soil is classified as Nitossolo Vermelho Distrófico Latossólico (Santos et al., Reference Santos, Jacomine, Anjos, Oliveira, Lumbreras, Coelho, Almeida, Araujo Filho, Lima, Marques, Oliveira and Cunha2025) according to the Brazilian Soil Classification System (SiBCS), corresponding to a Dystric Nitisol in the FAO system. Soil samples were collected at depths of 0–10 cm and 0–20 cm for fertility analysis. Soil chemical analysis results for the 0–10 cm layer showed pH (CaCl2) of 4.9, phosphorus content of 6.3 mg/dm3, and organic matter of 4.0%. Potassium, calcium, and magnesium contents were 0.3, 2.6, and 1.9 cmol/dm3, respectively, while aluminium was 0.3 cmol/dm3 and potential acidity (H + Al) was 5.8 cmol/dm3. The sum of bases (S) was 4.8 cmol/dm3, cation exchange capacity (T) was 10.7 cmol/dm3, base saturation (V%) was 45.1%, aluminium saturation (m%) was 5.2%, and clay content was 8.3%.
At 0–20 cm depth, pH (CaCl2) was 4.8, phosphorus content was 5.0 mg/dm3, and organic matter was 3.6%. Potassium, calcium, and magnesium contents were 0.1, 2.4, and 1.7 cmol/dm3, respectively, with aluminium of 0.4 cmol/dm3 and potential acidity (H + Al) of 5.3 cmol/dm3. The sum of bases (S) was 4.7 cmol/dm3, cation exchange capacity (T) was 9.7 cmol/dm3, base saturation (V%) was 44.1%, aluminium saturation (m%) was 4.8%, and clay content was 13.1%.
Based on soil chemical analysis and pasture use system, fertilization was applied with 60 kg/ha of P2O5 and 60 kg/ha of K2O using the 0-20-20 (N-P-K) formulation, and maintenance fertilization with 150 kg/ha/year of N, split into three applications of 50 kg/ha. Nitrogen fertilization was applied at the end of each grazing cycle, after animal removal. Urea was used for the first and the second applications, and ammonium sulphate for the last.
Experimental area and design
BRS Zuri guinea grass pastures were established in 2017. The experimental area of 0.96 ha was divided into four blocks, each subdivided into four paddocks of 0.045 ha. Pastures were managed under intermittent stocking since October 2019, using the mob grazing technique (Mislevy et al., Reference Mislevy, Mott and Martin1981). Grazing intensity was kept constant at 50% of canopy height for all treatments. The experimental design was randomized complete blocks with four treatments, represented by pre-grazing light interception (IL) levels of 80%, 85%, 90%, and 95% IL, and four replications. Treatments were imposed from October 2020.
Pastures were clipped in October 2020 to an average residual height of 35 cm. After clipping, pastures were managed according to the established light interception treatments. Grazing cycles until March 30, 2021, were considered year 1 (summer 20/21). Due to the water deficit from April to October, the pastures did not reach the target LI thresholds for grazing. Consequently, the first grazing cycle achieved by each treatment after this period (recorded in November) was used as a representative response for the 2021 winter (dry) season. The first cycle of each treatment after the dry period (April–October) was considered the winter 2021 response cycle. Subsequent cycles until 22 April 2022 were considered year 2 (summer 21/22). The winter of 2022 was not included in the analysis as the study’s primary goal was to compare the structural stability and adaptation strategies across two full productive cycles under varying environmental conditions during the active growth phase.
Grazing management
To determine grazing frequency based on LI, a canopy analyser (AccuPAR Linear PAR/LAI ceptometer, Model PAR–80; DECAGON Devices) was used to estimate LI by the canopy at 10 representative points per paddock. At each point, one reading was taken above and one below the canopy, at soil level. Concurrently with LI measurements, canopy height was measured using a graduated ruler at 20 points per paddock. The average height corresponding to the LI targets was considered the pre-grazing height and used to determine post-grazing residual height targets.
Caracu breed heifers approximately 24 months old were used for grazing. Animals remained in a reserve area (4.0 ha of Massai grass) until each paddock reached the pre-grazing targets. Instantaneous stocking rate was adjusted based on pre-grazing forage mass, one-day occupation period, and the post-grazing residual height targets.
Morphogenesis variables
Morphogenesis was evaluated on five tillers per paddock, totalling 20 tillers per treatment, identified with coloured threads. Tillers were marked after animal removal and assessed weekly until the next pre-grazing cycle. Measurements included height from soil to ligule of the last fully expanded leaf, extended tiller height, leaf length (elongation/expansion), quantification of green portion in senescent leaves, and number of live leaves (NLL). From these data, leaf appearance rate (LAR), leaf elongation rate (LER), stem elongation rate (SER), leaf senescence rate (LSR), number of live leaves (NLL), leaf lifespan (LLS), and phyllochron (PHYL) were calculated according to Chapman and Lemaire (Reference Chapman and Lemaire1993).
Tillering dynamics
Tillering dynamics were evaluated under pre-grazing conditions, on three tussocks per paddock. In the first assessment, all tillers of each tussock were marked with threads of the same colour, considered the first generation. Marking was repeated each grazing cycle, with new tillers marked with different colours to identify new generations. Dead tiller threads were removed and counted for each generation.
Based on these data, the following variables were calculated as proposed by Bahmani et al. (Reference Bahmani, Thom and Matthew2003): tiller appearance rate (TAR) = number of new tillers (last marked generation)/total existing tillers (previously marked generation) × 100; tiller mortality rate (TMR) = number of previously marked tillers – surviving tillers (current count)/total tillers in previous period × 100; tiller survival rate (TSR = 1-TMR). The tiller population stability index (TSI) was calculated using the equation: TSI = TSR (1 + TAR). TSI was considered stable when TSI = 1, decreasing when TSI < 1, and increasing when TSI > 1. To enable comparisons between treatments with varying grazing intervals, all demographic rates were standardized to a 30-day basis. This standardization was performed by dividing the calculated rates (TAR, TMR, and TSR) by the number of days in their respective grazing interval and then multiplying by 30.
Forage accumulation
Forage accumulation (FA) was calculated as the difference between forage mass at pre-grazing and post-grazing of the previous cycle, considering only the green portion (leaf and stem). The grazing interval (GI) was calculated as the average time (days) required for the forage to reach pre-grazing targets after animal removal. Forage accumulation rate (FAR) was calculated by dividing FA by GI.
Statistical analysis
Data were collected in each grazing cycle and the results were grouped into year 1 (October 2020 to March 2021) and year 2 (October 2021 to March 2022). Data were subjected to analysis of variance considering a randomized block design, LI and year and their interactions as fixed effects and blocks as random effects. The model applied was:
 $Yijk = {\rm\mu} + Bj + IPi + Yk + \left( {IP*Y} \right) + aijk$
where Yijk = observed value in cultivar under light interception i, block j, year k; μ = overall mean effect; Bj = effect of block (1, 2, 3 and 4); IPi = effect of light interception i (i = 80, 85, 90 and 95%); Yk effect of year (year 1 and year 2); IP * Y = Effect of light interception x effect of year interaction and αijk = random error effect attributed to the i-th light interception, j-th block and k-th year.
Year was considered a fixed effect because the effects of year and interactions with year were of interest due to the different precipitation patterns (Figure 1). In the case of significant interactions, the means were compared by the probability of difference by Tukey’s test at the 5% probability level. When the interaction was not significant, the light intercept was evaluated using regression equations using the REG procedure. Both linear and quadratic models were tested, and the model was selected based on the significance of the regression coefficients, adopting a 5% probability level. The experimental year was compared by Tukey’s test at the 5% probability level. All the data were subjected to analysis of variance using the PROC MIXED procedure in the Statistical Analysis System software (SAS© OnDemand for Academics).
Results
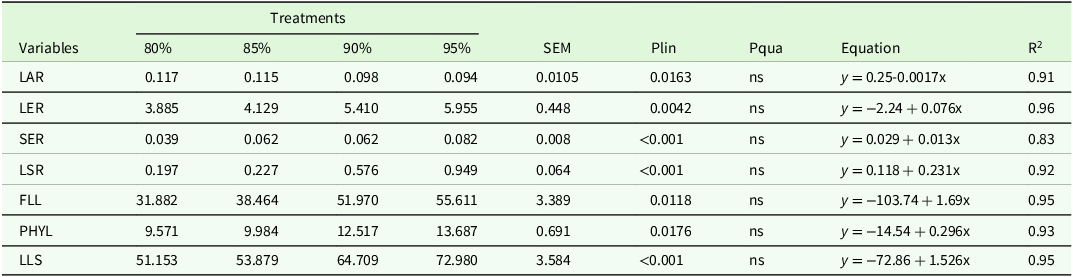
There was no interaction between LI and year, nor a year effect for the variables LAR (p = 0.0707), LER (p = 0.2058), SER (p = 0.1391), LSR (p = 0.2847), PHYL (p = 0.5024), and LLS (p = 0.8056). There was an effect of LI for all analysed variables (Table 1), except for NLL, which averaged 5.52 leaves/tiller. LAR fitted a decreasing regression equation, with a reduction of 0.0017 leaves/tiller/day as LI increased by 5%. The other variables fitted increasing linear equations with increments of 0.076, 0.013, 0.231, 1.694, 0.296, and 1.526 for LER (cm/tiller/day), SER (cm/tiller/day), LSR (cm/tiller/day), FLL (cm), PHYL (days), and LLS (days), respectively.
Morphogenic variables of BRS Zuri as a function of light interception levels in the pre-grazing condition

LAR: Leaf appearance rate (leaves/tiller/day); LER: Leaf elongation rate (cm/tiller/day); SER: Stem elongation rate (cm/tiller/day); LSR: Leaf senescence rate (cm/tiller/day); FLL: Final leaf length (cm); PHYL: Phyllochron (days); LLS: Leaf lifespan; SEM: Standard error of the mean; Plin: p-value linear equation; Pqua: p-value quadratic equation; R2: coefficient of determination.
There was an interaction between LI and year for FLL (p = 0.0003), with an increase of 1.159 cm in year 1 and 2.212 cm in year 2 as LI increased (Table 2). The highest FLL for pastures managed at 80% and 85% LI was observed in year 1 (34.30 and 41.24 cm, respectively), while for those managed at 90% and 95% LI, there was no year effect.
Final leaf length (FLL) of BRS Zuri as a function of light interception levels and evaluation year

SEM: Standard error of the mean; Plin: p-value linear equation; Pqua: p-value quadratic equation; R2: coefficient of determination.
There was no interaction between LI and year for TAR (p = 0.0536), nor an effect of LI, only a year effect. The highest TAR was in year 1 (0.6934 tillers) and lowest in year 2 (0.4247 tillers).
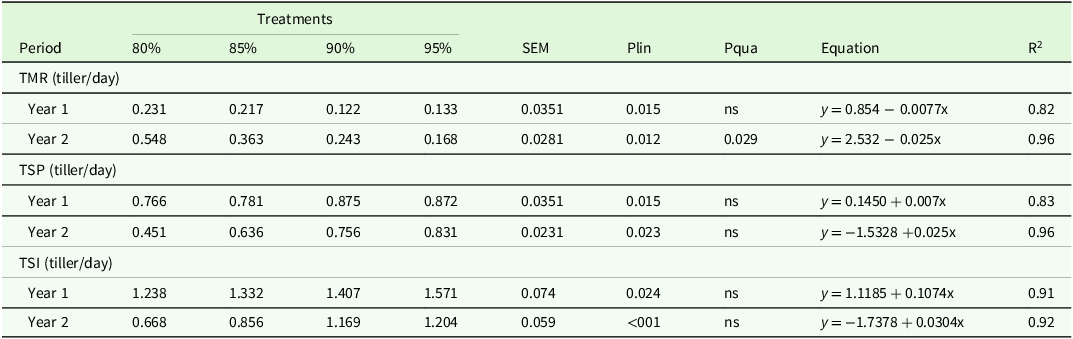
There was an interaction between LI and year for TMR, TSR, and TSI (p < 0.0001). TMR fitted decreasing linear regression equations, with reductions of 0.007 in year 1 and 0.025 in year 2 as LI increased (Table 3). For pastures managed at 80%, 85%, and 90% LI, TMR was higher in the second year, while for those managed at 95% LI, there was no difference between years (Table 3). TSR showed the same pattern as TMR in relation to year. For LI, there were increases of 0.007 and 0.025 in tiller survival as canopy LI increased.
Tillering dynamics of BRS Zuri pastures as a function of light interception levels and year

TMR: Tiller mortality rate; TSR: Tiller survival rate; TSI: Tiller population stability index; SEM: Standard error of the mean; Plin: p-value linear equation; Pqua: p-value quadratic equation; R2: coefficient of determination.
TSI increased by 0.1074 in year 1 and 0.0304 in year 2 with increasing of LI. For all treatments, TSI was lower in the second year (Table 3).
TSI in pastures managed at 80% LI was less stable and decreased over the two years (Figure 2), with the highest TSI in February 2021 (1.382) and lowest in January 2022 (0.589).
Tiller stability index of BRS Zuri pastures as a function of light interception levels over two years.

In pastures managed at 85% LI, TSI was below 1 in year 2, with a minimum of 0.7860 in February 2022. Pastures managed at 90% and 95% LI had maxima in February 2021 (TSI of 1.759 and 1.504) and minima in November 2021 (0.980 and 0.994), respectively.
Tillering demography shows the number of generations and tillers per generation for each management. Pastures managed at 80% LI had 13 generations with an average of 33 new tillers per tussock/generation, maintaining an average of 114 tillers per tussock (Figure 3).
Tillering demography of BRS Zuri pastures managed under light interception levels during two years.

Pastures managed at 85% LI had 11 generations over two years, with an average of 44.5 new tillers per generation and 135 tillers per tussock. For 90% LI, the average was 52 new tillers per generation and 140 tillers per tussock. For 95% LI, the average was seven generations, 53 new tillers per generation, and 133 tillers per clump.
There was no interaction between LI and year for FAR (p = 0.4204), but there was an effect of LI (p < 0.0001) and year (p = 0.0061) independently. The effect of LI fitted a quadratic regression equation, with a maximum at 90% LI (Figure 4A). Year 2 showed an increase in FAR of 17.7% (18.14 kg/ha DM day− 1) compared to year 1 (Figure 4B).
Forage accumulation rate (FAR) in BRS Zuri pastures as a function of pre-grazing light interception levels (A) and year (B).

Discussion
The higher leaf appearance rate (LAR) observed in pastures managed under lower light interception (LI) levels (Table 1) reflects a morphogenetic response to the light environment within the canopy. Shorter grazing intervals maintain a more open structure, increasing the Red:Far-Red (R:FR) ratio and blue light availability at the plant base. These physiological signals trigger faster leaf appearance to optimize light capture (Gastal and Lemaire, Reference Gastal and Lemaire2015).
The opposite pattern is observed under 90% and 95% LI, where LAR tends to decrease while LER and FLL increase. This response is driven by both morphological and physiological factors. In tropical forages, higher LI targets promote significant pseudostem elongation, increasing the distance that a developing leaf must travel from the apical meristem to the whorl of the preceding leaf (Silva Neto et al., Reference Silva Neto, Souza, Zanine, Abreu, Ferreira, Toral, Alves, Castro and Pinho2018). This longer ‘tube’ increases the time required for leaf emergence, reducing LAR, while the lower R:FR ratio triggers a shade-avoidance response that accelerates LER to optimize photosynthesis (Gastal and Lemaire, Reference Gastal and Lemaire2015).
The increase in phyllochron (PHYL) as LI levels rise (Table 2) reinforces the inverse relationship between grazing interval and leaf appearance rate (Rodrigues et al., Reference Rodrigues, Difante, Gurgel, Veras, da Costa, Pereira, Neto and Costa2021). This pattern was confirmed by our results, as higher LI targets reduced LAR while increasing PHYL and LLS, a physiological trade-off also documented by Carvalho et al. (Reference Carvalho, Pereira, Sbrissia, Rocha and Santos2021) in tropical grasses. Furthermore, the increment in LER under higher LI directly reflects in greater FLL (Table 2), enabling the plant to position its leaf area in better-illuminated upper layers (Garcia et al., Reference Garcia, Silva, Geremia, Goulart, Dias and da Silva2021). This suggests that total leaf elongation per tiller is primarily driven by the expansion of longer individual leaves (Costa et al., Reference Costa, Jank, Magalhães, Rodrigues and Santos2019) rather than a high frequency of emergence (Junges et al., Reference Junges, Gomes, Candido, Ítavo, Ítavo, Coelho, Difante, Santos and Dias2024). This pattern, therefore, explains the higher LER and FLL values under higher LI (Zanine et al., Reference Zanine, Neto, Ferreira, Santos, Parente, Parente, Santos, Campos, Sousa, Reis, Olivera-Viciedo and Rodrigues2025; Tables 1 and 2).
In the long term, such responses represent morphological plasticity of plants – an adaptive mechanism that reduces the likelihood of defoliation and increases grazing resistance (“ Briske, Reference Briske, Hodgson and Illius1996; Alves et al., Reference Alves, Cirino Júnior and Rocha2021). The reduction in FLL observed in the second year for pastures managed at 80% and 85% LI may indicate a structural adjustment to the more frequent presence of the defoliating agent.
Patterns of LER and leaf senescence rate (TSF) (Table 1) were consistent with previous reports (Sbrissia et al., Reference Sbrissia, Duchini, Zanini, Santos, Padilha and Schmitt2018), indicating that higher LER in taller canopies may be accompanied by higher SR. This balance between elongation and senescence can stabilize forage accumulation (Mocelin et al., Reference Mocelin, Schmitt, Zanini, Camacho and Sbrissia2022), leading to similar forage accumulation rates (FAR) across contrasting growth strategies (Duchini et al., Reference Duchini, Guzatti, Ribeiro Filho and Sbrissia2014). The higher FAR observed at 90% LI (Figure 4A) supports the existence of an equilibrium point during regrowth in which leaf and pseudostem elongation occur with limited senescence.
Pasture tillering dynamics and morphogenetic and structural traits are strongly influenced by both climatic conditions (light, temperature, and water) (Barbosa et al., Reference Barbosa, Silva and Pedreira2021) and management practices (Casagrande et al., Reference Casagrande, Ruggieri, Janusckiewicz, Gomide, Reis and Valente2010). Analysis of the TSI (Figure 2) and tillering demographics (Figure 3), in association with water balance (Figure 1), reveal that pastures managed under higher frequencies (80% and 85% LI) showed more unstable tiller populations, sensitive to soil moisture and temperature variations. Neither treatment maintained SI above 1 in the second year, indicating population instability (Bahmani et al., Reference Bahmani, Thom and Matthew2003).
In year 1, water conditions were more favourable, even below historical averages (Figure 1), coinciding with nitrogen fertilization, which promoted high LAR. However, in the following year, pastures managed at 80% and 85% LI failed to regain stability, remaining with SI below 1 until the end of the study (Figure 2). Giustina Júnior et al. (Reference Giustina Junior, Zanella, Baldissera, Pinto, Garagorry and Sbrissia2019) emphasize that, under ideal conditions, pastures maintain stability through high tillering rates during the growing season, which was not observed in this experiment.
Pastures under 90% and 95% LI maintained stable tiller survival rates (TSR) between years, while those managed at 80% and 85% LI showed lower TSR in the second year, coinciding with reduced TAR. This pattern suggests that more intense defoliation levels (80% and 85% LI) may impose a higher nitrogen demand to sustain active tillering and compensate for frequent tissue removal. It is hypothesized that the maintenance fertilization applied (150 kg ha− 1 N), while typically adequate for cultivars of the species Megathyrsus maximus, may not have met the requirements for maintaining tiller population stability under such high grazing frequencies, particularly in the second year.
Despite soil fertility correction and split nitrogen fertilization, grazing events after N application resulted in significant reductions in tiller population (Figure 3). Until November 2021, unfavourable water conditions limited the emergence of new tiller generations, reducing stability in the most intensive treatments. As highlighted by Giorello et al. (Reference Giorello, Sbrissia and Da Silva2021), when edaphic and climatic factors are adequate, grazing management becomes the main determinant of pasture productivity, quality, and persistence. Thus, the instability observed under 80% and 85% of the LI suggests that intensive management requires greater attention to soil fertility and water balance, since nitrogen fertilization alone may not compensate for the negative effects of frequent grazing.
Pastures managed under 90% and 95% LI maintained greater persistence of first-generation tillers (Figure 3), whereas those under 80% and 85% did not maintain them until the end of the experimental period. Based on the results obtained, the higher TSR and lower mortality rates (TMR) observed in the 90% and 95% LI treatments indicate greater tiller longevity, while the more intensive managements (80% and 85% LI) reduced tiller lifespan.
Since pasture productivity results from the forage accumulation of both individual tillers and the tiller population, any defoliation regime that reduces the FAR while increasing mortality should be considered inadequate, as it compromises canopy persistence. Therefore, pasture sustainability depends on the balance between tiller emergence, survival, and senescence – a dynamic equilibrium strongly influenced by grazing intensity and frequency.
Conclusion
Different grazing frequencies affect the morphogenesis and tillering of the Megathyrsus maximus cultivar BRS Zuri. The continuous use of high grazing frequencies (80% and 85% LI) combined with 50% removal proves inadequate for system sustainability. However, these strategies may be applied occasionally during transition periods or for canopy structural adjustment without compromising pasture persistence.
Pastures managed with light interception targets of 90% and 95% exhibit more stable tiller generations, associated with higher leaf elongation rates and longer final leaf lengths. Adopting the 90% LI target as a flexible management strategy allows regrowth to be interrupted before excessive pseudostem accumulation and intensified senescence, maintaining a balance between forage production and quality.
Acknowledgements
The authors gratefully acknowledge the support of the Federal University of Mato Grosso do Sul Foundation through the Graduate Program in Animal Science, Embrapa Beef Cattle, the Brazilian Coordination for the Improvement of Higher Education Personnel (CAPES) – Finance Code 001, the National Council for Scientific and Technological Development (CNPq), and the Foundation for the Support of the Development of Education, Science, and Technology of the State of Mato Grosso do Sul (FUNDECT).
Author contributions
GSD, DBM, VPBE, ARA and AFS conceived and designed the study. JGR, MGP and GOAM conducted data gathering. JCSS and LCVI performed statistical analyses. JGR and MGP wrote the article.
Funding statement
This research received no specific grant from any funding agency, commercial or not-for-profit sectors.
Competing interests
The authors declare there are no conflicts of interest.
Ethical standards
The use of animals in this research was approved by the Animal Use Ethics Committee (CEUA) of Embrapa Beef Cattle under protocol number 003/2018.