

Highlights
-
• Largest to date study of relationship between ABO blood groups and carotid atherosclerosis.
-
• Collected total plaque area and carotid stenosis data through ultrasound technology.
-
• Found no correlation between atherosclerosis and ABO blood group, so modifiable risk factors should continue to be prioritized when preventing atherosclerosis.
Introduction
The recognition of the ABO blood-group system in 1901 was pivotal to providing patients with reliable and safe transfusions. Studies report that blood types can be associated with differences in health outcomes and disease progression, including vascular disease. Reference Zakai, Judd and Alexander1–Reference Wang, Zhou and Zhu3 However, existing literature surrounding the association between ABO blood group and vascular disease is inconsistent. Some studies report an association between ABO group and thrombotic events such as stroke, coronary artery disease and peripheral artery disease. Reference Zakai, Judd and Alexander1,Reference Wang, Zhou and Zhu3 However, other studies report no such association. Reference Huang, Zou, Li, Chen, Hou and Yu4 Moreover, only a few studies have assessed the association between atherosclerosis and ABO group, for example, patients undergoing angiography. Reference Gong, Luo and Li5,Reference Karabuva, Carević, Radić and Fabijanić6
The current study was designed to assess the association between blood groups and the burden of carotid atherosclerosis measured as total plaque area and carotid stenosis, in cases with and without vascular disease using the largest database to date at the Stroke Prevention and Atherosclerosis Research Centre (SPARC).
The biological plausibility for an association between ABO blood group and carotid atherosclerosis is supported by both thrombotic and genetic pathways. Studies have found that non-O blood groups are associated with higher levels of both von Willebrand factor (VWF) and factor VIII, which are both thrombotic factors that increase the risk of vascular disease and atherosclerosis. Reference Albánez, Ogiwara and Michels7 Furthermore, ABO antigens are also expressed on vascular endothelium, influencing inflammation, endothelial function and lipid metabolism. Reference Larson, Bell and Decker8 These mechanisms form the biological rationale for comparing ABO blood groups with atherosclerosis.
The clinical relevance of this study is that the results can provide more evidence of whether or not ABO blood types are a risk factor for atherosclerosis, a surrogate measure for the risk of cardiovascular disease (CVD). This can help consolidate some of the conflicting findings in the literature. The driving hypothesis of this study arises from the conflicting evidence regarding the effect of ABO blood types on the total plaque area. If the null hypothesis is rejected, more awareness can be put toward preventative screening measures and atherosclerotic treatments for specific blood groups. If the null hypothesis is accepted, the focus should continue to be centered toward preventing modifiable risk factors such as smoking, hypertension and diabetes.
Methods
Ethics and data sharing
The study was approved by the University of Western Ontario Research Ethics Board (REB #107051). Data can be shared upon the approval of the Ethics Board.
Study population
The study population was gathered from the SPARC patient database, which is a part of the London Health Sciences Centre. This large database holds information for approximately 60,000 patients residing in Southwestern Ontario, Canada. The study population were all patients that were referred to stroke prevention clinics by their primary care providers to prevent the incidence of vascular disease. Each of the patients were scheduled for regular yearly ultrasound appointments to assess for stenosis in the carotid arteries. In this retrospective study, 3855 patients completed a consent form that indicated that their ultrasound data could be used for primary research as long as their identifying information remained confidential. However, 46 ultrasound reports were not found, so 3809 patients were analyzed (Figure 1). All of the information for these patients in this retrospective cohort spans from 1985 to 2021.
Participant flow diagram of SPARC patients included in the study. SPARC = Stroke Prevention and Atherosclerosis Research Centre.

Ultrasound methodology
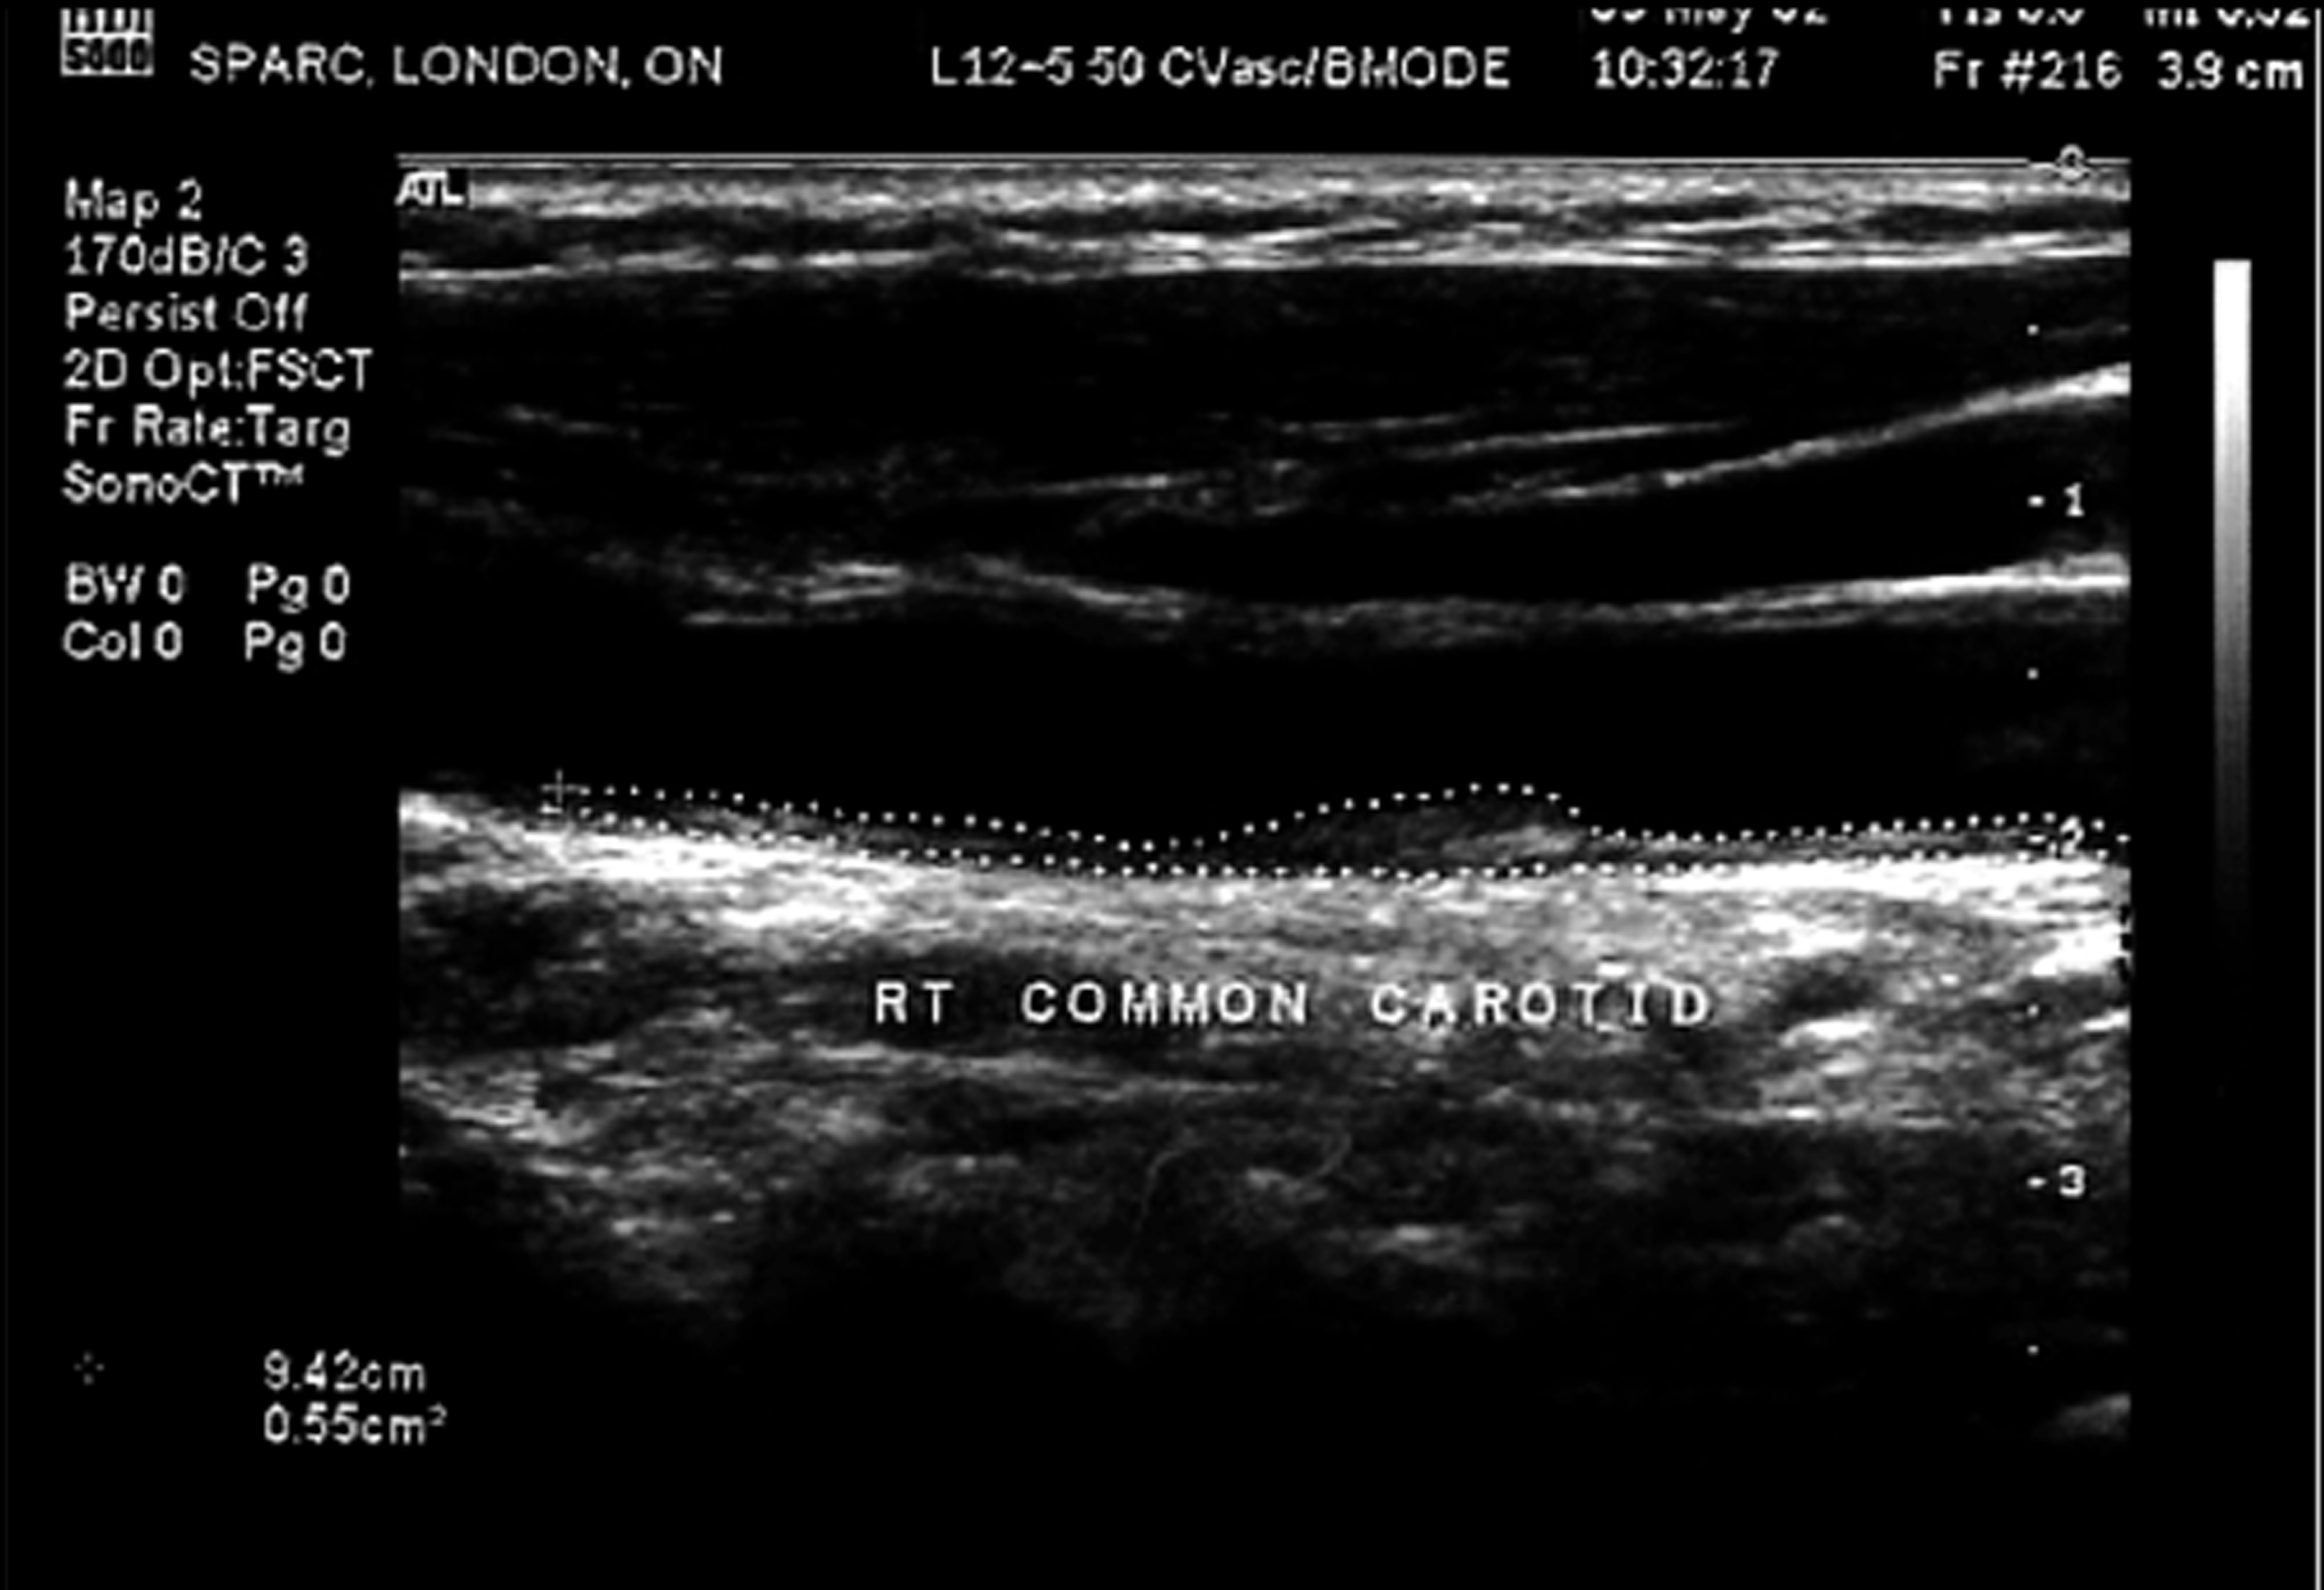
Patients in this study underwent bilateral Doppler ultrasounds for their carotid arteries each year. These vascular ultrasounds were completed by trained technicians in the SPARC clinic. Total plaque area is measured and visualized in both the left and right carotid arteries through the ultrasounds and is used as a surrogate marker for atherosclerosis. Total plaque area was used as a direct indicator of disease burden, since previous studies have found that it provides a quantifiable index for atherosclerosis that robustly correlates with clinical outcomes. Reference Spence, Eliasziw, DiCicco, Hackam, Galil and Lohmann9 The total plaque area is measured in cm2 and is recorded both manually on ultrasound reports by the technician and electronically (Figure 2).
Ultrasound image of right common carotid artery from SPARC with measured total plaque area of 0.55 cm2. Reference Spence18 SPARC = Stroke Prevention and Atherosclerosis Research Centre.

The peak systolic velocity (PSV) of both the left and right internal carotid arteries were also recorded. PSV measurement is performed according to standardized guidelines, with the technician optimizing Doppler angle (≤60°), sample volume, gain settings and recording PSV at the peak systolic upstroke using validated protocols. A trained ultrasonographer transcribed the machine-generated PSV values onto printed ultrasound reports, which were then analyzed in this study. In this study, PSV was used as a surrogate marker for stenosis, since it is positively correlated with the narrowing of the arteries. As the lumen in the artery narrows due to atherosclerotic plaque, the blood flow velocity increases to compensate, which makes a higher PSV value indicative of stenosis. Reference Saba, Scicolone and Johansson10 We applied a PSV threshold of 125 cm/s to differentiate between normal or minimal stenosis and mild-to-moderate internal carotid artery stenosis. This cutoff aligns with the criteria proposed by the Society of Radiologists in Ultrasound Consensus Conference, which has been widely adopted in clinical practice. Reference Grant, Benson and Moneta11 Accordingly, in this study, we used a PSV of 125 cm/s as the operational threshold for stenosis classification to ensure consistency with institutional standards and evidence-based guidelines.
Data collection
Covariate data such as BMI, hypertension, diabetes and smoking history were all extracted from the SPARC’s electronic medical records. Both structured data such as lab values, medication lists and vitals measurements as well as narrative reports like physician notes were reviewed by two trained investigators independently for all 3855 cases. Any discrepancies in the data were resolved through consensus with a third trained investigator. For BMI, adjudication was done through clinic-measured values rather than being self-reported. In this study, hypertension was defined by consistent clinical blood pressures of ≥140/90 mmHg, recorded diagnosis of hypertension in medical records or use of antihypertensive medication. Past studies by Spence et al. used this methodology to adjudicate their covariate data. Reference Spence, Eliasziw, DiCicco, Hackam, Galil and Lohmann9 Smoking exposure was assessed using total pack-years, which is a zero-inflated variable due to the inclusion of never-smokers. Although this may affect distributional assumptions, smoking was included only as an adjustment covariate and did not significantly influence the primary results.
Two experienced investigators recorded the quantitative ultrasound data, while also providing a second revision for each patient to reduce the likelihood of transcription error. After that, the investigators recorded whether there was the presence of vascular disease or risk factors through analyzing the patient’s electronic records.
Vascular disease was defined through a documented history of stroke, transient ischemic attacks, coronary artery disease and peripheral artery disease. According to the World Health Organization, stroke is defined as rapid onset of neurological impairments that lasts over 24 hours or leads to death. Furthermore, there can be no other cause of these symptoms other than vascular pathologies. Transient ischemic attack is defined as a transient episode of neurological impairment that causes focal ischemia to the brain, spinal cord and retina without acute infarction. Coronary artery disease is defined as a documented history of either myocardial infarction, angina, coronary artery bypass grafting and coronary artery stenting. Peripheral artery disease is any atherosclerotic disease of the peripheral arteries that were confirmed through clinical examination or diagnostic imaging. Any history of peripheral vascular interventions such as endarterectomies, angioplasties, bypass surgeries and stenting were also classified as peripheral vascular disease.
Vascular disease state was stratified because patients with established vascular disease often demonstrate a more aggressive and unstable phenotype of plaque, even when matched for total plaque area or degree of luminal stenosis. Interpreting vascular history can help contextualize varying clinical implications, despite similarities in total plaque area. Both investigators inputted the data for all of the patients to ensure further accuracy and limit the effect of random error.
Sample size and power calculation
The work’s power to detect a difference was calculated by getting the effect size of blood types on ABO types from a study by Huang et al. Reference Huang, Zou, Li, Chen, Hou and Yu12 This effect size of 0.1 was measured using the difference in total plaque area between the different ABO blood types. Given our large sample size (n = 3809), a post hoc power analysis of multiple linear regressions with seven covariates, effect size = 0.1 and α = 0.05 has a power of >99%, which means this study has adequate power.
Statistical analysis
Data are presented as mean ± standard deviation (SD) for normally distributed variables and median with interquartile range (IQR) for non-normally distributed variables.
In addition to descriptive comparisons, unadjusted differences in total plaque area and carotid stenosis across the four ABO groups (A, B, AB and O) were examined using one-way ANOVA and Kruskal–Wallis tests, and categorical outcomes such as carotid stenosis ≥ 50% and TPA ≥ 1.19 cm2 were compared using chi-square tests. All analyses under multiple imputation were performed per imputed dataset and pooled using Rubin’s rules to obtain valid standard errors, confidence intervals and p-values.
Quantile regression was also undertaken as a complementary method to evaluate the association between ABO blood group and different quantiles (25th, 50th and 75th percentiles) of TPA, with pooled estimates across imputations reported. Quantile regression models the conditional distribution of the outcome at different quantiles (25th, 50th and 75th percentiles), rather than focusing solely on the mean. Given the right-skewed nature of atherosclerotic plaque volume, this approach provides a more robust assessment of how predictors behave across the entire distribution.
The four-level ABO factor was used for unadjusted comparisons, whereas the binary contrast O versus non-O, based on prior biological literature, was used in adjusted models.
In a previous study, we reported that those with total plaque area >1.19 cm2 are at a high risk of stroke, myocardial infarction or vascular mortality; a 19.5% risk over 5 years. Reference Spence, Eliasziw, DiCicco, Hackam, Galil and Lohmann9 Therefore, we performed a logistic regression analysis to assess the association between ABO and total plaque area ≥1.19 cm2. All data was adjusted for age, sex, diabetes, body mass index, mean arterial blood pressure, hyperlipidemia and smoking (total pack-years).
To assess the association between carotid stenosis and blood group, we used logistic regression carotid (carotid stenosis considered as a binary variable, defined as case with stenosis ≥50% vs. <50%). Blood group O was the reference group. Data were again adjusted for age, sex, diabetes, body mass index, mean arterial blood pressure, hyperlipidemia and smoking (total pack-years). This analysis was repeated in those with and without vascular disease.
We performed all statistical analyses using SPSS, version 26 (SPSS Inc., Chicago, IL, USA). A p-value < 0.05 was considered statistically significant.
Results
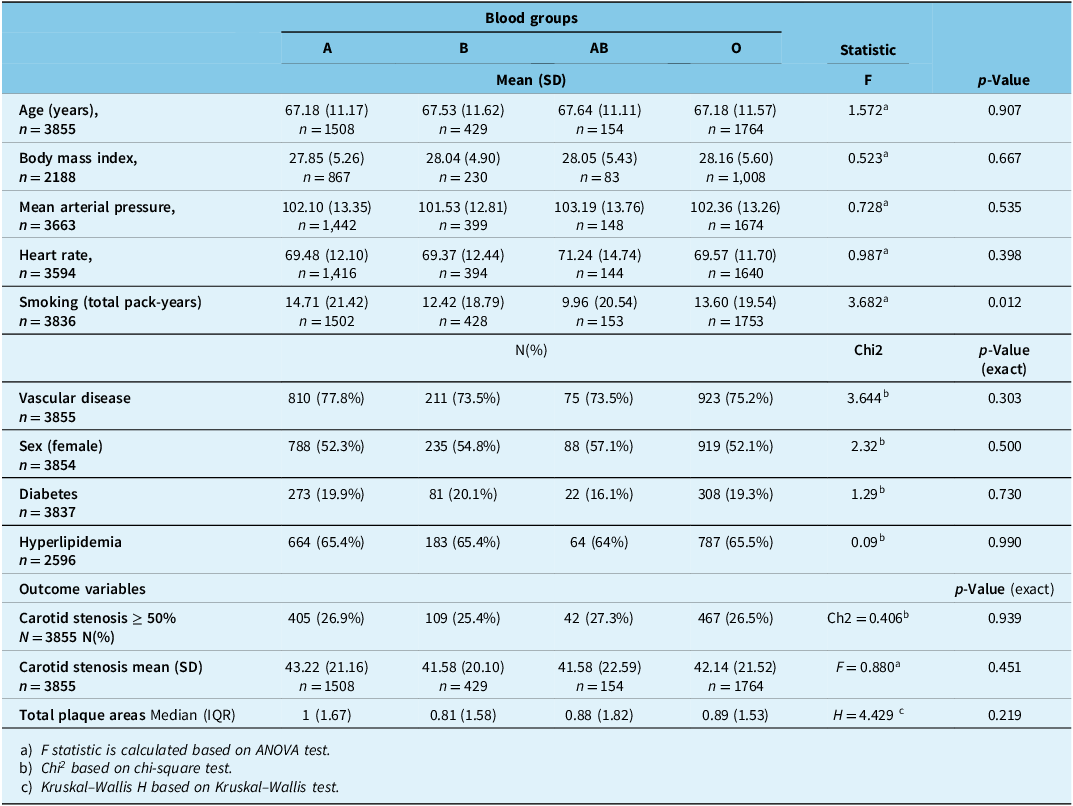
Baseline demographic data related to ABO blood groups and the risk of atherosclerosis were analyzed for a total of 3855 cases, 1825 men (mean age: 67.95 ± 11.86) and 2030 women (age 66.59 ± 10.92 years). Demographic data and baseline characteristics based on blood groups are summarized in Table 1. Ultrasound findings were unavailable for 46 cases, leaving us with 3809 cases for analysis. There were no significant differences in demographic variables and risk factors, except for smoking which was more prevalent in group A (p = 0.012) (Table 1).
Demographic characteristics of 3855 SPARC cases, according to their blood groups

SPARC = Stroke Prevention and Atherosclerosis Research Centre.
aChi square test.
bOne-way ANOVA.
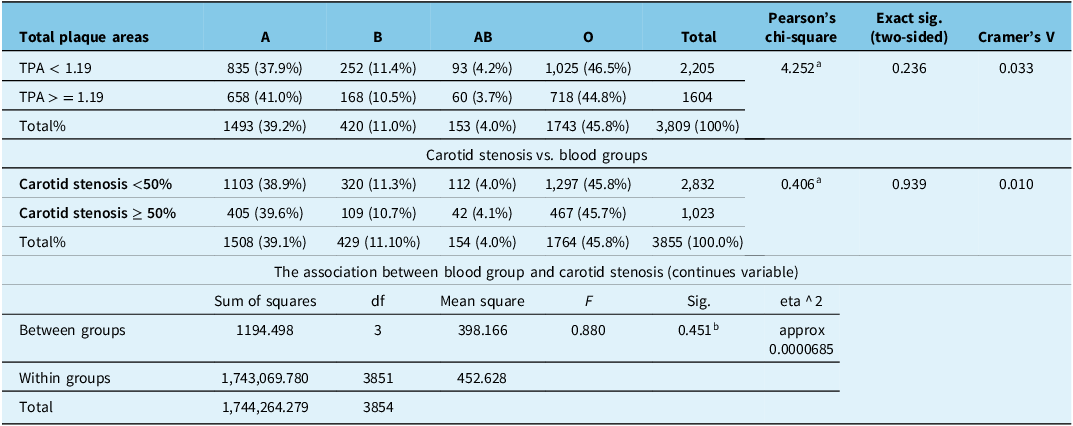
Unadjusted associations between ABO blood group, total plaque area and carotid stenosis are shown in Table 2. In unadjusted analyses across the four ABO groups, neither total plaque area nor carotid stenosis differed significantly by blood group. One-way ANOVA for TPA yielded F = 1.703 with p = 0.164, and the Kruskal–Wallis test gave H = 4.429 with p = 0.219. Likewise, chi-square tests showed no association between ABO group and stenosis ≥50% (χ 2 = 0.406, p = 0.939) or TPA ≥ 1.19 cm Reference Chen, Yang, Xu and Li2 (χ 2 = 4.252, p = 0.236).
The association between TPA/carotid stenosis and blood groups

TPA = total plaque area (as a binary variable).
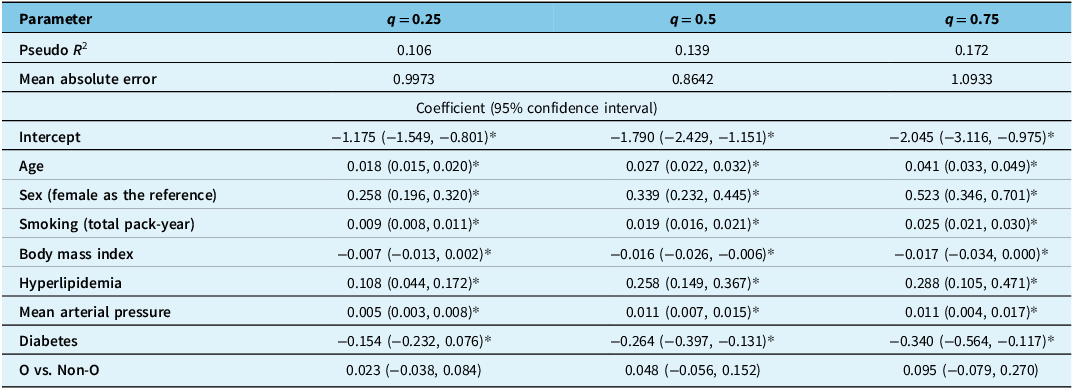
Quantile regression analyses, pooling results across imputations, similarly showed no significant association between ABO blood group and TPA at the 25th, 50th or 75th percentiles in the overall sample or in subgroups with and without established CVD, supporting the robustness of the null findings (Table 3). Similar results were found in subgroups with and without established CVD (Supplementary Tables 1A and 1B), supporting the robustness of the null findings.
The association between the burden of atherosclerosis (total plaque area) and blood group: results of quantile regression analysis

Note: * represents statistically significant. The p < 0.05 was considered significant.
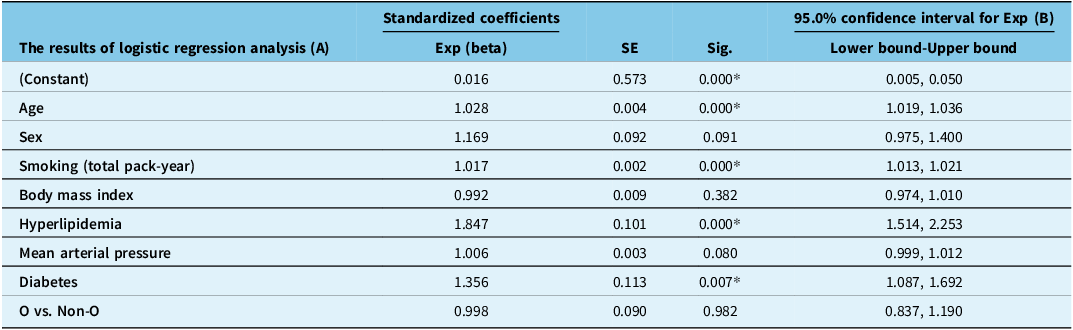
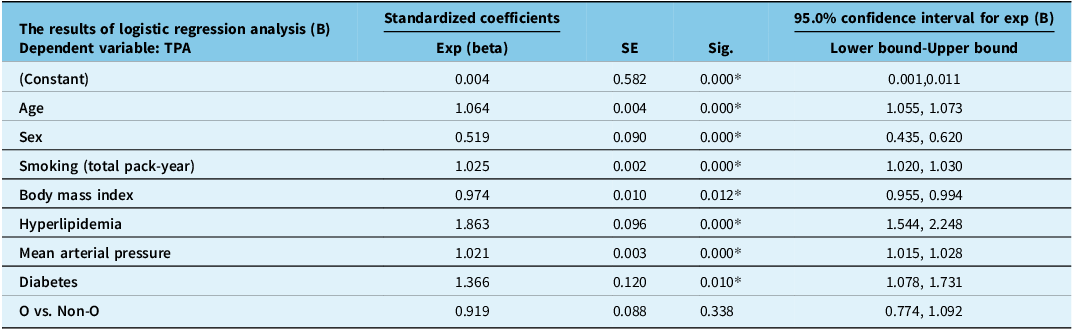
In multivariable models, the binary contrast O versus non-O did not show a significant association with continuous TPA, with TPA ≥ 1.19 cm2 or with stenosis ≥50% and did not reveal any association between ABO group (Tables 4 and 5). Receiver operating characteristic analyses for the dichotomized outcomes demonstrated limited discrimination, with AUC = 0.56 (95% CI 0.53–0.59) for TPA ≥ 1.19 cm Reference Chen, Yang, Xu and Li2 and AUC = 0.55 (95% CI 0.52–0.58) for stenosis ≥50%. The modest AUC values (0.56 and 0.55) indicate limited discriminative ability (<0.60), which underscores the predictive utility of ABO blood groups for total plaque area and carotid stenosis. Thresholds for dichotomization were clinically motivated and based on established risk cutoffs associated with meaningful increases in vascular events.
The association between the carotid stenosis and blood group: results of logistic regression analysis for pooled data

Note: * represents p < 0.05.
The association between the burden of atherosclerosis defined as cases with total plaque area >= 1.19 cm2 and blood group: results of logistic regression analysis for pooled data

TPA = total plaque area as a binary variable.
Note: * represents statistically significant at p < 0.05.
Consistent with prior work suggesting only modest or indirect effects of ABO blood group on thrombotic risk, our null findings for both mean TPA and its distributional quantiles, together with the low AUC values for dichotomized outcomes, indicate that ABO group is not a clinically useful discriminator of carotid plaque burden in this cohort. These results emphasize the predominance of traditional, modifiable vascular risk factors over ABO genotype in determining atherosclerotic plaque burden.
Discussion
We found no significant association between the burden of atherosclerosis defined as total plaque area or carotid stenosis, and blood groups (O vs. non-O groups). Furthermore, in subgroup analyses based on age, and the presence or absence of vascular disease at baseline, we also found no significant association of blood groups with carotid atherosclerosis.
Many studies in the past have reported an association between blood types and vascular disease. Reference Karabuva, Carević, Radić and Fabijanić6 However, only a few assessed the relationship of atherosclerosis specifically with the ABO blood-group system, and findings were inconsistent. Reference Zakai, Judd and Alexander1,Reference Gong, Luo and Li5,Reference Karabuva, Carević, Radić and Fabijanić6 Gong et al. reported from a Chinese cohort study of 2919 cases with coronary angiography that blood group A was an independent risk factor for severe atherosclerosis (measured by the Gensini score). Reference Gong, Luo and Li5 That study utilized quartile-based analysis, rather than assessing atherosclerosis as a continuous variable. Reference Gong, Luo and Li5 In an observational study in Croatia of 646 patients with coronary artery disease, Karabuva et al. reported no association between ABO blood groups and the extent of coronary atherosclerosis. Reference Karabuva, Carević, Radić and Fabijanić6 Our study assessed total plaque area as both a continuous and discrete variable, as well as assessing percent stenosis; we suggest that this approach provides a stronger assessment of atherosclerosis..
Wang et al., using coronary artery calcium (CAC) scores, reported that blood group was an independent risk factor for coronary atherosclerosis. Reference Wang, Zhou and Zhu3 The authors used a binary classification of CAC (CAC = 0 (n = 197) and those with CAC > 0 (n = 104). However, in addition to a significantly higher sample size in our database, we used total plaque area as a continuous variable, which is more powerful in terms of data analysis. Reference Bland and Altman13 Our findings are in the line with studies reporting no association between ABO blood groups and atherosclerosis. Reference Karabuva, Carević, Radić and Fabijanić6,Reference Bakker, Valentijn and Hoeks14 Stenosis is different from total plaque area with regard to the atherosclerosis process; it can be regarded as the result of plaque rupture and thrombosis. As an example, lipoprotein(a) is a risk factor that is associated with carotid stenosis and occlusion, independent of total plaque area. Reference Klein, Hegele, Hackam, Koschinsky, Huff and Spence15 In the current study, we did not find any association between blood groups and severity of carotid stenosis as a categorical or binary variable. The major strengths of our study include access to the burden of atherosclerosis using both plaque burden and severity of stenosis. This large dataset provided us with the statistical power to analyze our data as a binary variable. To our knowledge, this is the first large-scale study to analyze the association between ABO blood groups and carotid artery atherosclerosis burden, incorporating patients with established vascular disease and disease-free patients. Furthermore, total plaque area serves as a useful tool for identifying high-risk patients in clinical medicine and was our method of choice for measuring atherosclerosis. Reference Spence, Eliasziw, DiCicco, Hackam, Galil and Lohmann9 Unlike earlier studies, our sample size allows us to perform subgroup analyses based on age, presence/absence of vascular disease and both stenosis and burden of atherosclerosis.
Our study has some limitations. Some studies showed that the association between ABO and vascular disease may be related to varying levels of factor VIII and VWF. Reference Ward, O.’Sullivan and O’Donnell16 Our dataset did not have access to VWF and factor VIII levels. SPARC data are not population-based. However, about 40% of our patients are referred for primary prevention and are representative of older adults in our community. Reference Hoiland, Fergusson and Mitra17 Furthermore, the distribution of blood groups within our dataset supports the generalizability of our study as it was diverse, yet similar to that in the Canadian population: 49.6% of Canadians have blood group O, 34.7% have blood group A, 11.8% have blood group B and 3.9% have blood group AB. Reference Spence18
Conclusion
We conclude that blood groups are not associated with severity of atherosclerosis. Prevention methods at public level should focus more on controlling risk factors and healthy lifestyle.
Supplementary material
The supplementary material for this article can be found at https://doi.org/10.1017/cjn.2026.10599.
Acknowledgments
None.
Author contributions
The roles of each author in this study have been outlined using Contributor Roles Taxonomy (CRediT) and are provided using author initials only.
J.C. – Conceptualization, data curation, investigation, methodology, resources, supervision, validations, visualization, writing – original draft and writing – review and editing.
Ad.S. – Conceptualization, formal analysis, investigation, methodology, validation and writing – original draft.
J.D.S. – Conceptualization, investigation, project administration, supervision and writing – review and editing.
Az.S. – Data curation, formal analysis, investigation, software and validation.
D.G.H. – Data curation, formal analysis, investigation, software and validation.
M.R.A. – Conceptualization, investigation, project administration, supervision and writing – review.
Funding statement
This research did not receive any specific grant from funding agencies in the public, commercial or not-for-profit sectors.
Competing interests
None.
Patient consent
Patient consent forms have been obtained for this article.