



1. Introduction
Shock wave/turbulent boundary layer interaction (SBLI) has been investigated extensively since the last century due to its significant importance in aerospace industries (Délery, Marvin & Reshotko Reference Délery, Marvin and Reshotko1986; Dolling Reference Dolling2001; Babinsky & Harvey Reference Babinsky and Harvey2011; Ligrani et al. Reference Ligrani, McNabb, Collopy, Anderson and Marko2020; Liu et al. Reference Liu, Cheng, Jiang, Lu, Zhang and Zhang2022). When a supersonic turbulent boundary layer flow encounters a shock wave, the strong adverse pressure gradient induces abundant flow features, such as low-frequency unsteadiness (Clemens & Narayanaswamy Reference Clemens and Narayanaswamy2014), acoustic radiations (Bernardini, Pirozzoli & Grasso Reference Bernardini, Pirozzoli and Grasso2011), local flow separation (Babinsky & Harvey Reference Babinsky and Harvey2011) and vortex shedding (Andreopoulos, Agui & Briassulis Reference Andreopoulos, Agui and Briassulis2000; Tong et al. Reference Tong, Yu, Tang and Li2017; Fang et al. Reference Fang, Zheltovodov, Yao, Moulinec and Emerson2020). Despite this active research field going on for decades, there remain many open questions. For the oblique SBLI, supersonic flows over a compression corner and the impinging oblique shock wave on the turbulent boundary layers are two widely studied flow configurations. It has been proved that they share similar above-mentioned features within the interaction zone (Babinsky & Harvey Reference Babinsky and Harvey2011), with the latter free from the effects of the concave wall.
1.1. Turbulence amplification and coherent structures
One of the interesting phenomena in SBLI flows is ‘turbulence amplification’. Early experimental studies (e.g. Smits & Muck Reference Smits and Muck1987; Zheltovodov, Lebiga & Yakovlev Reference Zheltovodov, Lebiga and Yakovlev1989) showed that in supersonic flows over compression corners, where an oblique shock emerges due to the mean flow compression, the Reynolds stress is amplified. As the turning angle of the corner increases, the stronger compression leads to the increment of the pressure gradient, further resulting in higher amplification rates. Rose & Childs (Reference Rose and Childs1974) pointed out that the turbulence amplification is similar to the incompressible turbulent boundary layer flows under adverse pressure gradients. However, due to the compressibility effects, the turbulence amplification was believed to be caused by more than the adverse pressure gradient. Smits & Muck (Reference Smits and Muck1987) postulated that multiple plausible flow features might be responsible, such as the low-frequency shock motions, the direct shock wave/turbulence interaction (Zheltovodov et al. Reference Zheltovodov, Lebiga and Yakovlev1989), the generation of acoustic and entropy waves (Anyiwo & Bushnell Reference Anyiwo and Bushnell1982), the shear layer induced by the flow separation (Rose & Childs Reference Rose and Childs1974; Selig et al. Reference Selig, Andreopoulos, Muck, Dussauge and Smits1989), and the curvation of the streamlines (Andreopoulos et al. Reference Andreopoulos, Agui and Briassulis2000). The direct numerical simulations (DNS) by Wu & Martin (Reference Wu and Martin2007, Reference Wu and Martin2008) confirmed that the turbulence amplification can be attributed to the nonlinear coupling of vorticity, entropy, and the ‘pumping’ of turbulent fluctuations from the mean flow.
Owing to the advancement of experimental technologies and the enrichment of computational resources, some of the less important factors have been excluded (Fang et al. Reference Fang, Zheltovodov, Yao, Moulinec and Emerson2020). The shear layer related to the SBLI (referred to as the ‘mixing layer’ by some studies), is attributed primarily to the turbulence amplification. Dupont and coworkers have conducted a series of experiments on supersonic turbulent boundary layers impinged by an oblique shock wave (OSBLI) (Dupont et al. Reference Dupont, Haddad, Ardissone and Debieve2005, Reference Dupont, Piponniau, Sidorenko and Debiève2008; Dupont, Haddad & Debieve Reference Dupont, Haddad and Debieve2006). It was identified that the large-scale structures are formed near the end of the interaction zone where the shear layer reattaches, and are convected further downstream. The shear layer within the interaction zone shares commonalities with the compressible free shear layer, such as the spatial growth rate, entrainment velocity and turbulent shear stress, and their variation with the Mach number (Dupont, Piponniau & Dussauge Reference Dupont, Piponniau and Dussauge2019). Pirozzoli & Grasso (Reference Pirozzoli and Grasso2006) and Pirozzoli & Bernardini (Reference Pirozzoli and Bernardini2011a) investigated the OSBLI flows by DNS at the free-stream Mach number  $2.3$ and shock angle
 $33.2^{\circ }$, where the flow separation within the interaction zone is mild. The turbulence amplification is reckoned to be related to the shear layer, which thickens downstream due to the turbulent diffusion. The peaks of the Reynolds normal and shear stresses are located away from the wall in the outer region. The turbulence in the inner region returns to the equilibrium state quickly downstream, while the recovery to the equilibrium state in the outer region is not achieved even at the end of the computational domain. The vortex shedding adjacent to the separation zone induces the large-scale low-frequency unsteadiness downstream of the interaction zone. Dupont et al. (Reference Dupont, Piponniau, Sidorenko and Debiève2008) and Helm, Martin & Dupont (Reference Helm, Martin and Dupont2014) further confirmed this conclusion and stated that the existence of reverse flow and inflexional velocity profiles causes the Kelvin–Helmholtz instability, further leading to the development of large convective eddies. Pirozzoli, Bernardini & Grasso (Reference Pirozzoli, Bernardini and Grasso2010) studied the transonic SBLI flows, where the shock wave is close to normal. Similar to OSBLI flows, when passing the impinging shock, the turbulence is amplified, the shear layer is developed and the shedding vortical structures are observed. In contrast to the OSBLI flows, they found that the streamwise velocity fluctuations are less affected compared with the cross-stream velocity fluctuations.
The exact mechanisms of the turbulence amplification are hard to trace from the chaotic turbulent fields. In this regard, the analysis of the turbulent kinetic energy (TKE) transport equation has shed some interesting light on this complicated phenomenon. Li et al. (Reference Li, Fu, Ma and Liang2010) showed that in the supersonic turbulent flow over a compression ramp, the TKE production term increases rapidly within the separation zone, while the dissipation is significant only close to the wall. The energy transport is balanced by the mean flow convection and turbulent diffusion. Pirozzoli & Bernardini (Reference Pirozzoli and Bernardini2011a) provided similar descriptions for OSBLI flows. The maximum of the production term aligns with the mid-line of the shear layer within the interaction zone, due to the lift-up of vortical structures. Jammalamadaka, Li & Jaberi (Reference Jammalamadaka, Li and Jaberi2014) analysed the TKE and enstrophy transport equations along the sonic line. They proposed that the TKE amplification is caused by the increment of the TKE production and that the enstrophy amplification by the vortex stretching. The terms related to the compressibility effects, on the other hand, are negligible. Tong et al. (Reference Tong, Yu, Tang and Li2017) conducted DNS for compression ramp flows at different turning angles, and found that the TKE transport in SBLI flows differs slightly from canonical wall-bounded turbulence in the small turning angle cases, while it is altered significantly by the shear layer above the separation bubble in the large turning angle cases. They also observed the destruction of low-speed streaks in the near-wall region and the emergence of the large-scale eddies adjacent to the shear layer. Humble, Scarano & Van Oudheusden (Reference Humble, Scarano and Van Oudheusden2007) and Fang et al. (Reference Fang, Zheltovodov, Yao, Moulinec and Emerson2020) decomposed the TKE production term into the effects of mean flow deceleration and shear, based on which a novel mechanism for turbulence amplification was proposed. They attributed the turbulence amplification to the mean flow deceleration in the early stage, and the shear layer when it is well-developed. For the currently considered SBLI flows, the flows within the interaction zone are generally in non-equilibrium states (Pirozzoli et al. Reference Pirozzoli, Bernardini and Grasso2010; Zuo et al. Reference Zuo, Memmolo, Huang and Pirozzoli2019), hence the TKE budget would be effective in revealing the mechanism of turbulent amplification.
In another aspect, the physical counterparts of turbulence amplification are usually visible in the instantaneous fields. For flows over compression ramps, the Görtler vortices, the congenital secondary flows in turbulence over concave walls due to centrifugal instability (Saric Reference Saric1994), are partially responsible for the amplification of turbulence (Loginov, Adams & Zheltovdov Reference Loginov, Adams and Zheltovdov2006). Priebe, Wu & Martin (Reference Priebe, Wu and Martin2009) reported that the amplification rates in OSBLI flows are lower than those in the compression corner flows, which was attributed to the lack of the obvious streamline deflection. However, in some recent numerical (Pasquariello, Hickel & Adams Reference Pasquariello, Hickel and Adams2017) and experimental (Humble, Scarano & Van Oudheusden Reference Humble, Scarano and Van Oudheusden2009; Zhuang et al. Reference Zhuang, Tan, Li, Sheng and Zhang2018) studies, it was argued that the large-scale quasi-streamwise vortices bear certain similarities to the Görtler vortices, which are referred to as the ‘Görtler-like vortices’. Pasquariello et al. (Reference Pasquariello, Hickel and Adams2017) suggested the centrifugal instability induced by the streamline curvation to be a plausible mechanism for their generation. Zhuang et al. (Reference Zhuang, Tan, Li, Sheng and Zhang2018) confirmed this idea by experiments. They further ascribed the neglect of the Görtler-like vortices in previous experiments to the long time period of oil-flow experiments such that those Görtler-like vortices are averaged out in the spanwise direction. Fang et al. (Reference Fang, Zheltovodov, Yao, Moulinec and Emerson2020) observed that the near-wall low-speed streaks of the incoming turbulence are twisted within the interaction zone and regenerated downstream, less organized. Large-scale velocity streaks start to evidence near the shear layer in the outer region, and gradually decay downstream. Similar phenomena were also observed in transonic SBLI flows (Pirozzoli et al. Reference Pirozzoli, Bernardini and Grasso2010), where the near-wall low-speed streaks are suppressed near the interaction zone and regenerated downstream at approximately five interaction length scales. Among the few research works that provided the spanwise spectra, a recent experimental study by Baidya et al. (Reference Baidya, Scharnowski, Bross and Kähler2020) found that the two energetic motions are prominent at large spanwise scales, which persist for a long streamwise extent.
As summarized previously, it is recognized that the turbulence amplification is caused by the mean flow deceleration and the shear layer, that the peaks of velocity fluctuation intensity are located with the shear layer downstream, and that the emergence of the large-scale structures is more or less related to the turbulence amplification. However, the association between turbulence amplification and the emergence of large-scale motions remains unclear. To unveil the direct link between these two phenomena, we propose to analyse the scale-by-scale TKE transport utilizing the TKE spectra transport equation. This will enable us to separate some of the flow features at certain length scales and investigate them individually, which will probably benefit our comprehension of this matter.
1.2. Spectral analysis of TKE transport in wall-bounded turbulence
The TKE spectra transport equation can be obtained by performing Fourier transforms on the transport equation of two-point correlation in the statistically homogeneous directions. Both of these equations have been applied to investigate the energy cascade in incompressible wall-bounded turbulence since the last century (Lumley Reference Lumley1964; Domaradzki et al. Reference Domaradzki, Liu, Härtel and Kleiser1994). In recent years, this topic has been brought up again to reveal the inter-scale energy transfer in high-Reynolds-number channel flows. Lee & Moser (Reference Lee and Moser2015) analysed the TKE transport with the streamwise and spanwise spectra. The turbulent transport term is decomposed into turbulent diffusion in the wall-normal direction, and inter-scale energy transfer, whose integration is zero in spectral space. Inverse energy transfer from small- to large-scale motions in the buffer layer is observed in the spanwise TKE spectra. By integrating the turbulent diffusion term, Mizuno (Reference Mizuno2016) found that the upward turbulent transport provides energy to small-scale motions, while the large-scale downward energy fluxes bring energy to the near-wall region. Considering the statistical homogeneity in the streamwise and spanwise directions, Lee & Moser (Reference Lee and Moser2019) further analysed the spectra of TKE transport under the polar coordinate for the turbulent channel flow at  $Re_\tau =5200$. They found that the energy is transferred from the dominant streamwise very-large-scale motions to other velocity components via nonlinear interactions, and dissipated isotropically at small scales. Cho, Hwang & Choi (Reference Cho, Hwang and Choi2018) performed triadic wave interaction analysis to investigate the nonlinear interaction. Two new types of highly active inter-scale energy transfer processes in the near-wall region are found: from large to small scale by the interaction of large-scale and the adjacent small-scale motions, and from small to large scale by the downward energy transfer. Hamba (Reference Hamba2019) further related the inverse energy cascade to the tilting of the streamwise vortices via conditional average.
On a more related subject, Auléry et al. (Reference Auléry, Toutant, Bataille and Zhou2015, Reference Auléry, Dupuy, Toutant, Bataille and Zhou2017) derived the TKE spectra transport equation for flows with mean temperature variation, which can be regarded as the weakly compressible turbulence with negligible viscous dissipation. To incorporate the mean property variations caused by the mean temperature gradient in the definition of TKE spectra, the governing equation of the density-weighted velocity  $v_i=\sqrt {\rho }\,u_i$ was derived, based on which the TKE spectra transport equation of
 $v_i$ was obtained. The turbulent, pressure and viscous transport terms were split into the in-plane and inter-plane terms, consisting of only the derivatives in the wall-parallel and wall-normal directions, respectively. For the channel flow between a hot wall and a cold wall, in which the mean temperature gradient is significant, the total energy is transferred from the hot side to the cold side in the wall-normal direction, and the wall-parallel inter-scale energy transfer qualitatively resembles that in the canonical channel flows (Auléry et al. Reference Auléry, Dupuy, Toutant, Bataille and Zhou2017). Dupuy, Toutant & Bataille (Reference Dupuy, Toutant and Bataille2018a,Reference Dupuy, Toutant and Batailleb) derived the TKE spectra transport equation relying on the insignificance of the density fluctuations in Morkovin's hypothesis. Therefore, the obtained equation is similar to that of the incompressible flows. However, in the presently considered flow, the density fluctuation may contribute largely to the kinetic energy near the shock wave. It is therefore inappropriate to adopt this method as well. Arun et al. (Reference Arun, Sameen, Srinivasan and Girimaji2021) derived the scale-space energy density transport equation for compressible inhomogeneous turbulent flows. They showed their work in detail on how to define the two-point correlation and energy density, and how to derive their transport equations. They further analysed the energy transfer in scale space for compressible mixing layer flows, and identified the scaling of the energy density function related to the self-similar evolution.
1.3. Outline of the present study
The primary goal of this paper is to explore the association between the turbulence amplification and the genesis of large-scale structures within the interaction zone in OSBLI flows. Considering the spanwise periodicity and homogeneity, we derive the TKE spectra transport equation from the spanwise two-point correlation transport equation. The scrutinization of the budget of the TKE spectra transport provides a scale-by-scale depiction of the energy production and transfer, which will benefit our understanding of the related physical processes.
The remainder of this paper is arranged as follows. The physical model, numerical implements and validations are introduced in § 2. The transport equations of two-point correlation and TKE spectra are derived in § 3 as the mathematical tools for analyses. The coherent structures in the instantaneous fields and the TKE amplification are discussed briefly in § 4 to compare with the conclusions in previous studies. The TKE spectra distribution is presented in § 5 to relate the emergence of large-scale motions and turbulence amplification. The energy transfer process for finite spanwise scale motions and the spanwise uniform motions are revealed in §§ 6 and 7, respectively. Concluding remarks are given in § 8.
2. Numerical settings and validation
2.1. Physical model and numerical settings
The sketch of the physical model and computational domain is depicted in figure 1. We simulate the fully-developed supersonic turbulent boundary layer impinged by an oblique shock wave. The mean velocity profile of the incoming turbulence is described according to Musker (Reference Musker1979), and the velocity fluctuations are generated by the synthetic digital filtering approach (Klein, Sadiki & Janicka Reference Klein, Sadiki and Janicka2003). The mean temperature and temperature fluctuations are given according to the generalized Reynolds analogy (Zhang et al. Reference Zhang, Bi, Hussain and She2014). The oblique shock is generated at the top boundary by imposing the inviscid Rankine–Hugoniot jump condition to simulate the effect of a wedge shock generator with deflection angle  $8^{\circ }$. The generated shock angle is
 $33.2^{\circ }$, and the impingement point is
 $x_{imp}=30\delta _{in}$ (where
 $\delta _{in}$ is the nominal boundary layer thickness at the inlet). The upper and outflow boundaries are enforced by non-reflecting conditions (Pirozzoli & Colonius Reference Pirozzoli and Colonius2013). At the lower wall, no-slip and no-penetration conditions are applied for velocity, and the isothermal condition is applied for temperature, with the wall temperature set as the recovery temperature
 $T_w=1.92 T_\infty$ to achieve a quasi-adiabatic thermal boundary condition. Periodic conditions are applied in the spanwise direction.
Sketch of physical model and computational domain.

We solve directly the three-dimensional Navier–Stokes equations for compressible Newtonian gas with the finite difference method. The DNS are performed with the open-source ‘STREAmS’ solver developed by Bernardini et al. (Reference Bernardini, Modesti, Salvadore and Pirozzoli2021), which has been validated widely for solving compressible channel, boundary layer, and especially OSBLI flows (e.g. Bernardini et al. Reference Bernardini, Asproulias, Larsson, Pirozzoli and Grasso2016; Volpiani, Bernardini & Larsson Reference Volpiani, Bernardini and Larsson2020). The convective terms are approximated by the sixth-order kinetic-energy-preserving scheme (Pirozzoli Reference Pirozzoli2010), and switched to the fifth-order WENO scheme (Jiang & Shu Reference Jiang and Shu1996) near strong flow compression, which is identified by the criterion of Ducros et al. (Reference Ducros, Ferrand, Nicoud, Weber, Darracq, Gacherieu and Poinsot1999). The viscous terms are cast as Laplacian forms and approximated by the sixth-order central difference scheme. Time advancement is achieved by Wray's three-stage third-order scheme (Wray Reference Wray1990).
The free-stream Mach number of the inflow is set as  $M_\infty = 2.28$, and the Reynolds number is set as
 $Re_{in}= \rho _\infty U_\infty \delta _{in} / \mu _\infty =12\,000$, with
 $\rho _\infty$,
 $U_\infty$ and
 $\mu _\infty$ denoting the free-stream density, velocity and dynamic viscosity coefficients, and
 $\delta _{in}$ the nominal thickness of the incoming boundary layer. The sizes of the computational domain in the streamwise (
 $x$), wall-normal (
 $y$) and spanwise (
 $z$) directions are
 $(L_x, L_y, L_z) = (60 \delta _{in}, 12 \delta _{in}, 6.5 \delta _{in})$, respectively. The computational domain is discretized by
 $(2000, 320, 240)$ grids in the three directions. The grids are uniformly distributed in the
 $x$ and
 $z$ directions, with the mesh intervals under the viscous scales (defined below) being
 $\Delta x^{+} \approx 5.4$ and
 $\Delta z^{+} \approx 4.9$. In the wall-normal direction, the grids are stretched by a hyperbolic-sine function within
 $y=2.5\delta _{in}$, with the first off-wall grid located at
 $\Delta y^{+}_w \approx 0.7$, and uniformly distributed above it, with grid interval
 $\Delta y^{+} \approx 7.0$. According to the DNS performed by Volpiani, Bernardini & Larsson (Reference Volpiani, Bernardini and Larsson2018) under roughly the same flow parameters and numerical conditions, the grid intervals in the present study are fine enough to obtain accurate results.
The statistics are averaged in the spanwise direction with 900 instantaneous flow fields over the period  $600 \delta _{in} / U_\infty$. To further obtain smoother statistics, the average in the streamwise direction is also adopted across 11 grids, within which the streamwise variation of the mean flow is insignificant, even inside the interaction zone. The ensemble average of a generic variable
 $\varphi$ is denoted as
 $\bar \varphi$, and the corresponding fluctuation by
 $\varphi '$, the density-weighted average (or Favre average) by
 $\tilde \varphi$, and the corresponding fluctuation
 $\varphi ''$.
2.2. Basic flow statistics and validation
We take the streamwise location at  $x=15.0 \delta _{in}$ as the reference plane (denoted by
 $x_0$), where the turbulence is free from the impact of the impinging shock wave. The statistical properties at
 $x_0$ (hereinafter denoted by the subscript
 $0$) are listed in table 1. The friction Reynolds number
 $Re_\tau$ is defined as
 \begin{equation} Re_\tau = \frac{\rho_w u_\tau \delta_0} {\mu_w}, \end{equation}
with
 \begin{equation} u_\tau = \sqrt{\frac{\tau_w}{\rho_w}},\quad \tau_w = \left.\mu_w\,\frac{\partial \bar u}{\partial y } \right|_w, \end{equation}
where  $\rho _w$ and
 $\mu _w$ denote the mean density and dynamic viscosity on the wall, and
 $\tau _w$ denotes the mean wall shear stress. The displacement and momentum thicknesses, denoted as
 $\delta ^{*}$ and
 $\theta$, are defined as
 \begin{equation} \delta^{*} = \int_0^{\delta} \left( 1- \frac{\bar \rho \bar u} {\rho_\infty U_\infty} \right) {\rm d} y,\quad \theta = \int_0^{\delta} \frac{\bar \rho \bar u}{\rho_\infty U_\infty} \left( 1- \frac{\bar u}{ U_\infty} \right) {\rm d} y . \end{equation}
The incompressible boundary layer thicknesses, denoted by  $\delta ^{*}_i$ and
 $\theta _i$, along with the incompressible shape factor
 $H_i$, are defined accordingly by setting the mean density ratio as unity.
Statistical properties at the reference plane  $x=15.0 \delta _{in}$. Here,
 $C_f = 2 \tau _w / (\rho _\infty U^{2}_\infty )$,
 $Re_{\theta 0} = \rho _\infty U_\infty \theta _0 / \mu _\infty$,
 $Re_{\delta 2, 0} = \rho _\infty U_\infty \theta _0 / \mu _w$,
 $H_0 = \delta ^{*}_0 / \theta _0$ and
 $H_{i0} = \delta ^{*}_{i0} / \theta _{i0}$.

The van-Driest-transformed mean velocity and Reynolds stress under viscous scales in (2.2a,b) are defined as
 \begin{equation} u^{+}_{VD} = \int^{\bar u^{+}}_0 \sqrt{\frac{\bar \rho}{ \rho_w}}\,{\rm d} \bar u^{+},\quad R^{*}_{ij} = \frac{\overline{\rho u''_i u''_j}}{\tau_w}, \end{equation}
where the superscript  $+$ represents the normalization by
 $u_\tau$ as incompressible flows. The distributions at
 $x_0$ are displayed in figure 2 against the wall-normal coordinate under viscous scale
 $y^{+}=y\,Re_\tau /\delta _0$, and compared with those of supersonic turbulent boundary layers at
 $M_\infty =2.0$ and
 $Re_\tau \approx 200$ reported by Pirozzoli & Bernardini (Reference Pirozzoli and Bernardini2011b). The wall-normal distributions of both the mean velocity and Reynolds stress in the present study agree reasonably well with the reference, indicating the validity of the current results. It also suggests that the turbulence at the reference station
 $x_0$ is fully developed.
Wall-normal distributions of (a) van-Driest-transformed mean velocity and (b) Reynolds stress. Lines indicate results at  $x_0=15 \delta _{in}$; symbols indicate reference data in Pirozzoli & Bernardini (Reference Pirozzoli and Bernardini2011b) at
 $M_0 =2.0$,
 $Re_\tau \approx 200$.

We further report the skin friction coefficient  $C_f$ and mean wall pressure
 $\bar p_w$ distribution along the streamwise (
 $x$) direction, with the former defined as
 \begin{equation} C_f = \frac{2\tau_w}{\rho_\infty U^{2}_\infty}. \end{equation}
The subsequent results will be reported under the scaled interaction coordinate, i.e.  $x^{*} = (x-x_{imp})/\delta _0$ and
 $y^{*}=y/\delta _0$, as usually adopted in SBLI flow analysis. The streamwise distribution of
 $C_f$ is presented in figure 3(a). It can be identified that the streamwise locations of the flow separation and reattachment points are
 $x^{*}_s \approx -2.60$ and
 $x^{*}_r \approx -0.73$, where
 $C_f=0$. The extrapolated origin of the reflected shock in the mean velocity field is located at
 $x^{*}_i \approx -3.27$. Therefore, the lengths of the interaction and separation zones are
 $L^{*}_{int} = x^{*}_i \approx 3.27$ and
 $L^{*}_{sep} = x^{*}_r - x^{*}_s \approx 1.87$, respectively. These values are consistent with the results reported in Volpiani et al. (Reference Volpiani, Bernardini and Larsson2018, figure 12). The mean wall pressure
 $\bar p_w$ distribution is presented in figure 3(b), along with the DNS results reported by Pirozzoli & Bernardini (Reference Pirozzoli and Bernardini2011a) and the inviscid theory. The presently obtained result generally collapses with the reference data. The wall pressure increases rapidly at the start of the interaction zone and gradually reaches the theoretical inviscid solution. The preceding results confirmed the accuracy of the present DNS statistics.
Wall statistics: (a) skin friction  $C_f$, (b) mean pressure
 $\bar p_w$. Red symbols indicate reference data from Pirozzoli & Bernardini (Reference Pirozzoli and Bernardini2011a); blue dashed lines indicate the inviscid solution;
 $x_i$,
 $x_s$ and
 $x_r$ are the locations of the extrapolated origin of the reflected shock, the separation and the reattachment point, respectively.

3. Derivation of TKE spectra transport equation
In this section, we first derive the transport equation of spanwise two-point correlation. The equation for TKE spectra transport is further obtained via Fourier transform.
3.1. Two-point correlation transport equation
We first derive the transport equation of spanwise two-point correlation, considering the statistical homogeneity and periodicity in that direction. According to Arun et al. (Reference Arun, Sameen, Srinivasan and Girimaji2021), the fluctuation of momentum equation can be cast as
 \begin{align}
&\frac{\partial \rho u''_i}{\partial t}+\frac{\partial \rho
u''_i (\tilde u_k + u''_k)}{\partial x_k} +\rho
u''_k\,\frac{\partial \tilde u_i}{\partial x_k}\nonumber\\
&\quad ={-}\frac{\partial p'}{\partial x_i} + \frac{\partial
\tau'_{ik}}{\partial x_k} +\left( 1-\frac{\rho}{\bar \rho}
\right) \left( -\frac{\partial \bar p}{\partial x_i}+
\frac{\partial \bar \tau_{ik}}{\partial x_k}\right)
+\frac{\rho}{\bar \rho}\,\frac{\partial \bar \rho
R_{ik}}{\partial x_k}.
\end{align}
Note that this equation is obtained by combining the fluctuation of momentum equation in non-conservative form and the continuity equation. The spanwise two-point correlation tensor between velocity components  $u''_i$ at
 $\boldsymbol {x} = (x,y,z)$ and
 $u''_j$ at
 $({\boldsymbol x+ \boldsymbol r})=(x,y,z+r_z)$ is defined as (Arun et al. Reference Arun, Sameen, Srinivasan and Girimaji2021)
 \begin{equation} Q_{ij}(\boldsymbol x,\boldsymbol r)=\frac{1}{2}\,\overline{(\rho(\boldsymbol x)+\rho(\boldsymbol x+ \boldsymbol r))\,u''_i(\boldsymbol x)\,u''_j(\boldsymbol x+ \boldsymbol r)}, \end{equation}
which is a function of  $x$,
 $y$ and
 $r_z$. The derivation of the
 $Q_{ij}$ transport equation is similar to that in the incompressible flows. The derivatives in the
 $z$ direction at
 $\boldsymbol x$ and
 $\tilde {\boldsymbol x} = \boldsymbol x + \boldsymbol r$ are related by
 $r_z$ (Lee & Moser Reference Lee and Moser2019):
 \begin{equation} \frac{\partial }{\partial z} ={-} \frac{\partial}{\partial r_z},\quad \frac{\partial }{\partial \tilde z} = \frac{\partial}{\partial r_z}. \end{equation}
Moreover, the averaged flow quantities are independent of  $r_z$, i.e.
 \begin{equation} \bar \varphi(\boldsymbol x) = \bar \varphi (\boldsymbol x + \boldsymbol r),\quad \tilde \varphi(\boldsymbol x) = \tilde \varphi (\boldsymbol x + \boldsymbol r). \end{equation}
After a detailed derivation, we formulate the transport equation for two-point correlation tensor as
 \begin{equation} \frac{\partial Q_{ij}(\boldsymbol x, \boldsymbol r)}{\partial t} = C_{ij} + P_{ij} + D_{ij} + \varPi_{ij} + \varepsilon_{ij} + T_{ij} + B_{ij}. \end{equation}
The terms on the right-hand side represent the contributions from the mean flow convection, production, diffusion, pressure-strain, viscous dissipation, inter-scale transfer and mass-diffusion, respectively. The convection and production terms are related to the variation of mean velocity:
 \begin{gather} C_{ij} ={-} \frac{\partial}{\partial x_k} Q_{ij}(\boldsymbol x,\boldsymbol r)\,\tilde u_k(\boldsymbol x)\quad (k=1,2), \end{gather}
 \begin{gather} P_{ij} ={-} Q_{kj}(\boldsymbol x,\boldsymbol r)\,\frac{\partial \tilde u_i(\boldsymbol x)}{\partial x_k} - Q_{ik}\,(\boldsymbol x,\boldsymbol r) \frac{\partial \tilde u_j(\boldsymbol x)}{\partial x_k}\quad (k=1,2). \end{gather}
The diffusion term  $D_{ij}$ involves the diffusion by turbulent transport
 $D^{T}_{ij}$, pressure fluctuation
 $D^{P}_{ij}$, and viscous stress fluctuation
 $D^{V}_{ij}$:
 \begin{gather} D^{T}_{ij} ={-} \frac{1}{4}\,\frac{\partial}{\partial x_k} \overline{(\rho(\boldsymbol x)+\rho(\boldsymbol x+ \boldsymbol r))\,u''_i(\boldsymbol x)\,u''_j(\boldsymbol x+ \boldsymbol r)\, (u''_k(\boldsymbol x)+u''_k(\boldsymbol x+ \boldsymbol r ))}\quad (k=1,2), \end{gather}
 \begin{gather}
D^{P}_{ij} ={-} \frac{1}{2} \left( \overline{ \left( 1 +
\frac{\rho(\boldsymbol x+\boldsymbol r)}{\rho(\boldsymbol
x)}\right) \frac{\partial p'(\boldsymbol
x)\,u''_j(\boldsymbol x+\boldsymbol r)}{\partial
x_k}}\,\delta_{ik}\right.\nonumber\\
\left.\qquad\qquad + \overline{ \left( 1 +
\frac{\rho(\boldsymbol x)}{\rho(\boldsymbol x+ \boldsymbol
r)}\right) \frac{\partial p'(\boldsymbol x+ \boldsymbol
r)\,u''_i(\boldsymbol x)}{\partial x_k}}\,\delta_{jk}
\right),
\end{gather}
 \begin{gather}
D^{V}_{ij} = \frac{1}{2} \left( \overline{\left( 1 +
\frac{\rho(\boldsymbol x+\boldsymbol r)}{\rho(\boldsymbol
x)}\right) \frac{\partial \tau'_{ik}(\boldsymbol
x)\,u''_j(\boldsymbol x+ \boldsymbol r)}{\partial x_k}}\right. \nonumber\\
\left.\qquad\qquad\qquad\qquad\qquad + \overline{\left( 1 + \frac{\rho(\boldsymbol
x)}{\rho(\boldsymbol x+\boldsymbol r)}\right)
\frac{\partial \tau'_{jk}(\boldsymbol x+ \boldsymbol
r)\,u''_i(\boldsymbol x)}{\partial x_k}} \right)\quad
(k=1,2).
\end{gather}
The pressure-strain term  $\varPi _{ij}$ reflects the inter-component energy transfer:
 \begin{align}
\varPi_{ij} = \frac{1}{2} \left( \overline{ \left(1 +
\frac{\rho(\boldsymbol x+ \boldsymbol r)}{\rho(\boldsymbol
x)}\right) p'(\boldsymbol x)\,\frac{\partial
u''_j(\boldsymbol x+ \boldsymbol r)}{\partial x_i}} +
\overline{ \left(1 + \frac{\rho(\boldsymbol
x)}{\rho(\boldsymbol x+ \boldsymbol r)}\right)
p'(\boldsymbol x+ \boldsymbol r)\,\frac{\partial
u''_i(\boldsymbol x)}{\partial x_j}} \right) .
\end{align}
The dissipation by viscosity  $\varepsilon _{ij}$ is expressed as
 \begin{align}
\varepsilon_{ij} &={-} \frac{1}{2} \left( \overline{ \left(1
+ \frac{\rho(\boldsymbol x+ \boldsymbol
r)}{\rho(\boldsymbol x)}\right) \tau'_{ik}(\boldsymbol
x)\,\frac{\partial u''_j(\boldsymbol x+ \boldsymbol
r)}{\partial x_k}} \right.\nonumber\\
&\quad \left.+ \overline{\left(1 +
\frac{\rho(\boldsymbol x)}{\rho(\boldsymbol x+\boldsymbol
r)}\right) \tau'_{jk}(\boldsymbol x+\boldsymbol
r)\,\frac{\partial u''_i(\boldsymbol x)}{\partial x_k}}
\right)\quad (k=1,2,3).
\end{align}
The inter-scale energy transfer, corresponding to the nonlinear turbulent interactions in incompressible flows (Domaradzki et al. Reference Domaradzki, Liu, Härtel and Kleiser1994; Mizuno Reference Mizuno2016; Lee & Moser Reference Lee and Moser2019), can be split as  $T_{ij}=T^{xy}_{ij}+T^{z}_{ij}$, where
 \begin{align} T^{xy}_{ij} &={-} \frac{1}{2}\,\overline{u''_j(\boldsymbol x+\boldsymbol r)\,\frac{\partial \rho(\boldsymbol x)\,u''_i(\boldsymbol x)\,u''_k(\boldsymbol x)}{\partial x_k}} - \frac{1}{2}\, \overline{\rho(\boldsymbol x+\boldsymbol r)\,u''_j(\boldsymbol x+\boldsymbol r)\,u''_k(\boldsymbol x)\, \frac{\partial u''_i (\boldsymbol x)}{\partial x_k}}\nonumber\\ &\quad - \frac{1}{2}\,\overline{u''_i(\boldsymbol x)\,\frac{\partial \rho(\boldsymbol x+\boldsymbol r)\,u''_j(\boldsymbol x+\boldsymbol r)\,u''_k(\boldsymbol x+\boldsymbol r)}{\partial x_k}} - \frac{1}{2}\,\overline{\rho(\boldsymbol x)\,u''_i(\boldsymbol x)\,u''_k(\boldsymbol x+\boldsymbol r)\, \frac{\partial u''_j(\boldsymbol x+\boldsymbol r)}{\partial x_k}}\nonumber\\ &\quad -D^{T}_{ij}\quad (k=1,2), \end{align}
 \begin{align} T^{z}_{ij}&={-} \frac{1}{2}\,\frac{\partial }{\partial r_z} \overline{(\rho(\boldsymbol x)+ \rho(\boldsymbol x+ \boldsymbol r))\,u''_i(\boldsymbol x)\,u''_j(\boldsymbol x + \boldsymbol r)\, (w''(\boldsymbol x+ \boldsymbol r)-w''(\boldsymbol x)) }\nonumber\\ &\quad - \frac{1}{2}\,\overline{u''_i (\boldsymbol x)\,u''_j (\boldsymbol x+\boldsymbol r)\, \frac{\partial}{\partial r_z} \left( \rho(\boldsymbol x)\,w''(\boldsymbol x+\boldsymbol r) -\rho(\boldsymbol x + \boldsymbol r)\,w''(\boldsymbol x) \right)}. \end{align}
Complicated as it is, we can easily prove that  $T_{ij} \rightarrow 0$ at the limit of
 $r_z \rightarrow 0$, indicating that this term is responsible only for the inter-scale energy transfer. Finally, the mass-diffusion
 $B_{ij}$, caused by the density fluctuation, can be cast as
 \begin{align} B_{ij} &= \frac{1}{2}\left( \overline{u''_j(\boldsymbol x+\boldsymbol r)} - \frac{\overline{\rho(\boldsymbol x)\,u''_j(\boldsymbol x+\boldsymbol r)}}{\bar \rho (\boldsymbol x)} + \overline{\frac{\rho(\boldsymbol x+ \boldsymbol r)\,u''_j(\boldsymbol x+\boldsymbol r)}{\rho (\boldsymbol x)}} \right) \left( -\frac{\partial \bar p}{\partial x _i} + \frac{\partial \bar \tau_{ik}}{\partial x_k} \right)\nonumber\\ &\quad + \frac{1}{2} \left( \overline{u''_i(\boldsymbol x)} - \frac{\overline{\rho(\boldsymbol x + \boldsymbol r)\,u''_i(\boldsymbol x)}}{\bar \rho(\boldsymbol x)} + \overline{\frac{\rho(\boldsymbol x)\,u''_i(\boldsymbol x)}{\rho (\boldsymbol x + \boldsymbol r)}} \right) \left( -\frac{\partial \bar p}{\partial x _j} + \frac{\partial \bar \tau_{jk}}{\partial x_k} \right)\nonumber\\ &\quad - \frac{1}{2} \left( \frac{\overline{\rho(\boldsymbol x)\,u''_j(\boldsymbol x+\boldsymbol r)}}{\bar \rho(\boldsymbol x)} + \overline{\frac{\rho(\boldsymbol x+ \boldsymbol r) u''_j(\boldsymbol x+\boldsymbol r)}{\rho (\boldsymbol x)}} \right) \frac{\partial \bar \rho R_{ik}}{\partial x _k}\nonumber\\ &\quad - \frac{1}{2} \left( \frac{\overline{\rho(\boldsymbol x + \boldsymbol r)\,u''_i(\boldsymbol x)}}{\bar \rho(\boldsymbol x)} + \overline{\frac{\rho(\boldsymbol x)\,u''_i(\boldsymbol x)}{\rho (\boldsymbol x + \boldsymbol r)}} \right) \frac{\partial \bar \rho R_{jk}}{\partial x _k}. \end{align}
The equations above degenerate to the TKE transport equation by taking  $r_z =0$ and contracting the indices
 $i$ and
 $j$, and to the two-point correlation transport equation for incompressible flows by taking the density as unity.
3.2. Spectra of Reynolds stress transport
As customarily performed in the incompressible turbulence (e.g. Lee & Moser Reference Lee and Moser2015), the transport equation of the Reynolds stress spectra can be obtained by performing a Fourier transform on the two-point correlation transport equation. According to the definition in (3.2), the spectra of the Reynolds stress tensor can be expressed as
 \begin{equation} \hat{Q}_{ij}= \mathrm{Re} \left[ \widehat{\rho u''_i}\,\widehat{u''_j}^{{\star}} + \widehat{u''_i}\,\widehat{\rho u''_j}^{{\star}} \right], \end{equation}
where the hat symbol denotes Fourier spectral coefficients, the superscript  $\star$ indicates the complex conjugate, and
 $\mathrm {Re}$ represents taking the averaged real part. The budget terms of (3.5) are transformed into spectral space accordingly. The convection and production terms in (3.6) and (3.7) are therefore transformed as
 \begin{align}& \hat{C}_{ij} ={-} \frac{\partial}{\partial x_k} \hat{Q}_{ij} \tilde u_k, \end{align}
 \begin{align} &\hat{P}_{ij} ={-} \hat{Q}_{kj}\,\frac{\partial \tilde u_i}{\partial x_k} - \hat{Q}_{ik}\, \frac{\partial \tilde u_j}{\partial x_k}. \end{align}
The other budget terms are nonlinear, primarily due to the density variation. Taking the turbulent diffusion term  $D^{T}_{ij}$ in (3.8) as an example, we reformulate all of those terms according to the independent variable
 \begin{align} D^{T}_{ij} & ={-} \frac{1}{4}\,\frac{\partial}{\partial x_k} ( \overline{\rho(\boldsymbol x)\, u''_i(\boldsymbol x)\,u''_k(\boldsymbol x)\,u''_j(\boldsymbol x+ \boldsymbol r) } + \overline{u''_i(\boldsymbol x)\,u''_k(\boldsymbol x)\,\rho(\boldsymbol x+ \boldsymbol r)\, u''_j(\boldsymbol x+ \boldsymbol r) }\nonumber\\ &\quad + \overline{\rho(\boldsymbol x)\,u''_i(\boldsymbol x)\,u''_j(\boldsymbol x+ \boldsymbol r)\,u''_k(\boldsymbol x+ \boldsymbol r)} + \overline{u''_i(\boldsymbol x)\,\rho(\boldsymbol x+ \boldsymbol r)\,u''_j(\boldsymbol x+ \boldsymbol r)\,u''_k(\boldsymbol x+ \boldsymbol r)} ), \end{align}
therefore its Fourier transform is expressed as
 \begin{equation} \hat{D}^{T}_{ij} ={-} \frac{1}{4}\,\frac{\partial}{\partial x_k} \mathrm{Re} \left[ \widehat{\rho u''_i u''_k}\, \widehat{u''_j}^{{\star}} + \widehat{u''_i u''_k}\,\widehat{\rho u''_j}^{{\star}} +\widehat{\rho u''_i}\, \widehat{u''_j u''_k}^{{\star}} + \widehat{u''_i}\,\widehat{\rho u''_j u''_k}^{{\star}} \right]. \end{equation}
The pressure diffusion, viscous diffusion, pressure-strain and viscous dissipation terms in (3.9), (3.10), (3.11) and (3.12) are correspondingly transformed as
 \begin{align} \hat{D}^{P}_{ij} &={-} \frac{1}{2}\,\mathrm{Re} \left[ \widehat{\frac{\partial p'}{\partial x_i}}\, \widehat{u''_j}^{{\star}} + \widehat{\frac{\partial p'}{\partial x_j}}^{{\star}}\,\widehat{u''_i} + \widehat{p'}\,\widehat{\frac{\partial u''_j}{\partial x_i}}^{{\star}} + \widehat{p'}^{{\star}}\, \widehat{\frac{\partial u''_i}{\partial x_j}} \right] \nonumber\\ &\quad - \frac{1}{2}\,\mathrm{Re} \left[ \widehat{\frac{1}{\rho}\,\frac{\partial p'}{\partial x_i}}\, \widehat{\rho u''_j}^{{\star}} + \widehat{\frac{1}{\rho}\,\frac{\partial p'}{\partial x_j}}^{\star}\, \widehat{\rho u''_i} + \widehat{\frac{p'}{\rho}}\,\widehat{\rho\,\frac{\partial u''_j}{\partial x_i}}^{{\star}} + \widehat{\frac{p'}{\rho}}^{{\star}}\,\widehat{\rho\,\frac{\partial u''_i}{\partial x_j}} \right], \end{align}
 \begin{align} \hat{D}^{V}_{ij} &= \frac{1}{2}\,\mathrm{Re} \left[ \widehat{\frac{\partial \tau'_{ik}}{\partial x_k}}\, \widehat{u''_j}^{{\star}} + \widehat{\frac{\partial \tau'_{jk}}{\partial x_k}}^{{\star}}\,\widehat{u''_i} + \widehat{\tau'_{ik}}\,\widehat{\frac{\partial u''_j}{\partial x_k}}^{{\star}} + \widehat{\tau'_{jk}}^{{\star}}\,\widehat{\frac{\partial u''_i}{\partial x_k}} \right] \nonumber\\ &\quad + \frac{1}{2}\,\mathrm{Re} \left[ \widehat{\frac{1}{\rho}\,\frac{\partial \tau'_{ik}}{\partial x_k}}\, \widehat{\rho u''_j}^{{\star}} + \widehat{\frac{1}{\rho}\,\frac{\partial \tau'_{jk}}{\partial x_k}}^{\star}\,\widehat{\rho u''_i} + \widehat{\frac{\tau'_{ik}}{\rho}}\,\widehat{\rho\,\frac{\partial u''_j}{\partial x_k}}^{{\star}} + \widehat{\frac{\tau'_{jk}}{\rho}}^{{\star}}\,\widehat{\rho\,\frac{\partial u''_i}{\partial x_k}} \right], \end{align}
 \begin{align} \hat{\varPi}_{ij} &= \frac{1}{2}\,\mathrm{Re} \left[ \widehat{p'}\,\widehat{\frac{\partial u'_{j}}{\partial x_i}}^{{\star}} + \widehat{p'}^{{\star}}\,\widehat{\frac{\partial u'_{i}}{\partial x_j}} + \widehat{\frac{p'}{\rho}}\,\widehat{\rho\,\frac{\partial u'_{j}}{\partial x_i}}^{{\star}} + \widehat{\frac{p'}{\rho}}^{{\star}}\,\widehat{\rho\,\frac{\partial u'_{i}}{\partial x_j}} \right], \end{align}
 \begin{align} \hat{\varepsilon}_{ij} &={-} \frac{1}{2}\,\mathrm{Re} \left[ \widehat{\tau'_{ik}}\,\widehat{\frac{\partial u'_{j}}{\partial x_k}}^{{\star}} + \widehat{\tau'_{jk}}^{{\star}}\,\widehat{\frac{\partial u'_{i}}{\partial x_k}} + \widehat{\frac{\tau'_{ik}}{\rho}}\,\widehat{\rho\,\frac{\partial u'_{j}}{\partial x_k}}^{{\star}} + \widehat{\frac{\tau'_{jk}}{\rho}}^{{\star}}\,\widehat{\rho\,\frac{\partial u'_{i}}{\partial x_k}} \right]. \end{align}
For the inter-scale energy transfer term, the  $T^{xy}_{ij}$ component is transformed as
 \begin{align}
\hat{T}^{xy}_{ij}& ={-} \frac{1}{2}\,\mathrm{Re} \left[
\widehat{\frac{\partial \rho u''_i u''_k}{\partial
x_k}}\,\widehat{u''_j}^{{\star}} +
\widehat{u''_k\,\frac{\partial u''_i}{\partial
x_k}}\,\widehat{\rho u''_j}^{{\star}} +
\widehat{\frac{\partial \rho u''_j u''_k}{\partial
x_k}}^{{\star}}\,\widehat{u''_i} \right.\nonumber\\
&\quad \left.+\,
\widehat{u''_k\,\frac{\partial
u''_j}{\partial x_k}}^{\star}\,\widehat{\rho
u''_i} \right] - \hat{D}^{T}_{ij}\quad
(k=1,2),
\end{align}
and  $T^{z}_{ij}$ as
 \begin{align} \hat{T}^{z}_{ij} &= \frac{1}{2}\,k_z\,\mathrm{Im} \left[ \widehat{\rho u''_i}\,\widehat{u''_j w''}^{{\star}} - \widehat{\rho u''_i w''}\,\widehat{u''_j}^{{\star}} + \widehat{\rho u''_j w''}^{{\star}}\,\widehat{u''_i} - \widehat{\rho u''_j}^{{\star}}\,\widehat{u''_i w''} \right] \nonumber\\ &\quad - \frac{1}{2}\,\mathrm{Re} \left[ \widehat{w''\,\frac{\partial u''_i}{\partial z}}\,\widehat{\rho u''_j}^{{\star}} + \widehat{\rho u''_i}\,\widehat{w''\,\frac{\partial u''_j}{\partial z}}^{{\star}} \right], \end{align}
where  $\mathrm {Im}$ denotes taking the averaged imaginary part, and
 $k_z$ represents the spanwise wavenumber. Finally, the transformed mass-flux term is formulated as
 \begin{align} \hat B_{ij} &= \frac{1}{2}\,\mathrm{Re} \left[ \widehat{u''_j}^{{\star}} - \frac{\hat{\rho}\,\widehat{u''_j}^{{\star}}}{\bar \rho} + \widehat{\frac{1}{\rho}}\,\widehat{\rho u''_j}^{{\star}} \right] \left( -\frac{\partial \bar p}{\partial x _i} + \frac{\partial \bar \tau_{ik}}{\partial x_k} \right)\nonumber\\ &\quad + \frac{1}{2}\,\mathrm{Re} \left[ \widehat{u''_i} - \frac{\hat{\rho}^{{\star}}\,\widehat{u''_i}}{\bar \rho} + \widehat{\frac{1}{\rho}}^{{\star}}\,\widehat{\rho u''_i} \right] \left( -\frac{\partial \bar p}{\partial x _j} + \frac{\partial \bar \tau_{jk}}{\partial x_k} \right) \nonumber\\ &\quad + \frac{1}{2}\,\mathrm{Re} \left[ \frac{\hat{\rho}\,\widehat{u''_j}^{{\star}}}{\bar \rho} + \widehat{\frac{1}{\rho}}\,\widehat{\rho u''_j}^{{\star}} \right] \frac{\partial \bar \rho R_{ik}}{\partial x _k} + \frac{1}{2}\,\mathrm{Re} \left[ \frac{\hat{\rho}^{{\star}}\,\widehat{u''_i}}{\bar \rho} + \widehat{\frac{1}{\rho}}^{{\star}}\,\widehat{\rho u''_i} \right] \frac{\partial \bar \rho R_{jk}}{\partial x _k}. \end{align}
Contracting indices  $i$ and
 $j$ of the tensor
 $\hat {Q}_{ij}$, the transport equation of TKE spectra
 $\hat {Q}_{kk}$ is obtained, which will be considered primarily in the subsequent discussions.
4. Coherent structures and turbulence amplification
As a first impression of the association between the turbulence amplification and its physical counterparts, we present the instantaneous fields of low-speed streaks in figure 4(a) and vortical structures in figure 4(b), the latter represented by the second invariant  $Q$ of the velocity gradient. Upstream of the interaction zone, both the low-speed streaks and vortical structures resemble those in the low-Reynolds-number turbulent boundary layer flows. These structures go through rapid change across the interaction zone, where the small-scale low-speed streaks are twisted and weakened, while the large-scale structures emerge. Similar phenomena have been reported by previous studies, such as Zhuang et al. (Reference Zhuang, Tan, Li, Sheng and Zhang2018) and Fang et al. (Reference Fang, Zheltovodov, Yao, Moulinec and Emerson2020). Although mean flow separation and spanwise vortex shedding are barely noticeable, the abundant vortical structures are populated within the interaction zone. This will be analysed further in the following discussions. In the post-shock region, the turbulence relaxes gradually to the equilibrium state, where the near-wall small-scale structures are regenerated, and the large-scale structures in the outer region are weakened. As demonstrated by Pirozzoli & Grasso (Reference Pirozzoli and Grasso2006), the relaxation to the equilibrium state for large-scale motions in the outer region requires a long streamwise extent. This process will be considered in our subsequent research.
Instantaneous fields, isosurface of (a) velocity fluctuation  $u'/U_\infty =-0.1$, (b) the second invariant of velocity gradient
 $Q=10.0$, coloured by the wall-normal coordinate. Vertical slices are numerical schlieren, flooded by
 $NS=\exp (-|\boldsymbol {\nabla } \rho |/\rho )$.

The components of the Reynolds stress tensor near the interaction zone, normalized by  $\rho _\infty U^{2}_\infty$, are displayed in figure 5. The
 $R_{uu}$ component (figure 5a), representing the density-weighted variance of
 $u''$, increases remarkably as it approaches the interaction zone. The peak location rises to detach from the wall along with the average sonic line. In the streamwise direction, it reaches maxima at
 $x^{*} \approx -1.5$, where it starts to decay. In the post-shock region, the wall-normal locations of the peaks lie at
 $y^{*} \approx 0.4$ and rise slightly along
 $x^{*}$. A secondary peak near the wall emerges downstream of the interaction zone at
 $x^{*}\approx 3.5$, indicating that the near-wall velocity streaks are regenerated. The
 $R_{vv}$ and
 $R_{ww}$ components, shown in figures 5(b,c), also increase within the interaction zone and attain maxima at
 $x^{*} \approx 0$ and
 $x^{*} \approx -1.5$, respectively. Their evolutions downstream resemble that of the
 $R_{uu}$ component, except for the slower decay rates. Based on this scenario, the emergence of the strong streamwise vortices or cross-stream circulations composed of
 $v''$ and
 $w''$ is expected in the post-shock region. The amplification of the Reynolds shear stress
 $R_{uv}$ (figure 5d) occurs downstream of the impinging oblique shock. These are typical features of SBLI flows, consistent with the results in previous numerical studies (Pirozzoli & Grasso Reference Pirozzoli and Grasso2006; Pirozzoli & Bernardini Reference Pirozzoli and Bernardini2011a; Volpiani et al. Reference Volpiani, Bernardini and Larsson2018).
Reynolds stress near the interaction zone, normalized by  $\rho _\infty U^{2}_\infty$, for (a)
 $R_{uu}$, (b)
 $R_{vv}$, (c)
 $R_{ww}$, and (d)
 $R_{uv}$. Magenta dashed lines indicate the locations of the peak values; light-green solid lines indicate average sonic lines; cyan dotted lines indicate approximate impinging and reflected shocks.

We further report the budget of the TKE ( $K=\overline {\rho u''_i u''_i}/2$) transport equation, cast as (Pirozzoli & Bernardini Reference Pirozzoli and Bernardini2011a)
 \begin{align} \frac{\partial K}{\partial t} &={-}\underbrace{\frac{\partial \bar \rho \tilde u_j K}{\partial x_j}}_{C_K} -\underbrace{\bar \rho\,\widetilde{u''_i u''_j}\,\frac{\partial \tilde u_i}{\partial x_j}}_{P_K} +\underbrace{\frac{\partial}{\partial x_j} \left[ - \frac{1}{2}\,\bar \rho\, \widetilde{u''_i u''_i u''_j} - \overline{p'u''_j} + \overline{\tau'_{ij} u''_i} \right] }_{D_K}\nonumber\\ &\quad - \underbrace{\overline{\tau'_{ij}\,\frac{\partial u''_i}{\partial x_j}}}_{\varepsilon_K} + \underbrace{\overline{p'\,\frac{\partial u''_i}{\partial x_i}}}_{\varPi_K} + \underbrace{\overline{u''_i} \left( \frac{\partial \bar \tau_{ij}}{\partial x_j} - \frac{\partial \bar p}{\partial x_i}\right)}_{B_{K}}. \end{align}
The TKE transport is balanced by the right-hand side of the equation, representing the energy transfer by the mean flow convection  $C_K$, production
 $P_K$, diffusion
 $D_K$ by turbulence, pressure (
 $p'$) and viscous stress (
 $\tau '_{ij}$) fluctuations, viscous dissipation
 $\varepsilon _K$, pressure-dilatation
 $\varPi _k$, and mass-diffusion
 $B_K$, the last two of which are caused by the genuine compressibility effects.
In figure 6(a), we present the contour of the production  $P_K$ and the wall-normal distribution of all transport terms at seven streamwise stations across the interaction zone. The average sonic line and the TKE peak location along the streamwise (
 $x$) direction are also displayed for comparison. Within the interaction zone, the production term
 $P_K$ is amplified gradually, and its trend is similar to the amplification of
 $R_{uu}$ in figure 5(a). Its peak location aligns approximately with the average sonic line. The distribution of the budget terms at
 $x^{*}=-3.28$ generally resembles that of the canonical compressible wall-bounded turbulence (e.g. Duan, Beekman & Martin Reference Duan, Beekman and Martin2011), except that the convection term
 $C_K$ is non-zero, indicating the non-negligible influence of the upstream-travelling sonic waves (Pirozzoli & Grasso Reference Pirozzoli and Grasso2006). As it approaches downstream, the TKE transport is strongly modified by the impinging shock, where all the budget terms in the TKE transport equation are significant, except the
 $\varPi _k$ and
 $B_K$ terms. The
 $\varPi _k$ and
 $B_K$ terms, caused by genuine compressibility effects, manifest their significance only near the strong impinging shock wave, while their participation in TKE energy transfer in other regions is marginal (Jammalamadaka et al. Reference Jammalamadaka, Li and Jaberi2014). At the end of the interaction zone (
 $x^{*}=-0.66$ and
 $0$), the TKE transport terms are significant merely at
 $y^{*}=0.4$, while the near-wall turbulence is not yet recovered. From the perspective of dynamic process, we can conclude from the budget terms that the TKE is generated by the production term
 $P_K$, convected/diffused spatially by
 $C_K$ and
 $D_K$, and mass-diffused or transferred to internal energy by
 $B_K$,
 $\varPi _k$ and
 $\varepsilon _K$.
Budget of the TKE transport equation, flooded by: (a)  $P_K$, (b)
 $P^{x}_{11}$, (c)
 $P^{y}_{11}$. Lines indicate: average sonic line (light green solid), maximal TKE location (magenta dashed), approximate impinging and reflected shocks (light blue dotted). Budget at: (d)
 $x^{*}=-3.28$, (e)
 $x^{*}=-2.62$, ( f)
 $x^{*}=-1.97$, (g)
 $x^{*}=-1.32$, (h)
 $x^{*}=-0.66$, and (i)
 $x^{*}=0.0$.

Most early-year studies attributed the turbulence amplification to the vortex-shedding of the separated flow and shear layer. The studies by Humble et al. (Reference Humble, Scarano and Van Oudheusden2007) and Fang et al. (Reference Fang, Zheltovodov, Yao, Moulinec and Emerson2020) proposed a novel mechanism. By splitting the production term  $P_K$ as
 \begin{equation} P_K={-} \bar \rho\,\widetilde{u''_i u''_j}\,\frac{\partial \tilde u_i}{\partial x_j}={-} \underbrace{\bar \rho\,\widetilde{u'' u''}\,\frac{\partial \tilde u}{\partial x}}_{P^{x}_{11}} - \underbrace{\bar \rho\,\widetilde{u'' v''}\,\frac{\partial \tilde u}{\partial y}}_{P^{y}_{11}} - \underbrace{\bar \rho\,\widetilde{u'' v''}\,\frac{\partial \tilde v}{\partial x}}_{P^{x}_{22}} - \underbrace{\bar \rho\,\widetilde{v'' v''}\,\frac{\partial \tilde v}{\partial y}}_{P^{y}_{22}}, \end{equation}
the terms  $P^{x}_{11}$ and
 $P^{y}_{22}$ are regarded as the TKE production by mean flow deceleration, and
 $P^{y}_{11}$ and
 $P^{x}_{22}$ as by shear. It was pointed out that
 $P^{x}_{11}$ is first increased, leading to the amplification of TKE, and conversely resulting in the increment of
 $P^{x}_{11}$, forming a positive feedback loop until the end of the interaction zone.
The physical processes reflected in the present TKE production generally agree with the above elucidation. The distributions of TKE production due to mean flow deceleration  $P^{x}_{11}$ and shear layer
 $P^{y}_{11}$ are presented in figures 6(b,c). The increment of
 $P^{x}_{11}$ occurs even upstream of the interaction zone. At
 $x^{*}=-3.28$,
 $P^{x}_{11}$ is increased to a level same as
 $P^{y}_{11}$. As it approaches downstream across the interaction zone, the
 $P^{x}_{11}$ term becomes more prominent than
 $P^{y}_{11}$ above
 $y^{*}=0.2$. At the end of the interaction zone, the production term
 $P_K$ is again dominated by
 $P^{y}_{11}$. The production of
 $R_{vv}$, i.e.
 $P_{22} = P^{x}_{22} + P^{y}_{22}$, on the other hand, is much lower than
 $P^{x}_{11}$ and
 $P^{y}_{11}$. In general, the present results are consistent with those reported by Humble et al. (Reference Humble, Scarano and Van Oudheusden2007) and Fang et al. (Reference Fang, Zheltovodov, Yao, Moulinec and Emerson2020): the turbulence amplification is first caused by the mean flow deceleration, then the shear layer when it is well-developed.
In this section, we have provided an observation on the evolution of coherent structures across the interaction zone and analysed the budget of TKE transport. The results in the present study are congruous with previous research. In the subsequent discussions, we further inspect the scale-by-scale TKE transport utilizing the budget of TKE spectra transport equation and by so doing relate the emergence of large-scale motions to the turbulence amplification.
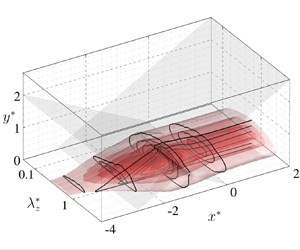
5. Spectra of TKE
The premultiplied spanwise energy spectra distributions along the  $x$ and
 $y$ directions near the interaction zone are presented in figure 7 by isosurfaces, along with the spectra distribution at the spanwise scale
 $\lambda ^{*}_z=1$ to identify the large-scale motions, and the streamwise locations
 $x^{*} = -3.6$,
 $-2.4$,
 $-1.2$ and
 $0.0$ displayed by contour lines to present the streamwise evolution. The premultiplied spectra of TKE, i.e.
 $k_z \hat {Q}_{kk}$, are shown in figure 7(a). Upstream of the interaction zone, the most energetic motions are prominent only in the near-wall region at
 $\lambda ^{*}_z \approx 0.5$, i.e.
 $\lambda ^{+}_z \approx 100$, corresponding to the characteristic length scale of velocity streaks in canonical wall-bounded turbulence (Pirozzoli & Bernardini Reference Pirozzoli and Bernardini2011a). As it enters the interaction zone and approaches the impinging shock, the distribution of the spectra gradually widens in both the
 $\lambda ^{*}_z$ and
 $y^{*}$ directions, indicating that the energetic motions are excited in wider spanwise-scale and wall-normal ranges. Specifically, the extension of the spectra to the spanwise scales greater than
 $\lambda ^{*}_z = 1.0$ suggests the emergence or amplification of large-scale motions. Inspecting the spectra of the Reynolds normal stresses individually, as displayed in figures 7(b–d), we infer that these excited large-scale spectra are attributed primarily to the wall-parallel components
 $\hat {Q}_{11}$ and
 $\hat {Q}_{33}$, while the contribution by the wall-normal component
 $\hat {Q}_{22}$ is less prominent.
Isosurfaces of the premultiplied spanwise spectra: (a) TKE  $k_z \hat {Q}_{kk}$; (b) streamwise component
 $k_z \hat {Q}_{11}$; (c) wall-normal component
 $k_z \hat {Q}_{22}$; (d) spanwise component
 $k_z \hat {Q}_{33}$. Contour lines indicate spectra distribution at the spanwise scale of
 $\lambda ^{*}_z=1.0$ and the streamwise locations
 $x^{*} = -3.6, -2.4, -1.2,0.0$; grey-shaded planes indicate approximate impinging and reflected shocks.

We further identify the amplification rate of the spectra,  $R_Q$, defined as
 \begin{equation} R_Q(x^{*}) = \frac{\max_{y^{*}, \lambda^{*}_z} \hat{Q}(x^{*},y^{*}, \lambda^{*}_z)} {\max_{ y^{*}, \lambda^{*}_z } \hat{Q}(x^{*}_0,y^{*}, \lambda^{*}_z)}. \end{equation}
The results are displayed in figure 8(a). The spectra peak locations in the wall-normal direction  $y^{*}_R$ and the corresponding spanwise scale
 $\lambda ^{*}_{z,R}$ are displayed in figures 8(b) and 8(c), respectively. The amplification of the streamwise component
 $\hat {Q}_{11}$ is firstly triggered, even upstream of the extrapolated origin of the reflected shock, as shown in figures 8(a) and 7(b). The
 $R_{Q_{11}}$ ‘overshoots’ to a maximal value of
 $3.5$ at
 $x^{*}\approx -1.0$ and
 $y^{*} \approx 0.4$, where the energetic large- and small-scale motions are both excited. In this process, the most energetic motions are converted from the small-scale motions with
 $\lambda ^{+}_{z,R_{11}} \approx 100$ to the large-scale motions with
 $\lambda ^{*}_{z,R_{11}} \approx 0.9$ (figure 8c). At the end of the interaction zone, downstream of
 $x^{*}\approx - 1.0$,
 $R_{Q_{11}}$ starts to decay and retains the relatively low value
 $1.5$, while the wall-normal location of the maximum remains at
 $y^{*} \approx 0.4$ (figure 8b). We can also read from the spectra distribution in figure 7(b) that the energetic motions spread widely in scale-space retain for a relatively long streamwise extent, especially for those large-scale motions wider than
 $\delta _0$. For the wall-normal and spanwise components
 $\hat {Q}_{22}$ and
 $\hat {Q}_{33}$, the amplification is triggered within the interaction zone, later than
 $\hat {Q}_{11}$. The maximal amplification rates
 $R_{Q_{22}}$ and
 $R_{Q_{33}}$ are attained at
 $x^{*}\approx -0.5$ and
 $-1.5$, respectively, consistent with the previous observations of
 $R_{ij}$ in § 4. The
 $R_{Q_{33}}$ suffers an ‘overshooting’ to the value
 $5.5$, then returns to
 $4.5$ downstream of the interaction zone, while
 $R_{Q_{22}}$ increases monotonically and reaches a plateau of
 $4.5$. Downstream of the interaction zone, the maximal spectra density is achieved at
 $y^{*} = 0.3$ with the spanwise scale
 $\lambda ^{*}_{z,R_{22}} \approx 0.45$ for
 $\hat {Q}_{22}$, and at
 $y^{*} = 0.4$ with
 $\lambda ^{*}_{z,R_{33}} \approx 0.9$ for
 $\hat {Q}_{33}$. The relations between characteristic scales and wall-normal locations are reminiscent of the streamwise vortices in wall-bounded turbulence (e.g. Hwang & Cossu Reference Hwang and Cossu2010; Hwang & Bengana Reference Hwang and Bengana2016).
Streamwise distribution of (a) amplification rate  $R_Q$, and maximum locations (b)
 $y^{*}_R$ and (c)
 $\lambda ^{*}_{z,R}$.

The above depiction is compatible with the evolution of coherent structures across the impinging shock (recall figure 4). The amplification of  $R_{Q_{11}}$, the rise in
 $y^{*}_R$ and the increment of
 $\lambda ^{*}_{z,R_{11}}$ correspond to the formulation of large-scale velocity streaks in the outer region. The latter growth of
 $R_{Q_{22}}$ and
 $R_{Q_{33}}$ further suggests that the large-scale cross-stream circulations are formed downstream of the large-scale velocity streaks. With these spatial arrangements, we surmise that the streamwise vortical structures are generated by the twisting of the large-scale velocity streaks, based on the previous investigations on instability/transient growth of velocity streaks (Schoppa & Hussain Reference Schoppa and Hussain2002) in the process of flow transition and the self-sustaining cycle in canonical wall-bounded turbulence (Hwang & Bengana Reference Hwang and Bengana2016). Related proofs will be provided subsequently.
6. Transport of TKE
6.1. Turbulent production
Similar to (4.2), the production of TKE spectra transport is split as
 \begin{equation} \hat{P}_{kk} = \hat{P}^{x}_{11} + \hat{P}^{y}_{11} + \hat{P}_{22}, \end{equation}
where
 \begin{gather} \hat{P}^{x}_{11} ={-}\frac{1}{2}\,\hat{Q}_{11}\,\frac{\partial \tilde u}{\partial x}, \end{gather}
 \begin{gather} \hat{P}^{y}_{11} ={-}\frac{1}{2}\,\hat{Q}_{12}\,\frac{\partial \tilde u}{\partial y} , \end{gather}
 \begin{gather} \hat{P}_{22} ={-}\frac{1}{2}\,\hat{Q}_{21}\,\frac{\partial \tilde v}{\partial x} -\frac{1}{2}\, \hat{Q}_{22}\,\frac{\partial \tilde v}{\partial y}, \end{gather}
are the production of  $\hat {Q}_{11}$ by mean flow deceleration and shear, and that of
 $\hat {Q}_{22}$, respectively. The spectra distributions of these production terms are presented in figure 9 by isosurfaces. The total TKE production
 $\hat {P}_{kk}$ is amplified and spread to wider extents in wall-normal directions and spanwise scales (see figure 9a) within the interaction zone, similar to the evolution of TKE spectra (figure 7). As for the decomposed components,
 $\hat {P}^{x}_{11}$ in figure 9(b) is prominent merely within the interaction zone and constitutes substantially to
 $\hat {P}_{KK}$ for large-scale motions with
 $\lambda ^{*}_z \gtrsim 1.0$. The
 $\hat {P}^{y}_{11}$ component is first amplified then diminished and returns to a moderate value, further dominating the turbulent production downstream. It is significant only at small scale with
 $\lambda ^{*}_z \lesssim 1.0$. The
 $\hat {P}_{22}$ component in figure 9(d) is trivial except near the shocks.
Isosurfaces of the premultiplied spectra of TKE production: (a)  $k_z \hat {P}_{kk}$, (b)
 $k_z \hat {P}^{x}_{11}$, (c)
 $k_z \hat {P}^{y}_{11}$, (d)
 $k_z \hat {P}_{22}$. Contour lines indicate spectra distribution at the spanwise scale of
 $\lambda ^{*}_z=1.0$; grey-shaded planes indicate approximate impinging and reflected shocks.

Considering their significance, the spectra  $\hat {P}^{x}_{11}$ and
 $\hat {P}^{y}_{11}$ at the characteristic large and small scales, i.e.
 $\lambda ^{*}_z \approx 1.0$ and
 $\lambda ^{+}_z \approx 100$, are presented further in figure 10. For the production at the large-scale
 $\lambda ^{*}_z \approx 1.0$, as shown in figures 10(a,b), the
 $\hat P^{x}_{11}$ component is dominant within the interaction zone. Its amplification starts to evidence at
 $x^{*}\approx -3.0$, increases rapidly, and then drops to a negligible value at
 $x^{*} \approx -1.0$. A small region of negative production is observed across the nominal impinging shock, due to the acceleration of the mean flow. The
 $\hat P^{y}_{11}$ component, on the other hand, manifests itself only at the end of the interaction zone
 $x^{*} \approx -1.0$, where the shear layer is fully developed. In the post-shock region,
 $\hat P^{y}_{11}$ remains at the relatively low level
 $0.02$, indicating its weak contribution to the production of large-scale motions downstream of the interaction zone. As for the production at the small-scale
 $\lambda ^{+}_z \approx 100$, as shown in figures 10(c,d), the
 $\hat P^{x}_{11}$ and
 $\hat P^{y}_{11}$ components are equivalently significant. They start to increase simultaneously at
 $x^{*} \approx -3.5$, and attain local maxima at
 $x^{*} \approx -2.0$. At the end of the interaction zone, the
 $\hat P^{x}_{11}$ component decays rapidly to zero, while
 $\hat P^{y}_{11}$ first decreases and then retains the value
 $0.04$. Notably, a second peak in the near-wall region arises at
 $x\approx 1.0$, indicating the reformulation of near-wall small-scale structures.
Premultiplied spectra of the decomposed TKE production at (a,b)  $\lambda ^{*}_z=1.0$ and (c,d)
 $\lambda ^{+}_z=100$, for (a,c)
 $k_z \hat {P}^{x}_{11}$ and (b,d)
 $k_z \hat {P}^{y}_{11}$. Cyan lines indicate approximate impinging and reflected shocks.

As we discussed previously, the amplification of turbulence should be attributed to first the mean flow deceleration, and then the shear layer once it is well-developed (Humble et al. Reference Humble, Scarano and Van Oudheusden2007; Fang et al. Reference Fang, Zheltovodov, Yao, Moulinec and Emerson2020). Although the decomposed production term of TKE transport reported in § 4 generally agrees with this depiction, the present spectral analysis provides a more detailed yet slightly different interpretation. Specifically, the amplification of large-scale spectral intensity is attributed only to mean-flow deceleration, immediately as it enters the interaction zone, while for the small-scale motions, both the mean-flow deceleration and shear are prominent and increase synchronously within the interaction zone. This should probably be ascribed to the low Reynolds number considered in the present study. According to the definition of these terms in (6.2) and (6.3), the TKE production related to the mean shear should be much more prominent than that by the flow deceleration only when  $\partial \tilde u/\partial x$ is much smaller than
 $\partial \tilde u/\partial y$, at least by one decade, considering that the variance of
 $u''$ is approximately
 $8\unicode{x2013}10$ times the magnitude of the Reynolds shear stress. Such a circumstance could occur only when the Reynolds number is sufficiently high. Nevertheless, the preceding observation in § 4 and by Fang et al. (Reference Fang, Zheltovodov, Yao, Moulinec and Emerson2020) that the increase of
 $P^{x}_{11}$ occurs upstream of that of
 $P^{y}_{11}$ is an integral effect, instead of a scale-by-scale phenomenon.
In the aspect of coherent structures, we ascribe directly the genesis of the large-scale velocity streaks to the mean flow deceleration, which can be related further to the mean adverse pressure gradient (APG) (Babinsky & Harvey Reference Babinsky and Harvey2011, § 2.6). Rose & Childs (Reference Rose and Childs1974) suggested that the amplification of the Reynolds stress is similar to that in the incompressible turbulent boundary layers (ITBLs) under APG. Latter studies have revealed further with the energy spectra that turbulence amplification in the outer region in ITBLs under uniform APG is due to the emergence of large-scale motions (Harun et al. Reference Harun, Monty, Mathis and Marusic2013; Kitsios et al. Reference Kitsios, Sekimoto, Atkinson, Sillero, Borrell, Gungor, Jiménez and Soria2017; Yoon, Hwang & Sung Reference Yoon, Hwang and Sung2018; Yoon et al. Reference Yoon, Hwang, Yang and Sung2020). In supersonic flows, Wang et al. (Reference Wang, Wang, Sun, Yang, Zhao and Hu2019a,Reference Wang, Wang, Sun, Wang and Hub) observed similar and more evident large-scale motions under APG generated by either the small-angle concave walls or external successive compression waves. Wu, Liang & Zhao (Reference Wu, Liang and Zhao2019) linked the large-scale motions to the energy spectra peak in the outer region, further validating the resemblance between compressible and ITBLs under APG. These commonalities lead to an inference that the emergence of the large-scale motions in the present OSBLI flow should be attributed to the APG within the interaction zone.
The spectra of the TKE production merely suggest the formation of large-scale velocity streaks constituted by  $u''$. The large-scale cross-stream circulations constituted by
 $v''$ and
 $w''$ should be stemmed from the inter-component energy transfer, considering the insignificant
 $\hat {P}_{22}$ and the inherently zero-valued
 $\hat {P}_{33}$. This will be demonstrated in the next subsection.
6.2. Pressure-dilatation and pressure-strain
The pressure-dilatation term  $\hat {\varPi }_{kk}$ exists merely for compressible flows. It transfers energy between kinetic energy and internal energy. Although this term is expected to play a significant role in TKE transfer, at least within the interaction zone, the spectra presented in figure 11(a) suggest that genuine compressibility effects are still trivial except near the impinging and reflected shocks. This is consistent with the conclusions in Jammalamadaka et al. (Reference Jammalamadaka, Li and Jaberi2014). A small negative region can be observed at
 $x^{*} \approx -1.5$ in the vicinity of the wall, where the genuine compressibility effects are the most obvious for canonical compressible wall-bounded turbulence (Yu, Xu & Pirozzoli Reference Yu, Xu and Pirozzoli2019, Reference Yu, Xu and Pirozzoli2020; Yu & Xu Reference Yu and Xu2021).
Isosurfaces of the premultiplied spectra of pressure-dilatation and pressure-strain terms: (a)  $k_z \hat {\varPi }_{kk}$, (b)
 $k_z \hat {\varPi }_{11}$, (c)
 $k_z \hat {\varPi }_{22}$, (d)
 $k_z \hat {\varPi }_{33}$. Contour lines indicate spectra distribution at the spanwise scale of
 $\lambda ^{*}_z=1.0$; grey-shaded planes indicate approximate impinging and reflected shocks.

For the Reynolds normal stresses, the pressure-strain terms  $\hat {\varPi }_{11}$,
 $\hat {\varPi }_{22}$ and
 $\hat {\varPi }_{33}$ are responsible for the inter-component energy transfer. The results are presented in figures 11(b–d). As it goes downstream across the interaction zone, the trend of inter-component TKE transfer is not altered. The TKE is redistributed from
 $u''$ and
 $v''$ to
 $w''$ in the near-wall region, and from
 $u''$ to
 $v''$ and
 $w''$ at higher wall-normal locations. Note that in the post-shock region, the transfer of TKE from
 $u''$ to
 $v''$ is not strong enough to be manifested by the isosurfaces.
In §§ 5 and 6.1, we observed that the formation of the large-scale velocity streaks occurs upstream of the emergence of the large-scale cross-stream circulations. We also showed that the large-scale velocity streaks are induced by the adverse pressure gradient. The pressure-strain terms considered herein further explain the generation of large-scale cross-stream circulations. Considering that the production terms  $\hat {P}_{22}$ and
 $\hat {P}_{33}$ are either insignificant or zero, we infer that the energetic large-scale cross-stream circulations composed of
 $v''$ and
 $w''$ emerging at the end of the interaction zone are induced by the inter-component energy transfer from
 $u''$.
Intriguingly, in the self-sustaining cycles of wall-bounded turbulence, the instability and/or transient growth leads to the meandering of the velocity streaks (Schoppa & Hussain Reference Schoppa and Hussain2002), and further forming streamwise vortices via vortex stretching and advection (Jiménez Reference Jiménez2015). These processes proved to be related to the inter-component energy transfer by pressure-strain terms as well (Cho, Choi & Hwang Reference Cho, Choi and Hwang2016; Cho et al. Reference Cho, Hwang and Choi2018; Doohan, Willis & Hwang Reference Doohan, Willis and Hwang2021; Kawata & Tsukahara Reference Kawata and Tsukahara2021). This resemblance partially substantiates our previous presumption that the large-scale cross-stream circulations are prompted by the instability/transient growth of large-scale velocity streaks.
6.3. Convection, diffusion and mass-diffusion
The convection term  $\hat {C}_{kk}$ and the diffusion term
 $\hat {D}_{kk}$ represent the spatial energy transport by mean flow and fluctuations, respectively. The mass-diffusion term comes from the difference between the ensemble and Favre averages of velocity fluctuations. It reflects directly the genuine compressibility effects caused by density fluctuations. Herein, we add these three terms together and regard the summation as the TKE spatial transfer.
The spectra distribution of this budget term is displayed in figure 12(a). The contours at the scales  $\lambda ^{*}_z=1.0$ and
 $\lambda ^{+}_z=100$ are displayed in figures 12(b) and 12(c), respectively. The spatial energy transfer plays a significant role only within the interaction zone. The amplified production term observed in figure 9 is essentially balanced by this term, indicating that the amplified energy is transferred spatially downstream to the post-shock region, or downwards to the near-wall region. This is similar to the TKE budget analysis performed by Li et al. (Reference Li, Fu, Ma and Liang2010) and Tong et al. (Reference Tong, Yu, Tang and Li2017). Notably, inspecting
 $\hat {B}_{kk}$,
 $\hat {C}_{kk}$ and
 $\hat {D}_{kk}$ individually, we find that
 $\hat {C}_{kk}$ and
 $\hat {D}_{kk}$ are much stronger than
 $\hat {B}_{kk}$, indicating that the genuine compressibility effects caused by the density fluctuations are insignificant.
(a) Isosurfaces of the premultiplied spectra of TKE spatial transport  $k_z (\hat {B}_{kk} + \hat {C}_{kk} + \hat {D}_{kk})$; contour lines indicate spectra at the spanwise scale of
 $\lambda ^{*}_z=1.0$; grey-shaded planes indicate impinging and reflected shocks. (b,c) Spectra distribution at
 $\lambda ^{*}_z=1.0$ and
 $\lambda ^{+}_z=100$; cyan lines indicate approximate impinging and reflected shocks.

6.4. Inter-scale energy transfer and dissipation
The inter-scale energy transfer  $\hat {T}_{kk}$ reflects the turbulent energy cascade. As presented in figure 13(a), the energy is transferred from large- to small-scale motions, consistent with the classical energy cascade process depicted by Richardson (Pope Reference Pope2000). The inverse energy transfer from small- to large-scale motions is not evident. The spectra distributions of
 $\hat T_{kk}$ at
 $x^{*}=-4.0, -3.0, -2.0, -1.0$ are presented in figures 13(c–f), respectively. Upstream of the interaction zone, the spectra of the inter-scale energy transfer share resemble those in incompressible channel flows (Lee & Moser Reference Lee and Moser2015; Cho et al. Reference Cho, Hwang and Choi2018). The energy is transferred primarily from the scale
 $\lambda ^{+}_z \approx 100$ to
 $\lambda ^{+}_z \approx 20$. Inverse energy transfer from small- to large-scale motions at
 $\lambda ^{*}_z \approx 1.0$ is also evident, which has been observed widely in the spanwise spectra of the TKE transport process (Lee & Moser Reference Lee and Moser2015; Auléry et al. Reference Auléry, Dupuy, Toutant, Bataille and Zhou2017; Cho et al. Reference Cho, Hwang and Choi2018). As it approaches downstream at
 $x^{*} = -3.0$ and
 $-2.0$, this budget term is gradually intensified, with the negative peak location remaining at
 $\lambda ^{+}_z \approx 100$ in the scale space, and moving outwards in the wall-normal direction. The inverse energy transfer from
 $\lambda ^{+}_z \approx 100$ to
 $\lambda ^{*}_z \gtrsim 1.0$ is still visible. The corresponding local maxima are also moving outwards and to larger scales. At
 $x^{*} = -1.0$, where the amplification rate of TKE spectra reaches maxima, there is only energy transfer from large-scale at
 $\lambda ^{*}_z \approx 1.0$ to smaller-scale motions, while the inverse energy transfer fades away. Although the net inverse energy transfer occurs in the process of turbulence amplification at the start of the interaction zone, its contribution to the genesis of large-scale motions is scanty due to its smallness in comparison with the production term.
Isosurfaces of the premultiplied spectra of (a) inter-scale energy transfer  $k_z \hat {T}_{kk}$ and (b) dissipation
 $k_z \hat {\varepsilon }_{kk}$; contour lines indicate spectra at the spanwise scale of
 $\lambda ^{*}_z=1.0$; grey-shaded planes indicate approximate impinging and reflected shocks. (c–f) The
 $k_z \hat {T}_{kk}$ distribution at
 $x^{*}=-4.0, -3.0, -2.0, -1.0$, respectively.

As expected, the dissipation term  $\hat {\varepsilon }_{kk}$, presented in figure 13(b), is significant merely close to the wall and concentrated at small scales.
7. Spanwise uniform oscillations
The preceding discussions focused on the motions with finite spanwise length scales, while the turbulent fluctuations caused by the spanwise-uniform unsteadiness are not involved. In this section, we discuss the energy transfer of these spanwise-uniform turbulent fluctuations.
The energy of spanwise-uniform oscillations (SUOs) is extracted from the Fourier mode at  $k_z=0$. The spectra distribution of TKE in the
 $x\unicode{x2013}y$ plane near the interaction zone is presented in figure 14(a). The strong SUOs can be classified according to the wall-normal coordinate and their physical counterparts. The strong spectra density above the boundary layer (
 $y^{*} \gtrsim 1.0$) corresponds to the unsteady reflected shock wave (Plotkin Reference Plotkin1975; Clemens & Narayanaswamy Reference Clemens and Narayanaswamy2014), hereinafter referred to as the ‘shock unsteadiness’. That inside the boundary layer (
 $y^{*} \lesssim 1.0$) within the interaction zone corresponds to the low-frequency ‘breathing’ or intermittency of the flow separation (Clemens & Narayanaswamy Reference Clemens and Narayanaswamy2014) and the possibly existing quasi-two-dimensional vortex shedding due to the Kelvin–Helmholtz instability (Dupont et al. Reference Dupont, Piponniau, Sidorenko and Debiève2008; Helm et al. Reference Helm, Martin and Dupont2014), hereinafter referred to as the ‘inner unsteadiness’. Compared with the finite spanwise length scales motions (FSMs), it is less energetic, with spectra maximum a decade lower. The TKE of SUOs starts to magnify at
 $x^{*} \approx -3$, and reaches maximum at
 $x^{*} \approx -1.0$ and
 $y^{*} \approx 0.4$, downstream of which it gradually decays, similar to FSMs.
The TKE spectra and the transport budget terms at  $k_z=0$, for (a)
 $\hat {Q}_{kk}$, (b)
 $\hat {P}_{kk}$, (c)
 $\hat {B}_{kk} + \hat {C}_{kk} + \hat {D}_{kk}$, (d)
 $\hat {\varepsilon }_{kk}$, (e)
 $\hat {\varPi }_{kk}$, ( f)
 $\hat {T}_{kk}$. The inset in (d) is stretched vertically from 0 to 0.04.

The spectra of energy transfer budget terms are shown in figures 14(b–f). For the shock unsteadiness, although the budget terms are strong, they are prominent only adjacent to the impinging and reflected shocks. The TKE is produced by the production term, convected/diffused upstream/downstream, and transferred from/to the internal energy by pressure-dilatation correlation. The inter-scale energy transfer for the shock unsteadiness is negative, indicating that the shock unsteadiness is partially responsible for its wrinkling. Although the above scenario seems plausible, we are obliged to stress that these interpretations must be made with caution. For numerical stability, high numerical dissipation is applied to resolve the shock wave, which reduces the accuracy of the results, especially in spectral analysis.
As for the inner unsteadiness, the energy transfer is dominated by production  $\hat {P}_{kk}$, convection/diffusion/mass-diffusion
 $\hat {B}_{kk} + \hat {C}_{kk} + \hat {D}_{kk}$, and inter-scale energy transfer
 $\hat {T}_{kk}$. The dissipation
 $\hat {\varepsilon }_{kk}$ is significant merely close to the wall. The production term
 $\hat {P}_{kk}$ manifests itself within the interaction zone from
 $x^{*} \approx -3$ to
 $x^{*} \approx -1$. It is weaker than the contribution from the inter-scale energy transfer
 $\hat {T}_{kk}$, which is primarily responsible for the SUO TKE amplification, even downstream of the interaction zone. Its positiveness indicates that the TKE of SUOs is transferred from FSMs. We can comprehend this process as the global instability induced by small-scale disturbances (Touber & Sandham Reference Touber and Sandham2009; Nichols et al. Reference Nichols, Larsson, Bernardini and Pirozzoli2017; Pasquariello et al. Reference Pasquariello, Hickel and Adams2017).
8. Concluding remarks
Oblique shock wave/turbulent boundary layer interaction is a ubiquitous flow phenomenon in aerospace engineering. In this paper, we present the scale-by-scale inspections of turbulence amplification and the evolution of coherent structures within the interaction zone. To do this, we derived the TKE spectra transport equation. The spectral analysis enhances our comprehension of the association between turbulence amplification and the genesis of large-scale structures.
For the presently considered case, with the free-stream Mach number being  $2.28$ and the angle of impinging shock wave being
 $33.2^{\circ }$, the flow goes through a mild separation with a small mean separation bubble in the interaction zone. The TKE budget analysis confirms the preceding conclusion that the turbulence amplification is excited by first mean flow deceleration, and then the shear layer once it is well-developed. The spectra distribution shows that the most energetic motions are converted from the near-wall small-scale motions with
 $\lambda ^{+}_z \approx 100$ at
 $y^{+} \approx 15$ to large-scale motions with
 $\lambda ^{*}_z \approx 0.9$ at
 $y^{*} \approx 0.4$, which retain for a long extent downstream. It also suggests that the turbulent amplification is associated directly with the emergence of large-scale motions. Within the interaction zone, the spectra of the TKE production reveal the distinctive process of turbulence amplification between large-scale and small-scale motions: the former primarily by the mean flow deceleration, while the latter by both the mean flow deceleration and the mean shear. The seemingly first triggered production by mean flow deceleration in TKE budget is an integral effect instead of a scale-by-scale phenomenon for the presently considered low-Reynolds-number case. The production term engenders primarily the energy of streamwise velocity fluctuation, which is redistributed to the other two velocity components by the pressure-strain term. The energy within the interaction zone is transported downstream, transferred to small scales, and dissipated by viscosity. The inverse energy transfer from small scales (
 $\lambda ^{+}_z \approx 100$) to large scales (
 $\lambda ^{*}_z \gtrsim 1.0$) is also observed. However, its contribution is much less prominent compared with the production term. The genuine compressibility effects are negligible, except near the shocks.
The TKE spectra transport analysis also sheds some light on the genesis of large-scale motions within the interaction zone. Based on the commonalities between the presently studied flow and the existing investigations on turbulent boundary layers under adverse pressure gradient, we can elucidate that it is the mean adverse pressure gradient that induces the generation of large-scale velocity streaks. That the pressure-strain term transfers the energy from the streamwise velocity component to other components partially substantiates that the formulation of the cross-stream circulations is probably induced by the modal/non-modal instability of the velocity streaks, based on the scenarios of the self-sustaining cycles in wall-bounded turbulence.
The spanwise uniform motions correspond to the unsteadiness of the reflected shock and the flow separation or vortex shedding. The latter proves to be generated primarily by the inter-scale energy transfer that transports the TKE from finite-scale motions to spanwise uniform motions, possibly due to the global instability of the mean flow.
The present scale-by-scale energy transfer may benefit the improvement of subgrid modelling for large-eddy simulations, which will be considered in our future study.
Funding
This work is supported by the National Key R&D Program of China (grant no. 2019YFA0405201) and the National Natural Science Foundation of China (grant nos 92052301, 12202469).
Declaration of interests
The authors report no conflict of interest.



