


The application of green chemistry focuses on processes that reduce the production of hazardous substances. Moreover, minimizing production costs and using natural materials are significant considerations. Today, due to the presence of known contaminants and the emergence of new pollutants that are primarily the result of human activity, the environment and water supplies are increasingly becoming polluted. The use of green chemistry can be effective at preventing the development of environmental problems (Baloyi et al., Reference Baloyi, Ntho and Moma2018; Cardona et al., Reference Cardona, Korili and Gil2023). In recent years, various methods to remove pollutants from the environment and water supply using green chemistry approaches have been developed (Cardona et al., Reference Cardona, Korili and Gil2023; Lezehari et al., Reference Lezehari, Basly, Baudu and Bouras2010). Several of these methods include biological treatment, membrane separation technology, advanced oxidation process, solvent extraction and adsorption (Ismail & Mokhtar, Reference Ismail, Mokhtar and Nuro2021; Casti et al., Reference Casti, Basoccu, Mocci, De Luca, Porcheddu and Cuccu2022). Among these methods, adsorption can be a very efficient, economical and safe method for removing pollutants (Gupta et al., Reference Gupta, Jain, Nayak, Agarwal and Shrivastava2011; Mahmoud et al., Reference Mahmoud, Abdelfattah, Tharwat and Nabil2020). Recently, much research has focused on the use of new and natural adsorbents (Bhatnagar et al., Reference Bhatnagar, Vilar, Botelho and Boaventura2010; Casti et al., Reference Casti, Basoccu, Mocci, De Luca, Porcheddu and Cuccu2022). These novel adsorbents can include plant waste, fruit waste, bioadsorbents, waste materials left over from industry and agriculture and natural inorganic materials (Sharma et al., Reference Sharma, Kaur, Sharma and Sahore2011; Kyzas & Kostoglou, Reference Kyzas and Kostoglou2014; Ding et al., Reference Ding, Zuo and Qi2015; Wahab et al., Reference Wahab, Saeed, Ibrahim, Munir, Saleem, Zahra and Waseem2019; Elaiyappillai et al., Reference Elaiyappillai, Meena, Renuka, Santhiya, George and Kanimozhi2021; Azizpourian et al., Reference Azizpourian, Kouchakzadeh and Derikvand2023). Some researchers have focused their attention on natural inorganic materials as adsorbents because natural materials are readily available and inexpensive. Fine soil is one such material. Particles of fine soil are not visible to the naked eye. Fine soil with a particle size <2 μm is referred to as clay. The great interest in natural or modified clays is primarily attributed to their layered structure, large surface area, possibility of modification and easy accessibility (Bergaya & Lagaly, Reference Bergaya, Lagaly, Bergaya, Theng and Lagaly2006; Lezehari et al., Reference Lezehari, Basly, Baudu and Bouras2010; Vicente et al., Reference Vicente, Gil, Bergaya, Bergaya, Theng and Lagaly2013; Baloyi et al., Reference Baloyi, Ntho and Moma2018; Guo et al., Reference Guo, Aryana, Han and Jiao2018; Mahdi et al., Reference Mahdi, Aljeboree and Alkaim2021). The negative charge of clays’ layered structures are due to ionic substitutions in their crystal structures, increasing the ability of these minerals to adsorb cationic dyes (Shrivastava et al., Reference Shrivastava, Jain and Frank1985; Gillott, Reference Gillott and Gillott1987; Vicente et al., Reference Vicente, Gil, Bergaya, Bergaya, Theng and Lagaly2013). Researchers have used clays as excellent adsorbents to adsorb dyes from the environment (İyim & Güçlü, Reference İyim and Güçlü2009; Lezehari et al., Reference Lezehari, Basly, Baudu and Bouras2010; Shirsath et al., Reference Shirsath, Hage, Zhou, Sonawane and Ashokkumar2011; Adebowale et al., Reference Adebowale, Olu-Owolabi and Chigbundu2014; Fayazi et al., Reference Fayazi, Afzali, Taher, Mostafavi and Gupta2015; Bentahar et al., Reference Bentahar, Dbik, Khomri, Messaoudi and Lacherai2018; Kassimi et al., Reference Kassimi, Achour, Himri, Laamari and Haddad2021; Amrhar et al., Reference Amrhar, Berisha, Gana, Nassali and Elyoubi2023; Silva et al., Reference Silva, Balaba, Horsth, Jaerger and Anaissi2023).
Safranin (3,7-diamino-2,8-dimethyl-5-phenyl phenazin-5-ium chloride) is a cationic dye and an azonium compound that is highly soluble in water (Chisholm, Reference Chisholm1911; Kaur et al., Reference Kaur, Rani, Mahajan, Asif and Gupta2015; Sayed et al., Reference Sayed, Abdel-Gaber and Rahal2019). This dye is usually used for colouring cookies and sweets, as well as for dyeing wool, cotton, tannin, leather and paper (Kaur et al., Reference Kaur, Rani, Mahajan, Asif and Gupta2015; Sayed et al., Reference Sayed, Abdel-Gaber and Rahal2019; Suleman et al., Reference Suleman, Zafar, Ahmed, Rashid, Hussain and Razzaq2021). Safarin is used as a restaining agent in Gram staining and to detect the presence of glycosaminoglycans in meniscal structures (Shi et al., Reference Shi, Wang, Wang, Carlson and Li2021). However, the use of safranin in the food and drug industry is not safe, as this dye can have harmful effects on public health. The impacts of this dye on the skin, respiratory tract, cornea, lips and stomach have been proven (Fayazi et al., Reference Fayazi, Afzali, Taher, Mostafavi and Gupta2015; Bensalah et al., Reference Bensalah, Habsaoui, Dagdag, Lebkiri, Ismi and Rifi2021). Because of this, environmentalists have advised that industrial wastewater containing safranin needs to be treated before it enters the environment (Azad et al., Reference Azad, Ghaedi, Dashtian, Hajati, Goudarzi and Jamshidi2015; Fayazi et al., Reference Fayazi, Afzali, Taher, Mostafavi and Gupta2015). Much research has been carried out on the adsorption of safranin by different adsorbents (Lezehari et al., Reference Lezehari, Basly, Baudu and Bouras2010; Adebowale et al., Reference Adebowale, Olu-Owolabi and Chigbundu2014; Fayazi et al., Reference Fayazi, Afzali, Taher, Mostafavi and Gupta2015; Mohamed & Abukhadra, Reference Mohamed and Abukhadra2018; Derikvand et al., Reference Derikvand, Akbari, Kouchakzadeh, Azadbakht and Nemati2019; Bensalah et al., Reference Bensalah, Habsaoui, Dagdag, Lebkiri, Ismi and Rifi2021; Shi et al., Reference Shi, Wang, Wang, Carlson and Li2021; Suleman et al., Reference Suleman, Zafar, Ahmed, Rashid, Hussain and Razzaq2021; Moradi et al., Reference Moradi, Moradkhani, Hosseini and Olazar2022; Shwan, Reference Shwan2022; Uğraşkan et al., Reference Uğraşkan, Işık, Yazıcı and Çakar2022; Alkherraz et al., Reference Alkherraz, Elsherif and Blayblo2023; Mohan et al., Reference Mohan, Kumari, Kumari and Negi2023; Morrison et al., Reference Morrison, Strezov, Niven, Taylor, Wilson and Wang2023; Natal et al., Reference Natal, Cusioli, Magalhães-Ghiotto, Bergamasco and Gomes2023; Shaltout et al., Reference Shaltout, El-Naggar, Esmail and Hassan2024).
The present research deals with removing safranin dye from aqueous solution using natural and acidic-organic-treated fine soil. First, fine soil was prepared and then acidic-organic-treated fine soil synthesized. It is expected that acidic treatment affects the specific surface area of fine soil and removes some impurities from such samples (Boudriche et al., Reference Boudriche, Calvet, Hamdi and Balard2011; Yarmohammadi et al., Reference Yarmohammadi, Ghadermazi, Derikvand and Mozafari2022). Then, the effects of various parameters such as contact time, initial dye concentration, pH, temperature and adsorbent dosage on safranin removal by two adsorbents were investigated. The obtained findings were fitted to Langmuir, Freundlich and Temkin adsorption isotherms, and studies of adsorption kinetics were also carried out. The primary purpose of this work is to provide a method to remove safranin dye from aqueous solutions using available and suitable adsorbents. The importance of this method is related to the high efficiency of this natural adsorbent. To date, the removal of dyes has not been reported using the local fine soil employed in this work. As the fine soil used in this research has a diameter of <2 μm (Nooryazdan & Ghobadi, Reference Nooryazdan and Ghobadi2019), it is referred to as ‘clay’ here.
Materials and methods
Fine soil as a clay mineral was prepared using material from south-west Lorestan Province, Iran. Sodium chloride, sodium hydroxide, hydrochloric acid, sulfuric acid and ethanolamine were obtained from the Merck Company, all of analytical grade. Safranin (Sigma-Aldrich) was used as the adsorbate (Table 1). All solutions were prepared in distilled water.
Specifications of the safranin dye.

Preparation of adsorbents
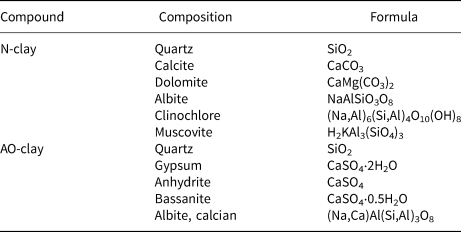
The clay mineral was washed with distilled water, sieved using a 200 μm meshed sieve and then dried at 95°C in an oven before use. The chemical composition of the used clay is given in Table 2, as assessed using X-ray diffraction (XRD).
Chemical compositions of N-clay and AO-clay according to XRD results.
This clay was used for the preparation of the acid-treated clay. The negative charge of the clay surface can be balanced with exchangeable cations such as Ca2+, Mg2+, Na+ and K+ (Braja & Dean, Reference Braja and Dean2012). For this purpose, 10 g of initial clay was added to 500 mL of 1 M sodium chloride. The mixture was stirred continuously for 3 h at room temperature and then washed with distilled water repeatedly. The resulting sample was dried at 60°C overnight. For acidic treatment, the resulting clay was placed in contact with 2 M sulfuric acid with a ratio of 1:50 for 2 h at 95°C (Kilislioğlu & Aras, Reference Kilislioğlu and Aras2010; Vifttaria et al., Reference Vifttaria, Nurhayati and Anita2019; Akbar et al., Reference Akbar, Akhtar, Khan, Jilani, Fashina and Deng2022). In the following step, 10 g of acidic clay was dispersed in 600 mL of distilled water at room temperature using a stirrer for 24 h. Then, ethanolamine was added to the mixture at a ratio of 1:2, and it was stirred for 5 h at 80°C (Zawrah et al., Reference Zawrah, Khattab, Saad and Gado2014). After 5 h, the sample was washed and dried at 90°C overnight, and then the acidic-organic-treated clay was stored for later use. The natural clay and acidic-organic-treated clay are named ‘N-clay’ and ‘AO-clay’, respectively, for ease of reference in the text.
Preparation of adsorbate
A stock solution of 100 mg L–1 safranin dye was prepared by dissolving 100 mg in 1 L distilled water. Safranin dye is highly soluble in water, and the colour of the solution is red. Test solutions with concentrations of 5, 10, 15 and 20 ppm were prepared by diluting the stock solution. The maximum wavelength in the visible spectra region was determined as 518 nm using an ultraviolet–visible (UV–Vis) spectrophotometer (Perkin Elmer Lambda 25). The concentration calibration curve was drawn for the desired concentrations for later use.
Studies of dye removal
Batch experiments of dye removal were carried out in conical flasks with 25 mL of dye solution in contact with the adsorbents on a magnetic stirrer (VELP, Italy). The amount of residual dye in the desired solutions was determined using a UV–Vis spectrophotometer at regular time intervals after the samples were centrifuged (ALC, Italy). The experiments on the effects of concentration, contact time, pH and temperature were carried out to determine the optimum conditions for dye removal. The experiments were continued until dye concentration remained constant. When dye concentration achieved a constant value, the adsorption process had reached equilibrium. To determine the optimal amount of adsorbent, various doses of each adsorbent (0.4, 1.2, 2.0, 2.8 and 3.2 g L–1) were placed in contact with the dye solution of the appropriate concentration. To evaluate the effects of initial concentration and contact time, the absorption of solutions with various concentrations (5–20 ppm) was first read using a UV–Vis spectrophotometer. A certain amount of adsorbent was added to the solutions, and the residual concentration was determined at regular time intervals. The pH effects were studied using 0.1 M HCl and 0.1 M NaOH to adjust the desired pH range from 3 to 11. To evaluate the influence of temperature, the experiments were conducted at 27°C, 37°C and 47°C. All experiments were repeated at least three times to ensure the accuracy of the obtained data. Following this, the amount of adsorbed dye at equilibrium condition (q e) and the adsorption capacity of adsorbents at a time t (qt) were estimated using Equations 1 & 2, respectively (Nourmoradi et al., Reference Nourmoradi, Moghadam, Jafari and Kamarehie2018; Żółtowska-Aksamitowska et al., Reference Żółtowska-Aksamitowska, Bartczak, Zembrzuska and Jesionowski2018; Pap et al., Reference Pap, Kirk, Bremner, Sekulić, Shearer, Gibb and Taggart2020; Silva et al., Reference Silva, Balaba, Horsth, Jaerger and Anaissi2023):
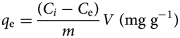

where Ci, C e and Ct are initial concentration, equilibrium concentration and concentration of safranin dye at time t (mg L–1), respectively. In addition, m and V are the weight of the adsorbent (g) and dye solution volume (L), respectively. The removal percentage (R%) of safranin dye of the desired adsorbents was estimated using Equation 3 (Pouretedal & Sadegh, Reference Pouretedal and Sadegh2014; Banerjee et al., Reference Banerjee, Das, Zaman and Das2016; Mondal et al., Reference Mondal, Aikat and Halder2016; Uygun et al., Reference Uygun, Murat and Çakal2023; Zeng et al., Reference Zeng, Nie, Qin, Luo, Fu and Yu2023):

Adsorption isotherms
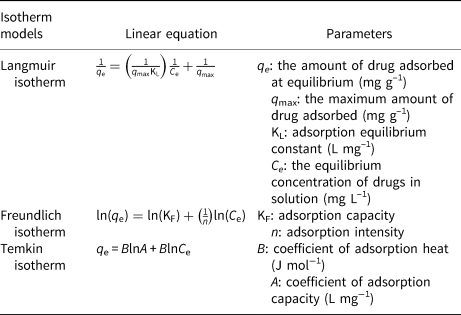
Adsorption isotherms refer to the variation in the amount of adsorbate on the adsorbent surface with change in concentration at a constant temperature (Foo & Hameed, Reference Foo and Hameed2010). The adsorption isotherm can provide useful information regarding the adsorption process and adsorbent performance (Duan et al., Reference Duan, Song and Zhou2019; Uğraşkan et al., Reference Uğraşkan, Işık, Yazıcı and Çakar2022). Adsorption isotherm models include Langmuir, Freundlich and Temkin equations, which are widely used to describe the adsorption equilibrium process (Saha et al., Reference Saha, Das, Das, Bhowal and Bhattacharjee2021; Azizpourian et al., Reference Azizpourian, Kouchakzadeh and Derikvand2023). To study the adsorption isotherm in this work, experiments were performed using 2 g L−1 of the desired adsorbent in 25 mL dye solution at pH 9 using various initial concentrations of safranin dye (5, 10, 15 and 20 ppm) for 40 min at three temperatures. When the adsorbate is bound with one functional group on the adsorbent surface, the Langmuir isotherm equation (Table 3) can describe the adsorption process (Langmuir, Reference Langmuir1918; Baccar et al., Reference Baccar, Sarrà, Bouzid, Feki and Blánquez2012; Banerjee et al., Reference Banerjee, Das, Zaman and Das2016; Shaltout et al., Reference Shaltout, El-Naggar, Esmail and Hassan2024). Freundlich's empirical equation shows the dependence between the amount of adsorbate on the adsorbent surface and the concentration of the solution (Banerjee et al., Reference Banerjee, Das, Zaman and Das2016; Shaltout et al., Reference Shaltout, El-Naggar, Esmail and Hassan2024). This isotherm is related to a heterogeneous surface (Mondal et al., Reference Mondal, Aikat and Halder2016; Saha et al. Reference Saha, Das, Das, Bhowal and Bhattacharjee2021). For the Temkin isotherm, B and A are the coefficient of adsorption heat (J mol−1) and coefficient adsorption capacity (L mg−1), respectively (Chakravarty & Banerjee, Reference Chakravarty and Banerjee2012; Bassir & Shadizadeh, Reference Bassir and Shadizadeh2020). The linear equations of the Freundlich and Temkin isotherms are also given in Table 3. The Langmuir isotherm also describes the RL parameter, which is a dimensionless number and indicates the nature of the adsorption. RL was calculated using Equation 4:

where KL is the adsorption equilibrium constant (L mg–1) and C 0 is the initial concentration of the adsorbate (mg L−1). When 0 < RL < 1, the Langmuir isotherm is favourable. However, if this parameter is equal to 1, the Langmuir isotherm is unfavourable (Mondal et al., Reference Mondal, Aikat and Halder2016; Alkherraz et al., Reference Alkherraz, Elsherif and Blayblo2023; Shaltout et al., Reference Shaltout, El-Naggar, Esmail and Hassan2024).
Linear equations of the adsorption isotherm models.
Adsorption thermodynamics and kinetics
Thermodynamic parameters play an important role when investigating adsorption behaviour (Banerjee et al., Reference Banerjee, Das, Zaman and Das2016; Yurtay & Kılıç, Reference Yurtay and Kılıç2023). The thermodynamic parameters, including ΔH° (enthalpy change; kJ mol−1), ΔG° (Gibbs free energy change; kJ mol−1) and ΔS° (entropy change; J mol−1 K−1), can be evaluated using the Van ‘t Hoff equations (Equations 5–7):


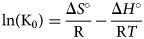
where K0 is the equilibrium constant and T and R are temperature (K) and the universal gas constant, respectively (Chowdhury & Viraraghavan, Reference Chowdhury and Viraraghavan2009; Chakravarty & Banerjee, Reference Chakravarty and Banerjee2012; Morrison et al., Reference Morrison, Strezov, Niven, Taylor, Wilson and Wang2023; Njaramba et al., Reference Njaramba, Kim, Yea, Yoon and Park2023).
Linear kinetic equations can reasonably accurately determine the rate of safranin removal from a solution. Based on adsorption kinetics, the amount of adsorbate is measured with respect to time, and the experimental data are compared to kinetic models (Pouretedal & Sadegh, Reference Pouretedal and Sadegh2014; Bentahar et al., Reference Bentahar, Dbik, Khomri, Messaoudi and Lacherai2018; Nourmoradi et al., Reference Nourmoradi, Moghadam, Jafari and Kamarehie2018; Yin et al., Reference Yin, Deng, Yu, Wang and Xu2018; Lima et al., Reference Lima, Sher, Guleria, Saeb, Anastopoulos, Tran and Hosseini-Bandegharaei2021; Abbou et al., Reference Abbou, Lebkiri, Ouaddari, Kadiri, Ouass and Elamri2022).
In this work, pseudo-first-order, pseudo-second-order, Elovich and intraparticle diffusion models (Guo et al., Reference Guo, Liu, Wang, Zeng, Hu and Zheng2015; Largitte & Pasquier, Reference Largitte and Pasquier2016; Manjuladevi et al., Reference Manjuladevi, Anitha and Manonmani2018; Edet & Ifelebuegu, Reference Edet and Ifelebuegu2020; Wang et al., Reference Wang, Zhao, Wang and Cui2021; Hongsawat & Prarat, Reference Hongsawat and Prarat2022; Uğraşkan et al., Reference Uğraşkan, Işık, Yazıcı and Çakar2022) were used to determine the type of adsorption kinetics observed (Table 4). Two significant aspects of the intraparticle diffusion model are the film diffusion (D F) and intraparticle diffusion (D P) coefficients. The D F coefficient determines whether an adsorption process is controlled by film diffusion and the D P coefficient reflects control of the adsorption process by intraparticle diffusion (Equations 8 & 9):


where r 0 (cm) and Γ are the radius of the adsorbent particle and film thickness, respectively, t 0.5 is the time necessary to complete half of the process (min) and C S and C L are the substrate concentrations in the solid and solution at t time, respectively. When D P is the range 10–11–10–13 cm2 s–1, it can be stated that the process rate is controlled by the intraparticle diffusion. When D F is in the range of 10–6–10–8 cm2 s–1, the rate of adsorption process is controlled by film diffusion (Sepehr et al., Reference Sepehr, Amrane, Karimaian, Zarrabi and Ghaffari2014; Obradović, Reference Obradović2020).
Linear equations of the adsorption kinetic models.
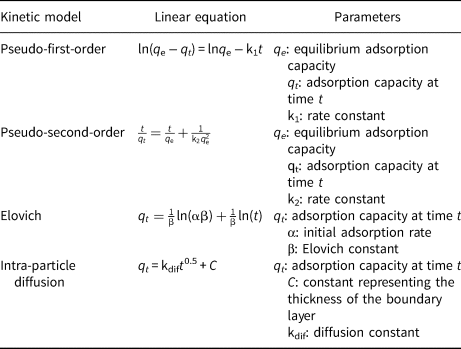
The study of adsorption thermodynamics and kinetics was carried out at three temperatures (27°C, 37°C and 47°C) under optimal conditions of concentration, pH and amount of adsorbent.
Results and discussion
Characterization of adsorbents
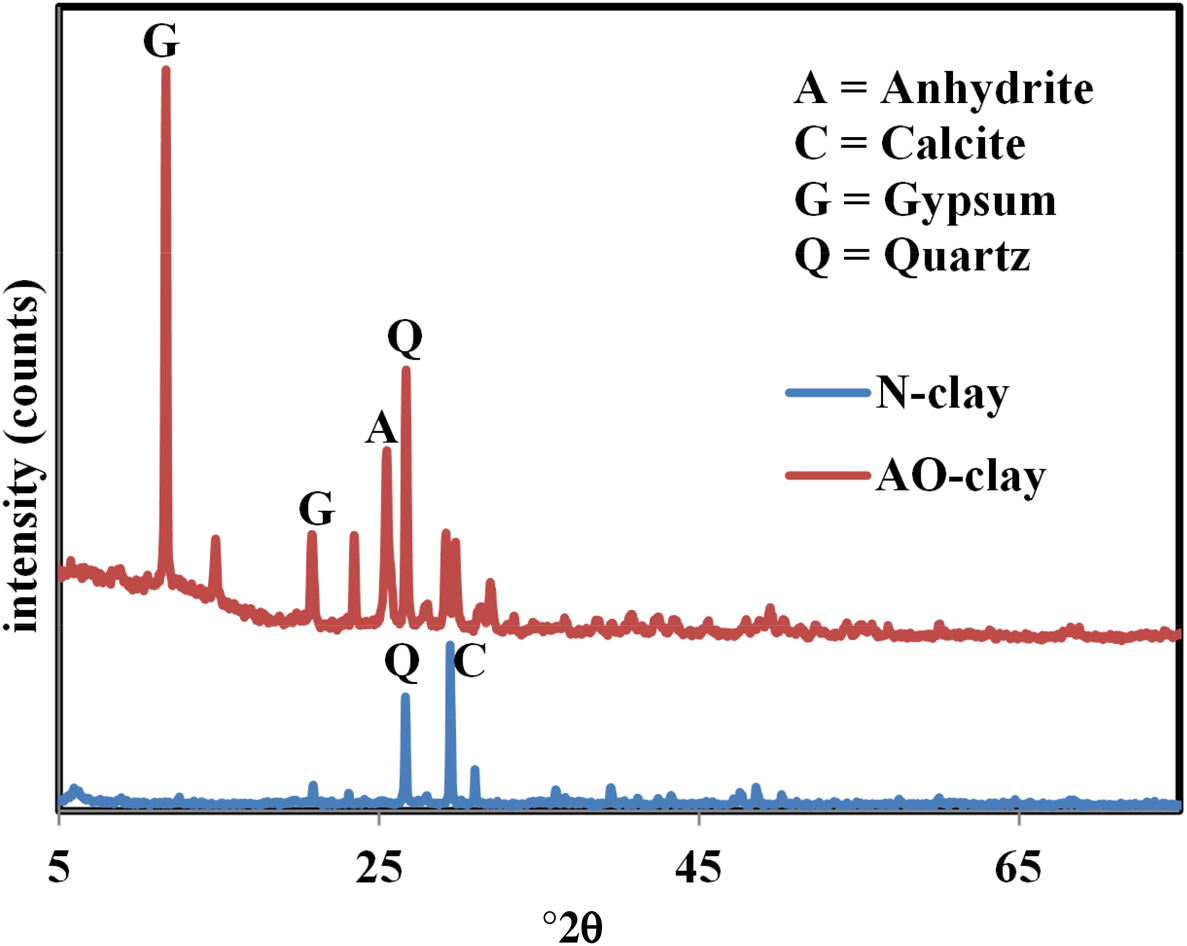
N-clay and AO-clay were identified using an XRD instrument (Bruker, Germany), and their traces are displayed in Fig. 1. These traces were taken using a Cu-Kα source (λ = 0.154 nm). As mentioned in Table 2, fine soils contain various clay minerals. The clearest peaks for N-clay and AO-clay were calcite and gypsum, respectively, and other minerals were found in minor quantities. Clay modification caused changes the structure of the AO-clay (Fig. 1b). Calcite and dolomite minerals were altered, and gypsum, anhydrite and basanite minerals were produced. In addition, by comparing Fig. 1a and Fig. 1b, it can be estimated that, due to the decrease in the intensity of the quartz, montmorillonite and calcite peaks, the cohesion of the layers decreased. The values of the peaks at the diffraction angle °2θ ≈ 32 correspond to the quartz phase (Ding et al., Reference Ding, Zuo and Qi2015), and the intensity of the quartz peak is different in the desired adsorbents. According to these data, the basal spacing of AO-clay was more significant than the basal spacing of N-clay. The basal spacings of N-clay and AO-clay were estimated using Bragg's law (Haoue et al., Reference Haoue, Derdar, Belbachir and Harrane2020) at ~2.95 and 7.32 Å, respectively. The increase in the basal spacing of AO-clay may be attributed to the intercalation of ethanolamine in the interlaminar space of the clay (Christidis, Reference Christidis and Christidis2012; Lόpez-Chavez et al., Reference Lόpez-Chavez, Osorio-Revilla, Arellano-Cárdenas, Gallardo-Velázquez, Flores-Valle and Lόpez-Cortez2017; Shivaraju et al., Reference Shivaraju, Egumbo, Madhusudan, Kumar and Midhun2018).
XRD traces of (a) N-clay and (b) AO-clay.
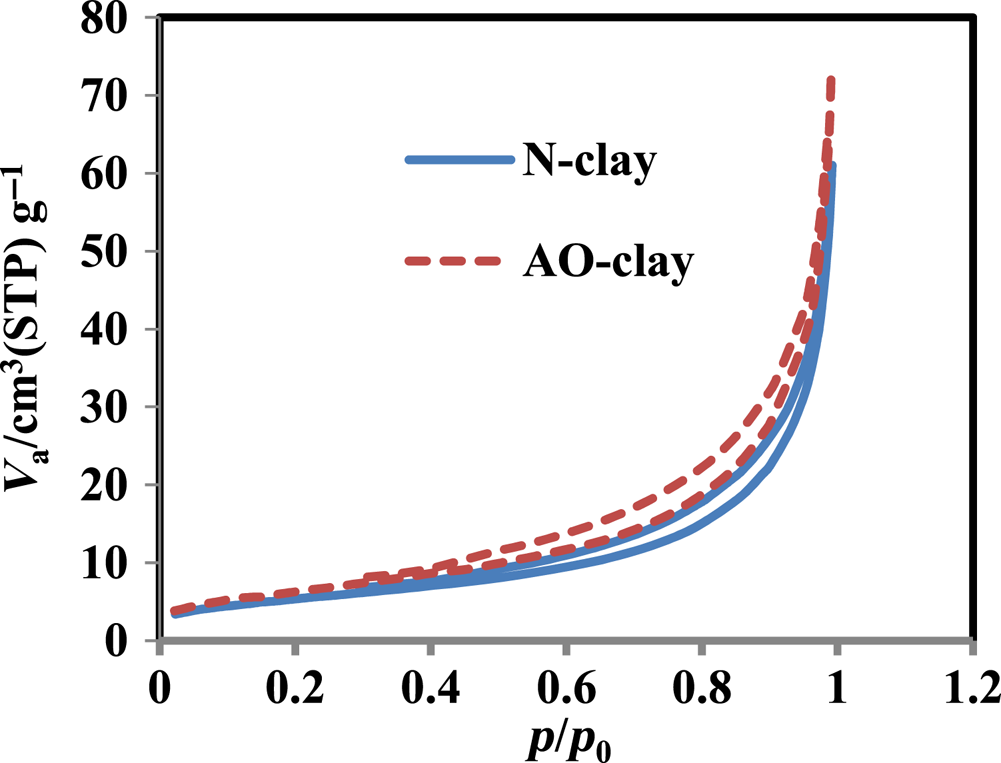
The specific surface area and pore volume of the desired adsorbents were determined using the Brunauer–Emmett–Teller (BET) method (Fig. 2). Figure 2 shows that the hysteresis loop is similar to type H3. These particles are flexible and expandable and contain slit-shaped pores (Panda et al., Reference Panda, Mishra, Mishra and Singh2010). The BET-specific surface areas were estimated at 25.180 and 23.472 m2 g–1 for N-clay and AO-clay, respectively. The pore volume values were also reported to be 5.78 and 4.69 m3 g–1 for N-clay and AO-clay, respectively. According to the BET results, the desired adsorbents were identified as mesoporous materials with mean pore diameters of 9.28 and 17.33 nm for N-clay and AO-clay, respectively. These results show that the clay layers were slightly separated and that they underwent good cleavage in one or two directions, creating thin plates (Ruíz-Agudo et al., Reference Ruíz-Agudo, Álvarez-Lloret, Ibáñez-Velasco and Ortega-Huertas2016). In addition, the specific surface area after the adsorption process of the natural clay absorbent was found to be 20.413 m2 g–1.
N2 adsorption/desorption isotherms of N-clay and AO-clay. STP = standard temperature and pressure; V a = total pore volume.
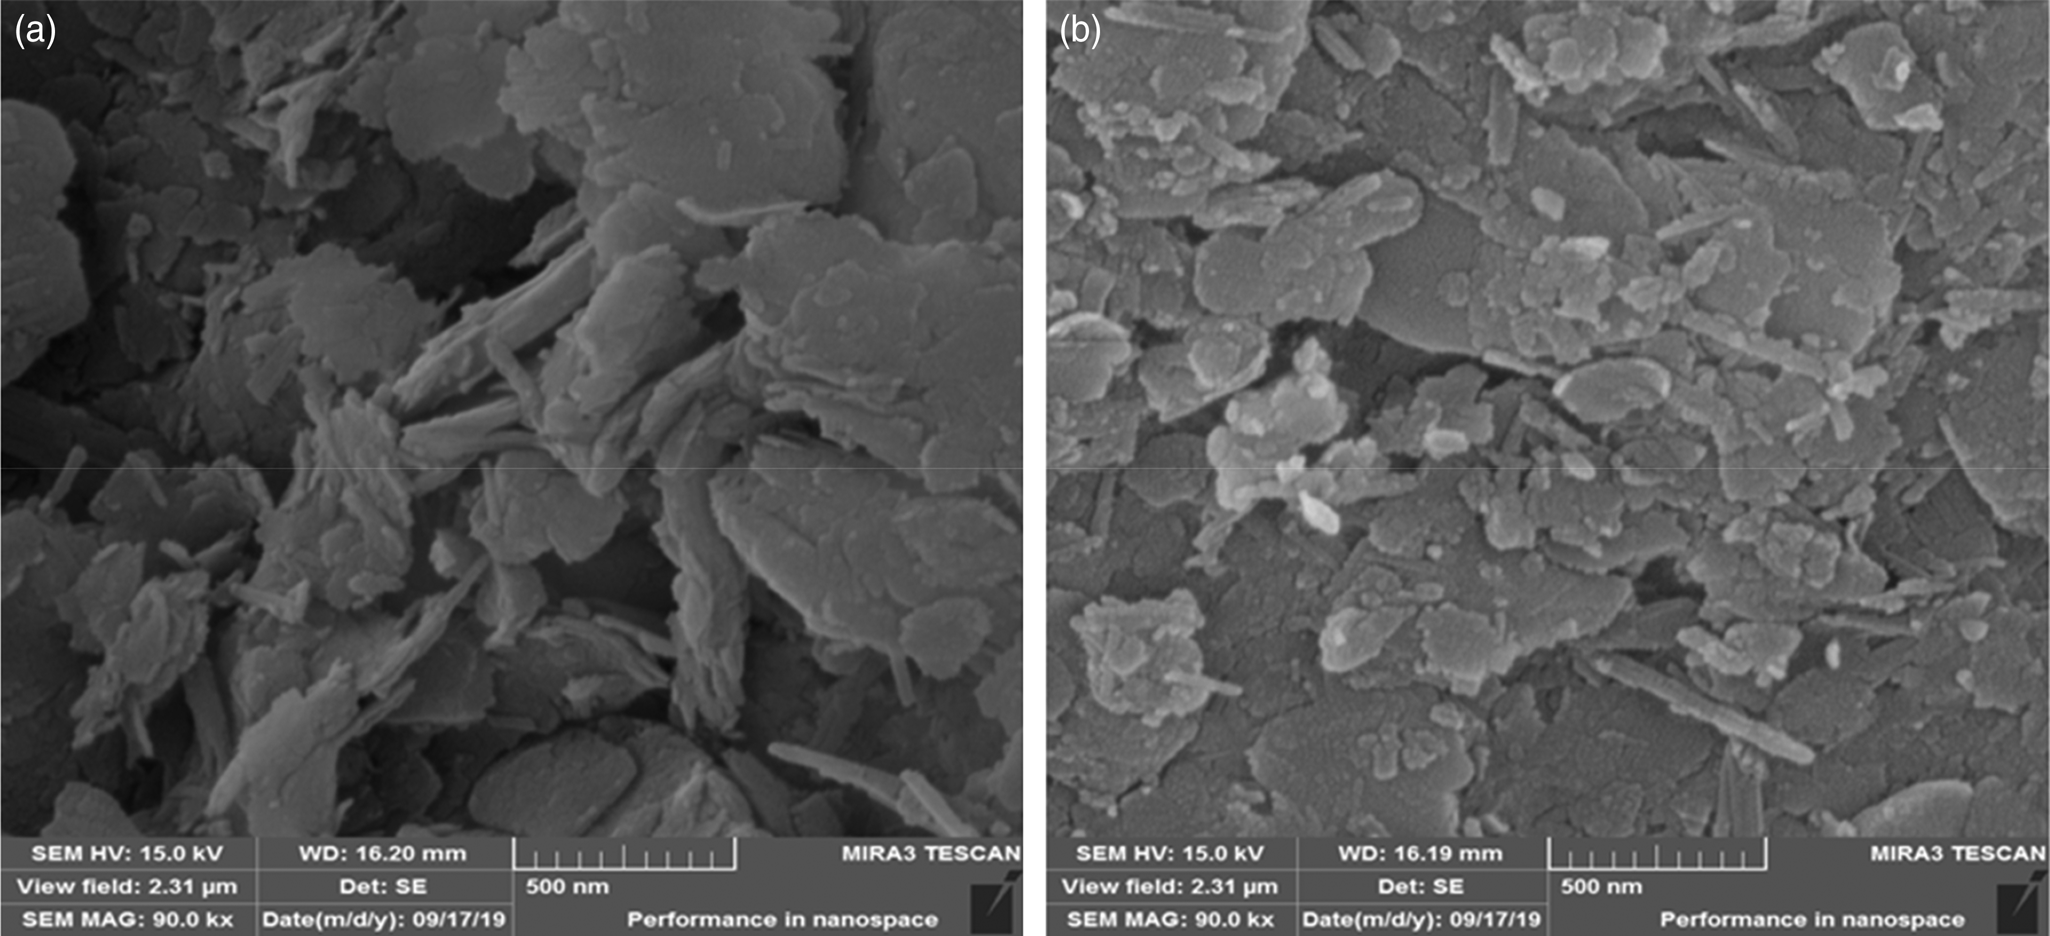
Scanning electron microscopy (SEM) imaging was used to characterize the morphology of the desired adsorbents (Fig. 3) using an MIRA3 TESCAN SEM device (Czechia). The difference in the morphology of the desired adsorbents is due to the change in the structure of the AO-clay adsorbent. Figure 3a shows the N-clay structure taking the form of sheets and glossy layers containing calcite, quartz and montmorillonite minerals (Perri et al., Reference Perri, Cirrincione, Critelli, Mazzoleni and Pappalardo2008; Chen et al., Reference Chen, Jin, Chen, Megharaj and Naidu2011; Christidis, Reference Christidis and Christidis2012; Choi et al., Reference Choi, Choi, Inoue and Sengoku2017; Guo et al., Reference Guo, Aryana, Han and Jiao2018). As can be seen in Fig. 3b, rod structures can be attributed to the gypsum and anhydrite minerals in AO-clay.
SEM images of (a) N-clay and (b) AO-clay.
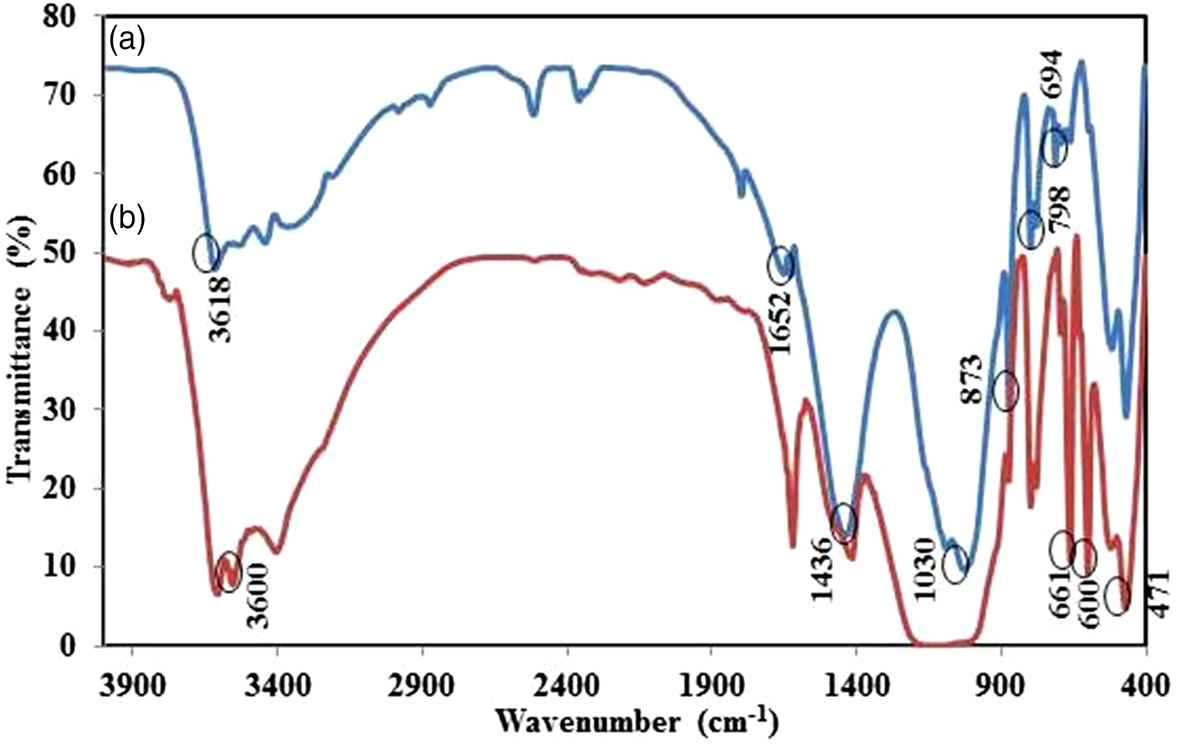
Fourier-transform infrared (FTIR) spectroscopy was used to characterize molecular bonding in the adsorbents (Fig. 4) using a Perkin-Elmer Spectrum RXI FTIR spectrophotometer (USA) with a KBr pellet in the range of 4000–400 cm–1. Most bands in Fig. 4 were found between 450 and 1100 cm–1. The peaks in the range of 670–797 cm–1 may be attributed to the Si–O and Si–O–Al stretching vibrations of the quartz mineral in the desired adsorbents (Rezende et al., Reference Rezende, Ramos, De Oliveira, Oliveira and De Jesús2018; Marsh et al., Reference Marsh, Heath, Patureau, Evernden and Walker2019; Shwan, Reference Shwan2022). In AO-clay, a weak doublet peak in the range of 602–662 cm–1 may be related to the in-plane and out-of-plane bending vibrations of SO42– (Kamaraj et al., Reference Kamaraj, Lakshmi, Rose and Muralidharan2017). In N-clay, the absorption peak at ~1652 cm–1 can be attributed to the presence of adsorbed water in the material (Rezende et al., Reference Rezende, Ramos, De Oliveira, Oliveira and De Jesús2018). Additionally, the bands at ~3400 and ~3700 cm–1 correspond to OH group vibration elongations (Boudriche et al., Reference Boudriche, Calvet, Hamdi and Balard2011; Rezende et al., Reference Rezende, Ramos, De Oliveira, Oliveira and De Jesús2018; Azizpourian et al., Reference Azizpourian, Kouchakzadeh and Derikvand2023).
FTIR spectra of (a) N-clay and (b) AO-clay.
Investigating the adsorption of safranin dye
Effect of adsorbent dose
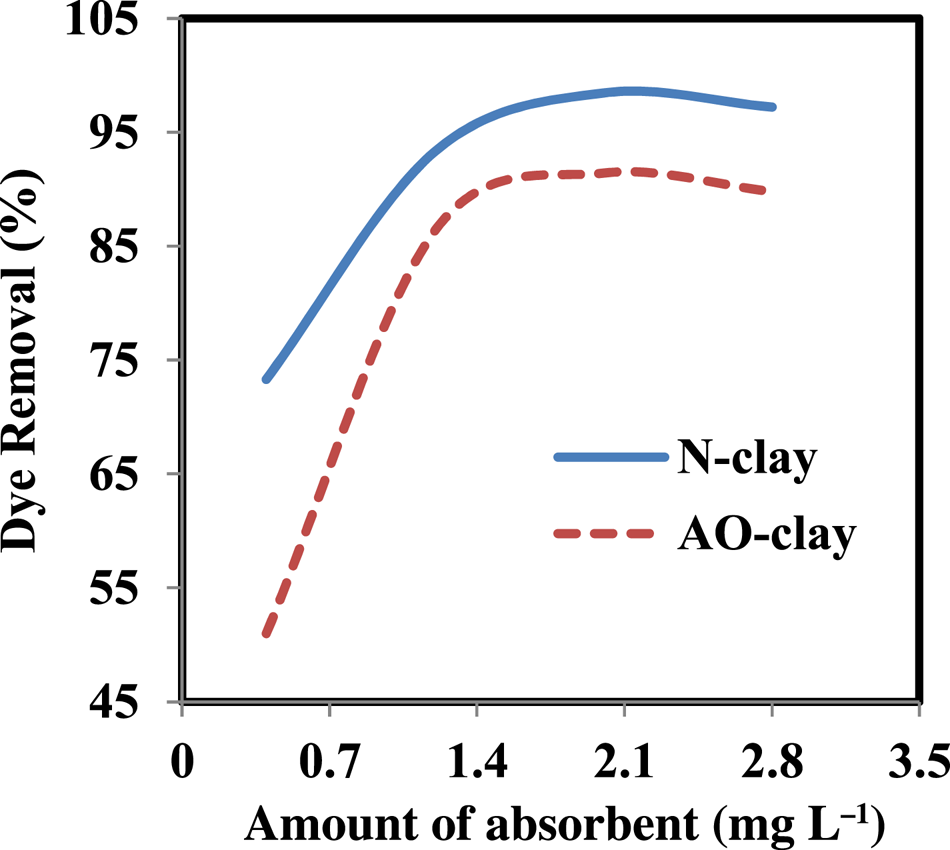
The effect of the adsorbent dose on the adsorption of safranin was first evaluated using various amount of the desired adsorbent. The preliminary experiments showed that the desired adsorbent can remove the dye in a very short time, so the highest concentration of safranin was chosen to determine the effect of the amount of adsorbent. The best adsorbent amount in 20 ppm safranin solution was reported as 2 g L–1 for N-clay and AO-clay. The highest percentages of dye removal for the optimal amount of adsorbent were 98.4% and 91.4% for N-clay and AO-clay, respectively (Fig. 5). A decrease in removal efficiency after achieving adsorption equilibrium may indicate that the dye molecules accumulated at the adsorbent sites (Pouretedal & Sadegh, Reference Pouretedal and Sadegh2014; Derikvand et al., Reference Derikvand, Akbari, Kouchakzadeh, Azadbakht and Nemati2019). These optimal amounts of adsorbent were used in the subsequent experiments.
Effect of adsorbent dose on the performance of N-clay and AO-clay adsorbents (dye concentration = 20 ppm, contact time = 40 min, aqueous medium, temperature = 25°C).
Effects of initial concentration and contact time
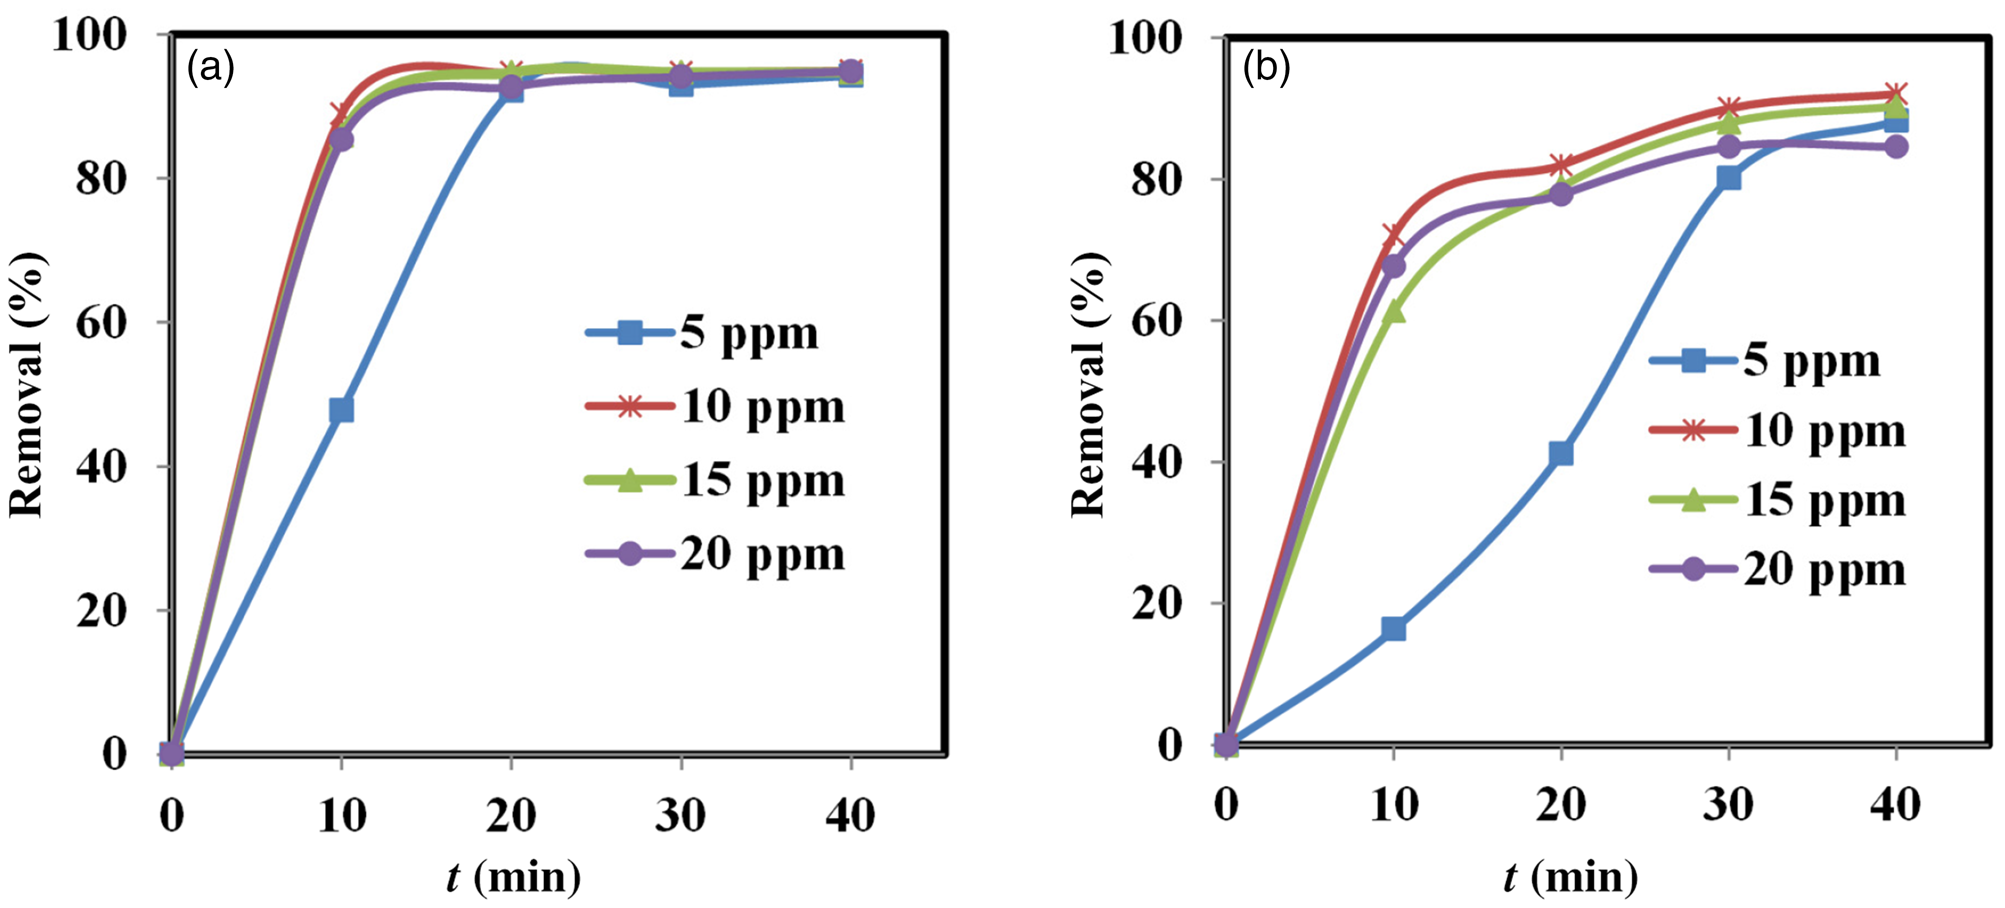
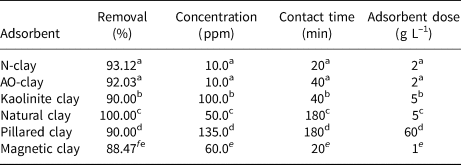
The adsorption process depends on the initial adsorbate concentration and the contact time (Banerjee et al., Reference Banerjee, Das, Zaman and Das2016). At the optimal contact time, the adsorption process can reach equilibrium. Figure 6 & Table 5 show the effects of initial dye concentration and contact time on dye removal by N-clay and AO-clay adsorbents.
Effects of contact time and concentration on the performance of (a) N-clay and (b) AO-clay adsorbents (adsorbent dose = 2 g L–1, aqueous medium, temperature = 25°C).
Comparative results regarding the effects of initial dye concentration and contact time for different adsorbents.
a This work.
b Adebowale et al. (Reference Adebowale, Olu-Owolabi and Chigbundu2014).
c Shwan (Reference Shwan2022).
d Lezehari et al. (Reference Lezehari, Basly, Baudu and Bouras2010).
eFayazi et al. (Reference Fayazi, Afzali, Taher, Mostafavi and Gupta2015).
The value of dye removal percentage in contact with 2 g L–1 adsorbent was calculated using Equation 3. The greatest dye removal percentages were found to be 93.12% in contact with N-clay after 20 min and 92.03% in contact with AO-clay after 40 min. The adsorption process was nearly constant after 20 and 40 min for N-clay and AO-clay, respectively (Fig. 6), and the process reached equilibrium. We can predict that the dye molecules would be located on the surface of the N-clay, whereas they would be located along the cleavages of the AO-clay. This difference in the function of adsorbents leads to decreasing the time to establish equilibrium in adsorption for the N-clay adsorbent. The efficiency of the adsorbent reduced with increasing concentration, and this may be due to the occupation of the active sites of the adsorbent by the adsorbate (Banerjee et al., Reference Banerjee, Das, Zaman and Das2016).
Effect of pH
pH is a significant parameter that can affect the adsorption capacity and properties of adsorbates and adsorbents (Tezcanli-Güyer & Ince, Reference Tezcanli-Güyer and Ince2004; Mohamed & Abukhadra, Reference Mohamed and Abukhadra2018; Bernal et al., Reference Bernal, Giraldo and Moreno-Piraján2020). To determine the optimal pH in the process of safranin removal, various pH values ranging from 3 to 11 were investigated. With increasing pH from 3 to 11, the dye removal percentage varied such that the maximum dye removal percentages were 88.93% at pH 9 for the AO-clay adsorbent and 91.9% at pH 9 for the N-clay adsorbent (Fig. 7).
Effect of pH on the performance of N-clay and AO-clay adsorbents (dye concentration = 10 ppm, adsorbent dose = 2 g L–1, contact time = 40 min, pH = 3–11, temperature = 25°C).
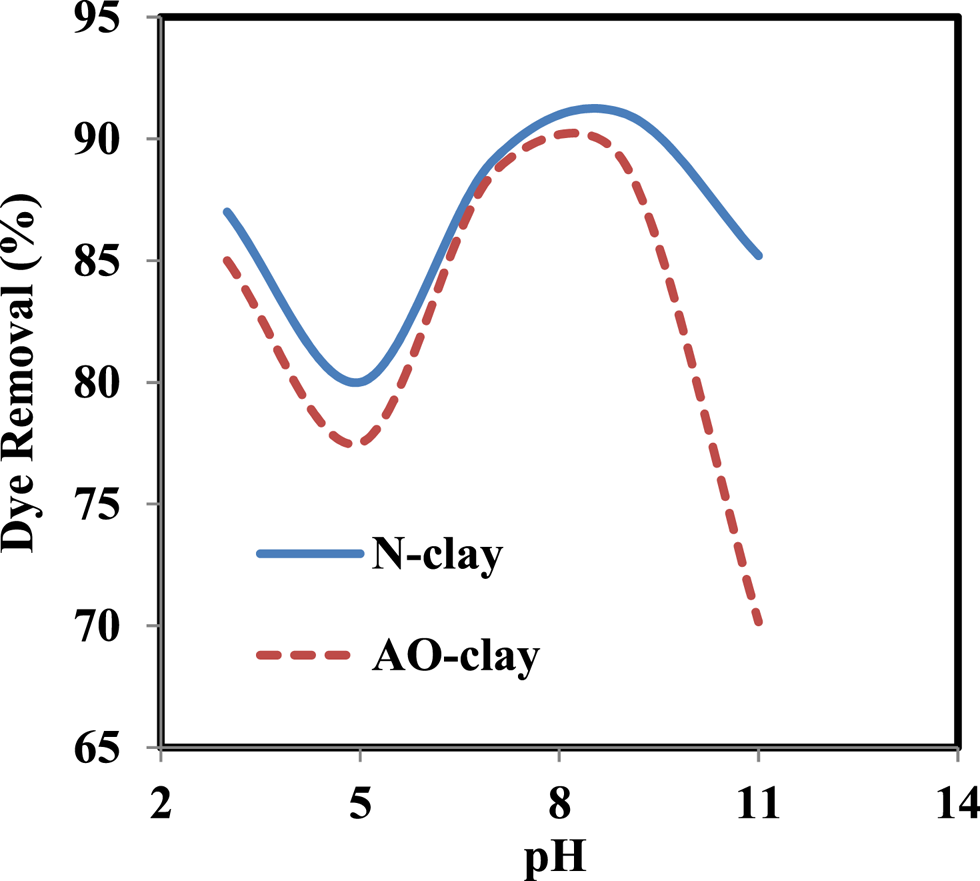
The clay's layered structure has a mostly negative charge; therefore, it can interact with dye molecules that possess a positive charge (Shrivastava et al., Reference Shrivastava, Jain and Frank1985). The surface charge of the adsorbent, the functional groups, the adsorbate charge and the pH of the solution can affect the dye removal percentage. At pH 3, we may assume that as the surface charge of the adsorbent is more negative than at pH 5, the interaction between adsorbent and adsorbate increases and the dye removal percentage improves. At basic pH, the dye removal percentage and electrostatic interactions increase due to the presence of hydroxyl ions. At higher pH values, the dye removal percentage decreases due to occupation of the active sites of the adsorbent (El-Kemary et al., Reference El-Kemary, Abdel-Moneam, Madkour and El-Mehasseb2011; Kassimi et al., Reference Kassimi, Achour, Himri, Laamari and Haddad2021; Suleman et al., Reference Suleman, Zafar, Ahmed, Rashid, Hussain and Razzaq2021; Mohan et al., Reference Mohan, Kumari, Kumari and Negi2023).
Effect of temperature and determination of thermodynamic parameters
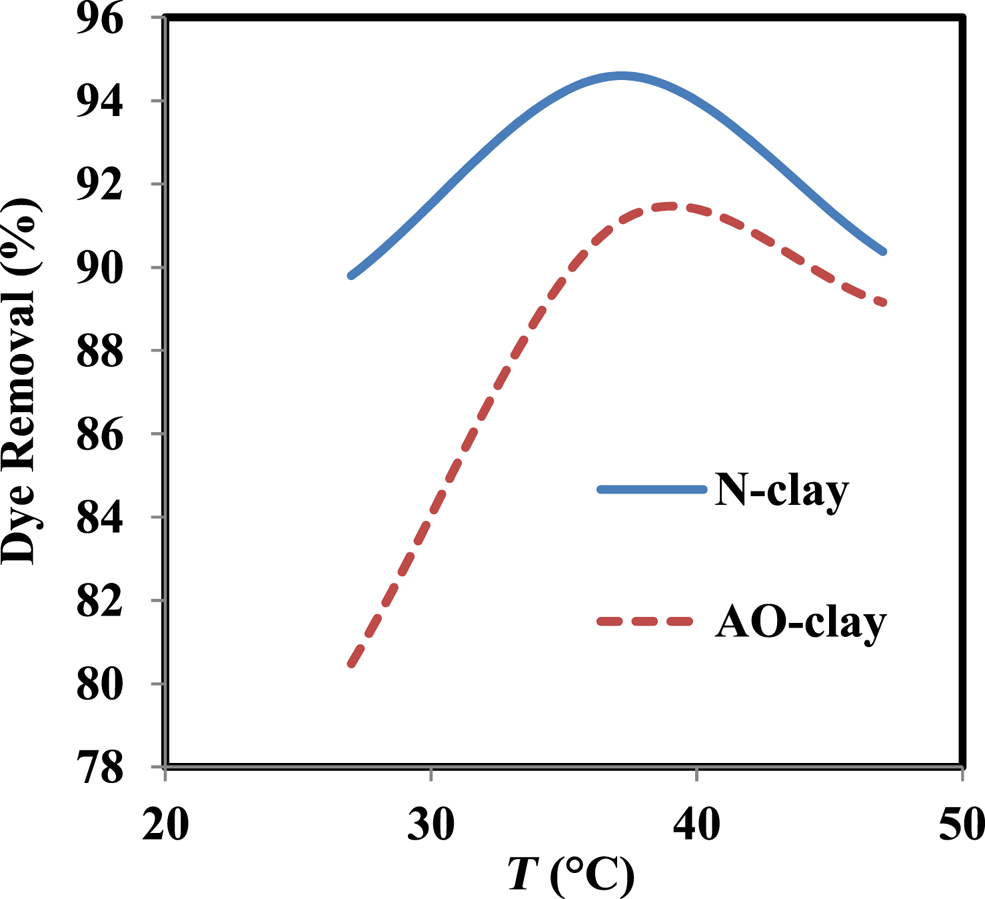
Temperature can have a significant impact on the dye removal percentage and thermodynamics of adsorption (Banerjee et al., Reference Banerjee, Das, Zaman and Das2016; Bentahar et al., Reference Bentahar, Dbik, Khomri, Messaoudi and Lacherai2018). In this study, the effect of temperature was examined at various temperatures: 27°C, 37°C and 47°C. The obtained results show that the dye removal percentage increases from 27°C to 37°C and decreases from 37°C to 47°C. The optimal temperature in the dye removal process occurred at 37°C, and the dye removal percentages were 94.6% and 91.1% when in contact with N-clay and AO-clay adsorbents, respectively.
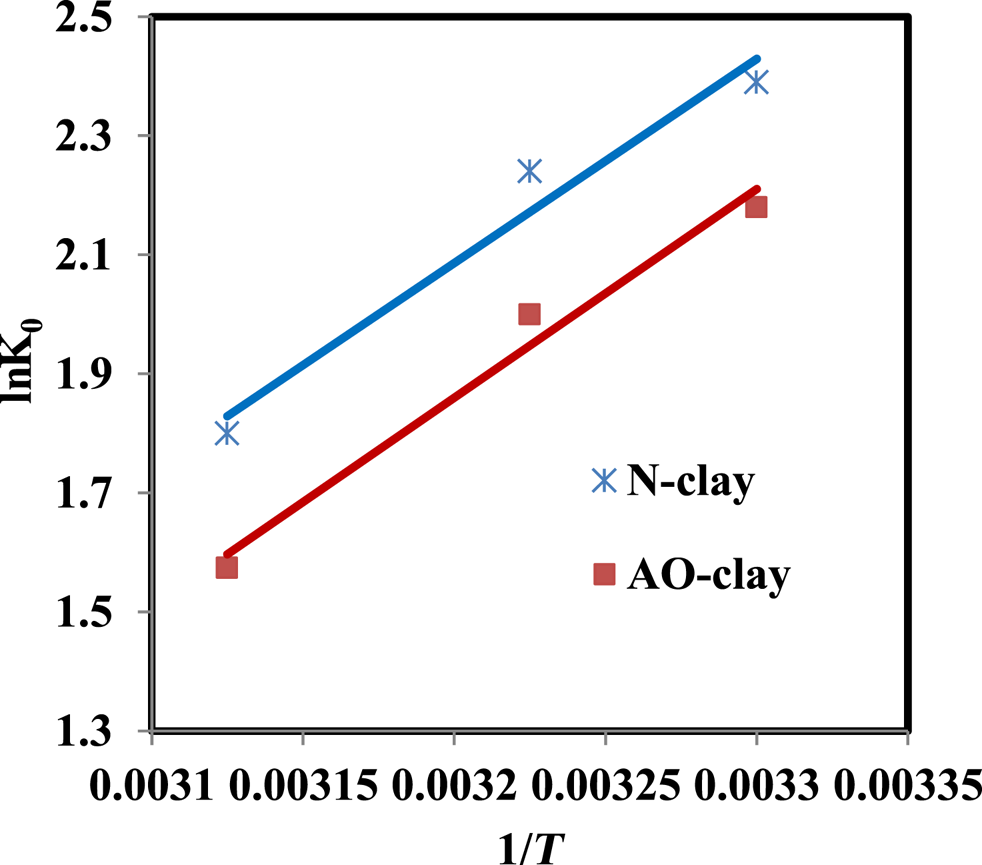
According to Fig. 8, the decrease in the dye removal percentage at 47°C might be due to the increase in the movement of dye molecules to different adsorbent sites (Albroomi et al., Reference Albroomi, Elsayed, Baraka and Abdelmaged2016) or to the weak bonds between the dye and the adsorbent surface (Banerjee et al., Reference Banerjee, Das, Zaman and Das2016). Studying the effect of temperature on the safranin removal process can help us to evaluate thermodynamic parameters such as ΔH°, ΔG° and ΔS° using Equations 5–7. ΔH° and ΔS° can be calculated by plotting lnK0 vs 1/T, so that, based on Equation 7, these parameters can be estimated from the values of the slope and the intercept (Xu et al., Reference Xu, Wang and Zhu2012).
Effect of temperature on the performance of N-clay and AO-clay adsorbents (dye concentration = 10 ppm, adsorbent dose = 2 g L–1, contact time = 40 min, pH = 9).
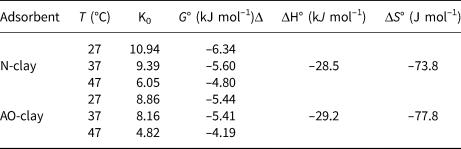
The results show that the ΔG° values are negative and the adsorption process can be spontaneous (Fig. 9 & Table 6). The ΔH° and ΔS° values are also negative. The negative value of ΔH° indicates that the adsorption process is exothermic, and the value of ΔS° indicates decreased randomness at the solid–liquid interface during the adsorption process (Xu et al., Reference Xu, Wang and Zhu2012). When the AO-clay adsorbent was placed in solution, its anhydrite molecules can hydrolyse; therefore, the process is more exothermic than the process of adsorption when in contact with N-clay.
Plot of lnK0 vs 1/T (dye concentration = 10 ppm, adsorbent dose = 2 g L–1, contact time = 40 min, pH = 9).
Thermodynamic parameters for the removal of safranin dye by N-clay and AO-clay adsorbents (dye concentration = 10 ppm, adsorbent dose = 2 g L–1, contact time = 40 min, pH = 9).
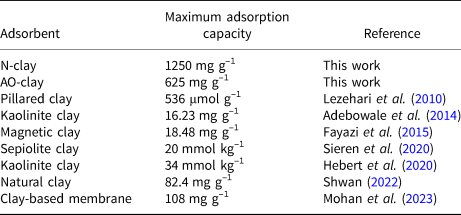
By determining the optimum conditions of safranin adsorption using N-clay and AO-clay adsorbents in this work, we can compare these results with recent work conducted by other researchers (Table 7). In this research, the optimum conditions are dye concentration = 10 ppm, adsorbent dose = 2 g L–1, contact time = 40 min and pH = 9.
Comparison of safranin adsorption capacity as determined by this work with results from other researchers.
Study of adsorption isotherms
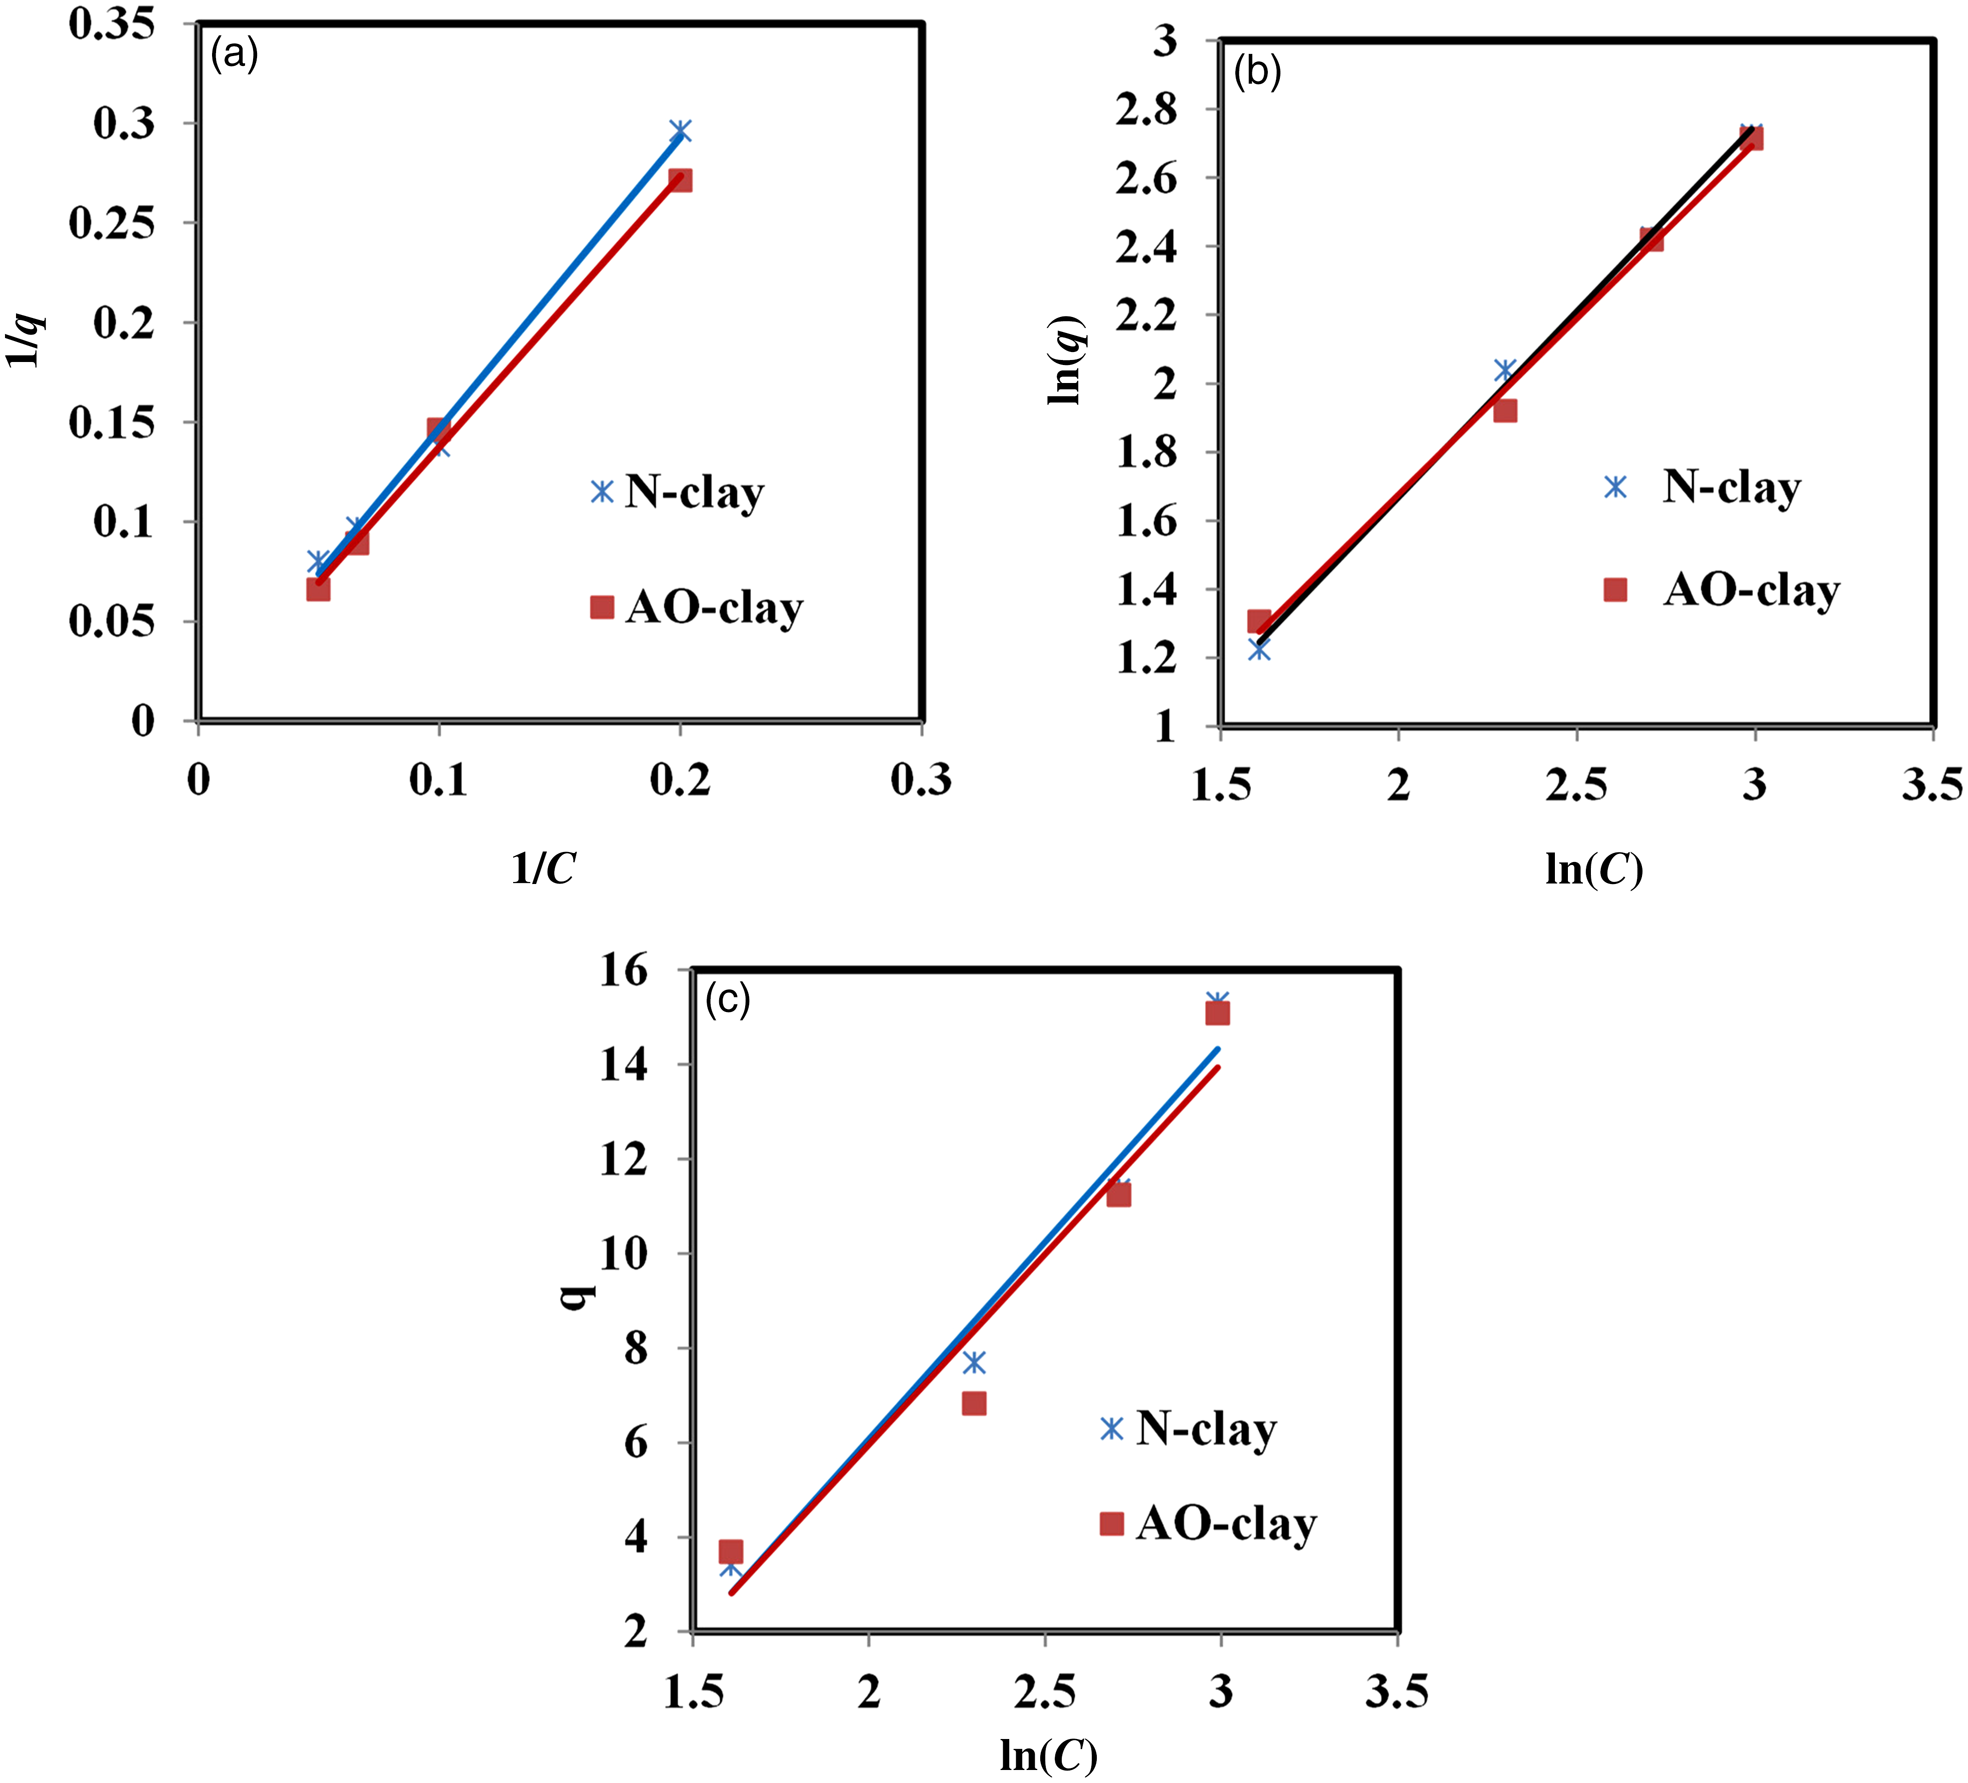
Adsorption isotherms were investigated using the equations shown in Table 3. Figure 10 indicates the plots of Langmuir, Freundlich and Temkin isotherms for the adsorption of safranin dye on the desired adsorbents. Table 8 summarises the Langmuir, Freundlich and Temkin parameters obtained from the slopes and the intercepts of the plots.
Plots of the (a) Langmuir, (b) Freundlich and (c) Temkin adsorption isotherms (dye concentration = 10 ppm, adsorbent dose = 2 g L–1, contact time = 40 min, pH = 9, temperature = 37°C).
Evaluated parameters for the safranin dye adsorption isotherms (dye concentration = 10 ppm, contact time = 40 min, pH = 9).

Comparing the values of the correlation coefficients indicated an excellent fit for both the Langmuir and Freundlich isotherms, whereas the experimental data for the Temkin isotherm fitted less accurately. According to the obtained results, the data fitted the Langmuir model best.
The Langmuir isotherm model indicates that the active sites on the surface are equivalent. By contrast, the Freundlich isotherm model indicates that the difference in the nature of the surface of the materials depends on interactions between the functional groups of the absorbate and the adsorbent molecules (Irandoost et al., Reference Irandoost, Pezeshki-Modaress and Javanbakht2019).
Adsorption kinetics
The adsorption speed is the main factor impacting the adsorption process. The properties of the adsorbent and the adsorbate affect the adsorption mechanism (Irandoost et al., Reference Irandoost, Pezeshki-Modaress and Javanbakht2019; Azizpourian et al., Reference Azizpourian, Kouchakzadeh and Derikvand2023). The type of adsorption kinetics and kinetic parameters were estimated using pseudo-first-order, pseudo-second-order, Elovich and intraparticle diffusion models for the removal of safranin at various contact times by the desired adsorbents. The correlation coefficients of these kinetic models indicated that the pseudo-second-order model fits the dye adsorption results better than the pseudo-first-order model, and the q e,cal values were nearly in accordance with the q e,exp values (Table 9).
Evaluated parameters for safranin adsorption with various kinetic models (dye concentration = 10 ppm, adsorbent dose = 2 g L–1, contact time = 40 min, pH = 9, temperature = 37°C).
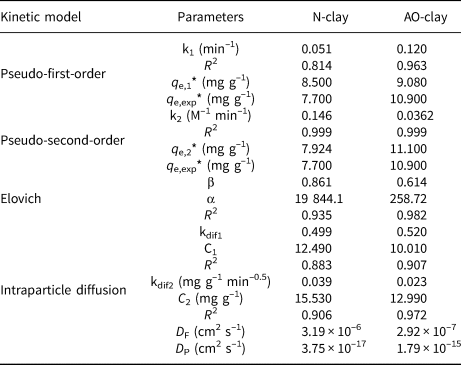
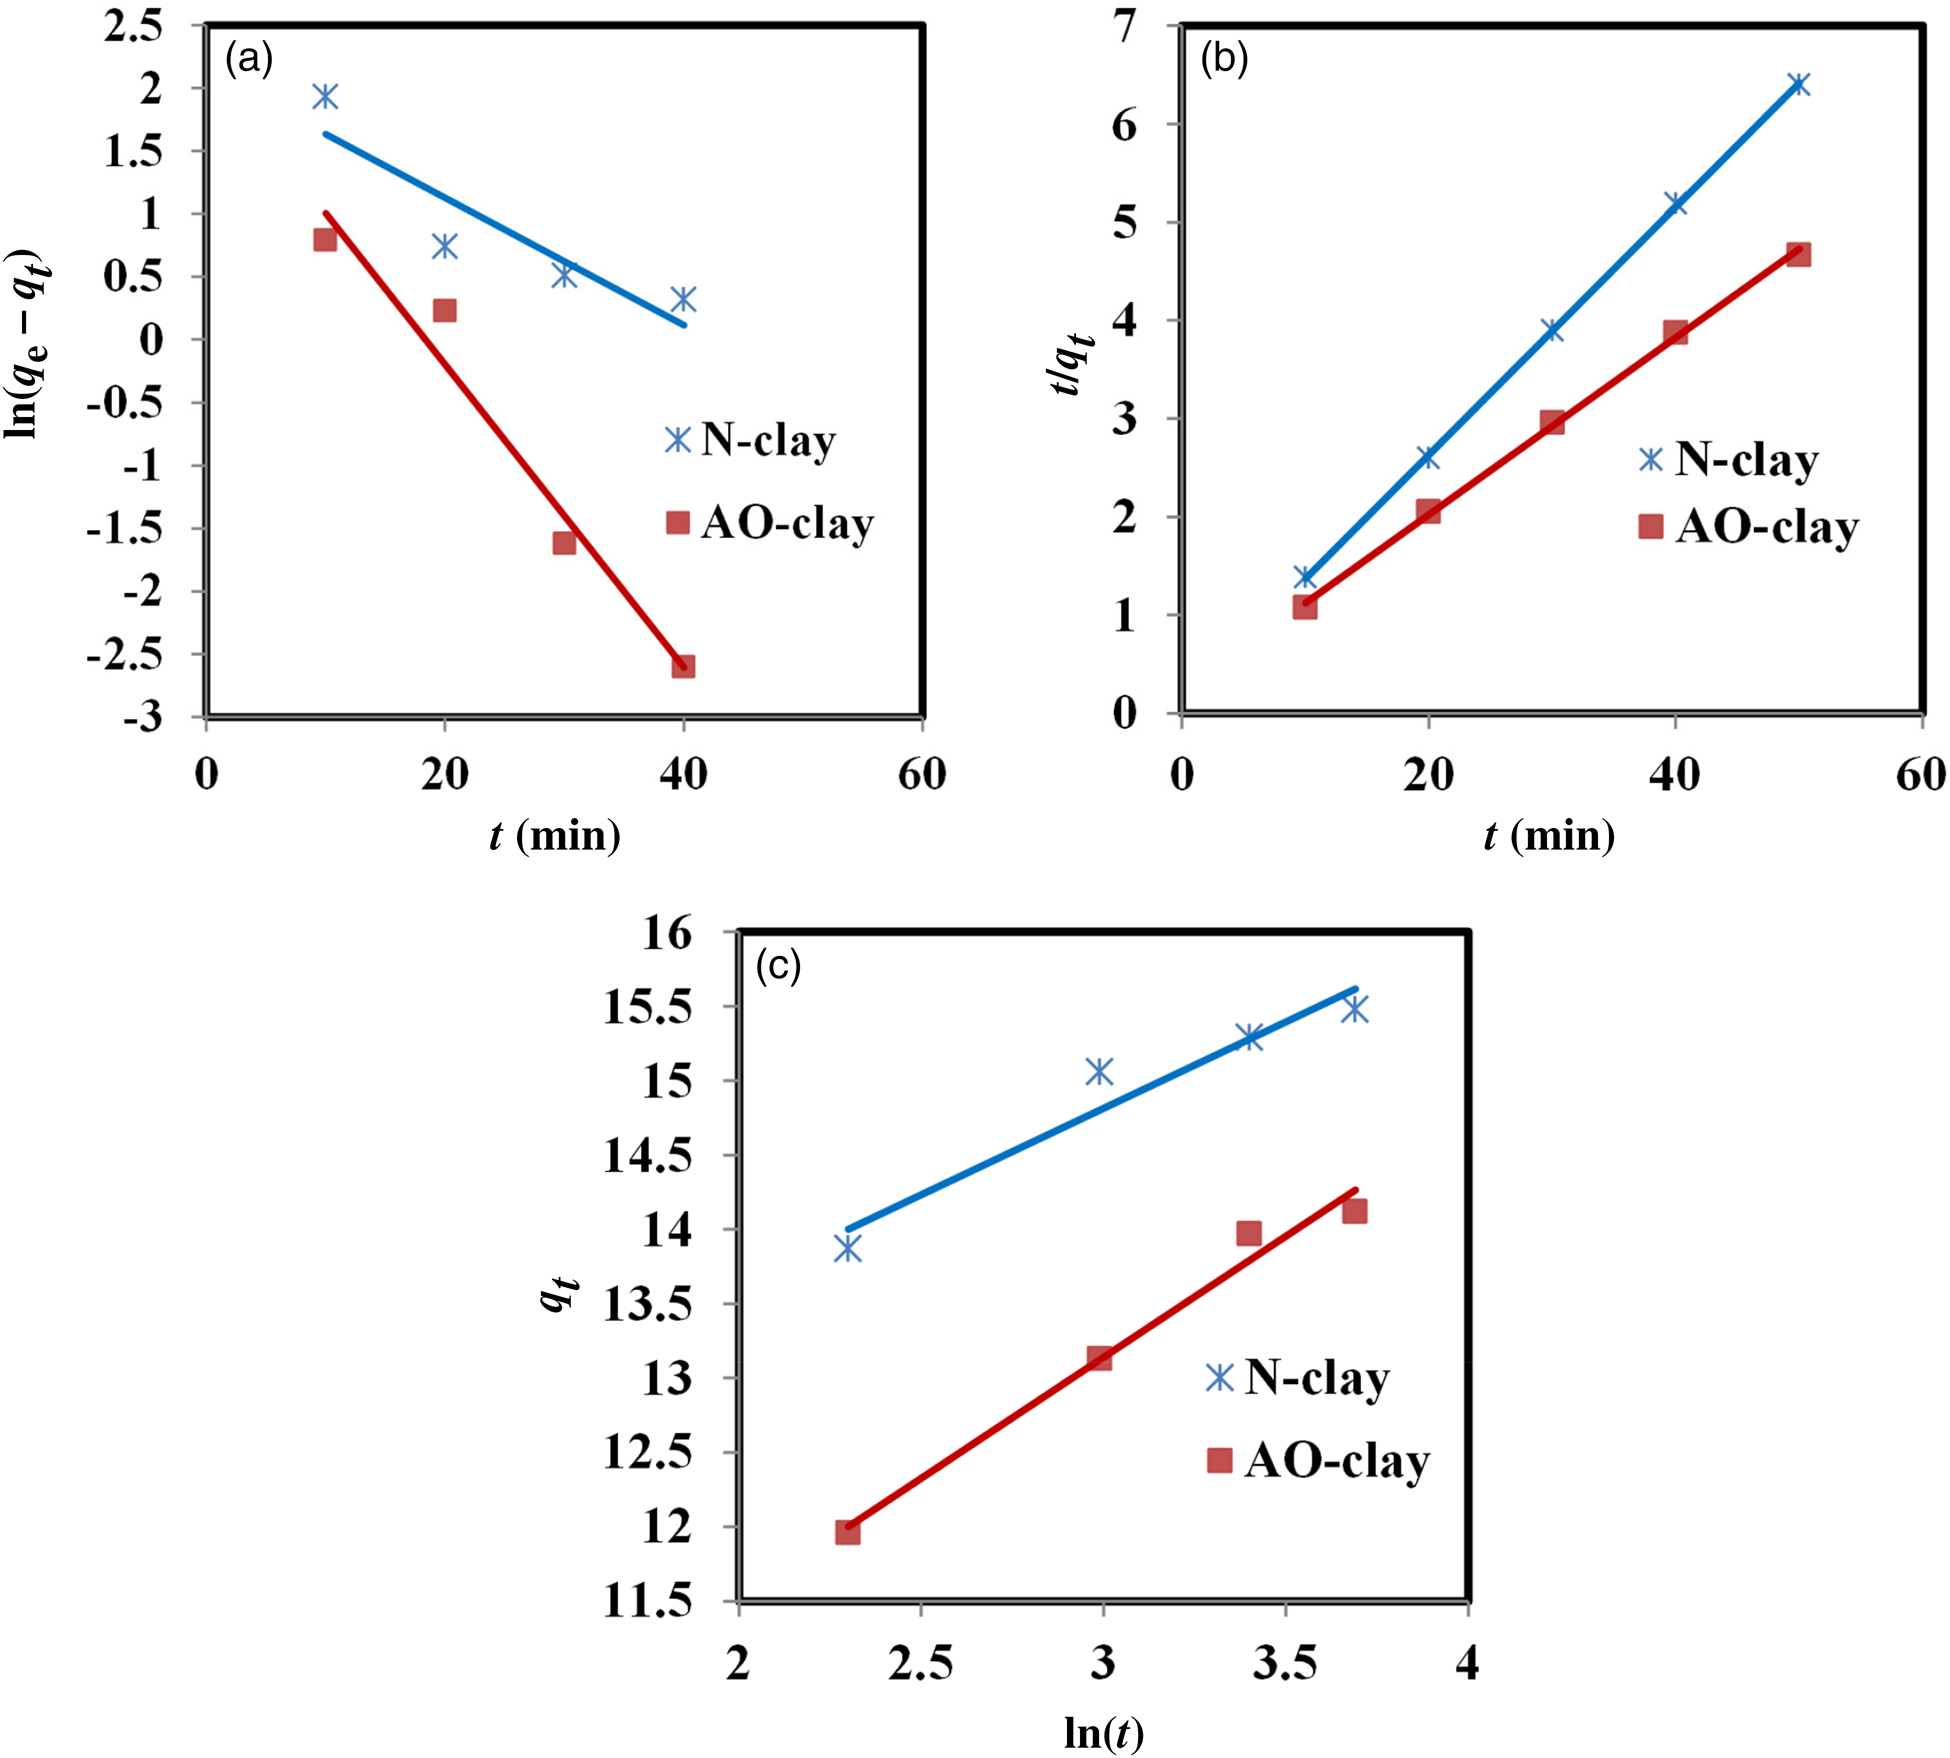
Comparing the R 2 values of the pseudo-second-order model for the desired adsorbents indicates that safranin was removed by the N-clay adsorbent better than by the AO-clay adsorbent (Table 9). Figure 11 displays the plots of these kinetic models.
Plots of the (a) pseudo-first-order, (b) pseudo-second-order and (c) Elovich kinetic models (dye concentration = 10 ppm, adsorbent dose = 2 g L–1, contact time = 40 min, pH = 9, temperature = 37°C).
The intraparticle diffusion model proposed by Weber and Morris (Kassimi et al., Reference Kassimi, Achour, Himri, Laamari and Haddad2021; Amrhar et al., Reference Amrhar, Berisha, Gana, Nassali and Elyoubi2023) was used to study the migration of the safranin solution to the adsorbent surface. The values of kdif and C were calculated from the slopes and the intercepts of the plots of qt vs t 1/2, respectively (Roosta et al., Reference Roosta, Ghaedi and Yousefi2015; Sharma et al., Reference Sharma, Mishra, Bansal, Siddiqui and Khanuja2024).
As Fig. 12 shows, these plots did not pass through the origin, so the adsorption process consists of two steps. The first one is the migration of the adsorbate solution to the adsorbent surface, and the second one is the intraparticle diffusion of the substance into the adsorbent pores (Haleta et al., Reference Haleta, Catrinescu and Macoveanu2009; Sepehr et al., Reference Sepehr, Amrane, Karimaian, Zarrabi and Ghaffari2014; Campos et al., Reference Campos, Barbosa, Rodríguez-Díaz and Duarte2018; Kuang et al., Reference Kuang, Zhang and Zhou2020).
Plot of the intraparticle diffusion model (dye concentration = 10 ppm, adsorbent dose = 2 g L–1, contact time = 40 min, pH = 9, temperature = 37°C).
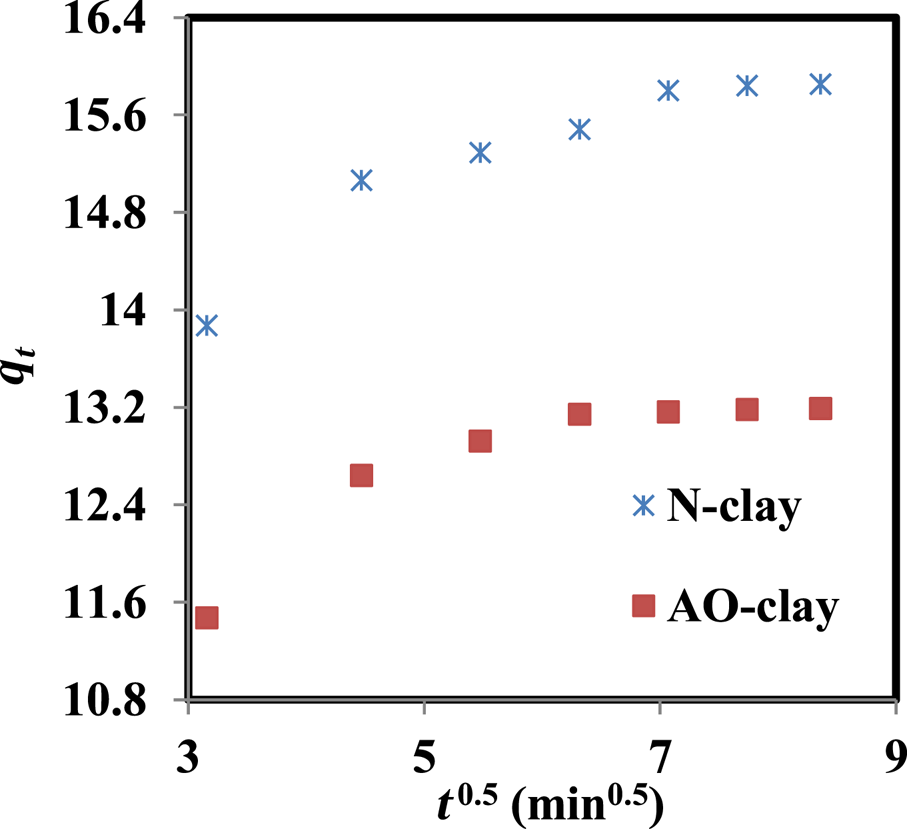
The first step has a sharp slope, and then it slows until reaching the equilibrium state (Fig. 12). It seems that dye molecules first transfer from the solution to the adsorbent surface, and the adsorption capacity increases from the initial time until 40 min.
The intercept value of C displays a lag time (Sepehr et al., Reference Sepehr, Amrane, Karimaian, Zarrabi and Ghaffari2014; Obradović, Reference Obradović2020) of t lag = 0.9 min for the mass transfer of the solution to the adsorbent surface, reflecting a delay of ~0.81 min in the adsorption process. However, the positive and high values of the intercept (C) indicate that the influence of the boundary layer is significant, and this is in agreement with the results regarding intraparticle diffusion (D P) and film diffusion (D F). The values of D P and D F were calculated as 1.79 × 10⁻¹⁵ and 2.92 × 10⁻⁷ cm2/s, respectively, for the AO-clay adsorbent and as 3.75 × 10⁻¹⁷ and 3.19 × 10⁻⁶, respectively, for the N-clay adsorbent. These results indicate that the rate-limiting step is film diffusion and that internal transmission dominates over external transmission (Karthikeyan et al., Reference Karthikeyan, Sivakumar and Sivakumar2010).
Conclusion
This research demonstrates the importance of using an inexpensive and locally obtained adsorbent to remove safranin dye from aqueous solutions. The adsorption process of the dye was carried out by fine soils called N-clay and AO-clay. The experimental results showed that the ability of N-clay to adsorb dye is slightly higher than that of AO-clay. It can be seen that when natural clays change, they do not necessarily become better adsorbents. The XRD results showed that the main difference between N-clay and AO-clay relates to the presence of calcite and gypsum. The results of the various experiments on the removal of safranin showed that optimum conditions occurred at a dye concentration of 10 ppm with pH 9, with an adsorbent dose of 2 g L–1 and at 37°C. At these optimum conditions, N-clay and AO-clay adsorbed 94.6% and 91.1% of safranin dye after 40 min, respectively. Despite the greater specific surface area of AO-clay compared to N-clay, the adsorption efficiency of N-clay was greater than that AO-clay. Safranin dye can be rapidly adsorbed on the surface of N-clay, whereas the process of adsorption can occur along the cleavages of AO-clay. This adsorption evaluation indicated that the adsorption data fit the Langmuir and Freundlich models and the kinetic data fit the pseudo-second-order model. The maximum adsorption capacities of dye removal by N-clay and AO-clay were 1250 and 625 mg g–1, respectively. Thermodynamic analysis of the dye removal demonstrated that this process is exothermic and spontaneous, with decreasing entropy. The evaluation of the intraparticle diffusion model revealed that the adsorption rate increases until ~40 min and then slowed down. According to the results of this model, the rate-limiting step was film diffusion, confirming the applicability of the pseudo-second-order model. Finally, it can be deduced that these natural materials are effective and safe adsorbents for the removal of pollutions.
Acknowledgements
The authors thank Islamic Azad University, Khorramabad Branch.
Conflicts of interest
The authors declare none.



