1. Introduction
An important and now almost indispensable rule in the conduct and description of monetary policy is the Taylor (Reference Taylor1993) type policy rule. According to this policy rule, the conduct and target of monetary policy are articulated in terms of a short-term interest rate, with no direct role for the aggregate quantity of money in the transmission of monetary effects. As such the advent of the Taylor rule era was occasioned by the relegation of the role of monetary aggregates in monetary and business cycle analysis. This conspicuous disappearance of money from workhorse macroeconomic models is believed to be due to the redundancy of money in the presence of a short-term interest rate (Leeper and Roush (Reference Leeper and Roush2003)). The then simple sum monetary aggregates appear to have lost their informative value and predictive ability for economic activities, especially in the presence of short-term interest rates like the Fed funds rate.
However, following Barnett (Reference Barnett1980) development of more theoretically consistent monetary aggregates (namely the Divisia monetary aggregates), a multitude of studies have unearthed their remarkable informational value and their strong association with overall level of economic activity. Other derivatives of Divisia provided by Barnett and Su (Reference Barnett and Su2017) and Barnett and Su (Reference Barnett and Su2020), including those incorporating credit card services and distinguishing between inside and outside money, have also been employed to demonstrate a similar association with overall economic activity. These Divisia monetary aggregates, inspired by Barnett’s work, have been consistently demonstrated to be superior to their simple sum counterparts.Footnote 1 The vast majority of previous studies have however heavily prioritized the examination of the links between Divisia monetary aggregates and overall economic activity. This raises the question of whether the high information content and predictive capabilities of Divisia monetary aggregates observed in aggregate data also apply at the sectorial level.
This paper investigates the information content and predictive ability of both narrow and broad Divisia monetary measures for sectorial economic activity. To evaluate the relative predictive capacities of the narrowest and broadest Divisia money measures, I use disaggregated sectorial data on real GDP, value added, employment, and unemployment rates across thirteen distinct sectors/industries in the United States. This analysis covers three categories of Divisia: the original Divisia, credit card-augmented Divisia, and credit card-augmented inside money Divisia, distinguishing between supply-side and demand-side Divisia, as well as between inside and outside money. Specifically, I assess the cyclical behavior and co-movement between these categories of Divisia money and the various economic activity indicators within these thirteen sectors. I rely on Hamilton (Reference Hamilton2018) regression-based filter to obtain the cyclical components of the relevant series.
Additionally, I examine the sectorial predictive abilities of the narrow and broad Divisia monetary aggregates using the Granger causality test. The test involves assessing causality from money measures to specific sectorial economic activity indicators, following a methodology akin to that employed by Bernanke and Blinder (Reference Bernanke and Blinder1992), Belongia and Ireland (Reference Belongia and Ireland2015), and Dery and Serletis (Reference Dery and Serletis2021b). Furthermore, my investigation of sectorial predictive capabilities of narrow and broad Divisia money extends to forecasting regressions analysis. In these forecasting regressions, each Divisia monetary aggregate serves as a predictor for specific sectorial economic activity indicator within each of the thirteen sectors, enabling us to examine how variations in a particular money measure can be employed to forecast changes in specific sectorial economic activity measures up to two years in advance. The approach here closely aligns with the methodologies employed by Caldara et al. (Reference Caldara, Fuentes-Albero, Gilchrist and Zakrajšek2016) and Dery and Serletis (Reference Dery and Serletis2021a). However, it’s worth noting that while Caldara et al. (Reference Caldara, Fuentes-Albero, Gilchrist and Zakrajšek2016) and Dery and Serletis (Reference Dery and Serletis2021a) utilized this approach to assess the impact of uncertainty on aggregate economic activity, my study employs the same methodology to explore the influence of changes in Divisia money growth on sector-level economic activity.
Lastly, within a 4-variable structural VAR framework, monetary policy shocks are identified to study their impact on sectorial economic activity. The identification process alternatively incorporates various narrow and broad Divisia money measures to capture their role and information content for monetary policy identification. The sectorial responses to this aggregate shock, using different monetary aggregates in the identification process, are then examined.
This study contributes to the literature on the predictive abilities and role of money in monetary policy and business cycle analysis. In the study conducted by Dery and Serletis (Reference Dery and Serletis2021b), the researchers examined the relative information content of different Divisia monetary aggregate measures. Their primary focus centered on various aggregated indicators of economic activity, encompassing total industrial production, employment, unemployment, personal income, consumption, and other broad economic variables. Dery and Serletis (Reference Dery and Serletis2021b) relied on analytical methodologies such as cyclical correlations and Granger causality to assessed the predictive abilities of Divisia money. They found broad money particularly Divisia M3 to be the most informative for aggregate economic activities. Several other studies including those by Belongia and Ireland (Reference Belongia and Ireland2014, Reference Belongia and Ireland2015, Reference Belongia and Ireland2016, Reference Belongia and Ireland2018), Barnett and Chauvet (Reference Barnett and Chauvet2011), Hendrickson (Reference Hendrickson2014), Serletis and Gogas (Reference Serletis and Gogas2014), Ellington (Reference Ellington2018), have diligently examined the predictive capabilities and desirable properties of Divisia monetary aggregates relative to simple sum money. Notably, all these studies, along with prior literature, have exclusively focused their attention on aggregated measures of economic activities.
To assess whether the high information content and predictive capabilities of Divisia monetary aggregates observed in aggregate data extend to the sectorial level, this present study assesses the relationship between Divisia monetary measures and a diverse range of sector-level economic activity indicators. Consequently, it offers a more in-depth exploration of the relevance of Divisia money in the context of business cycle analysis at a granular level, thus enhancing and expanding upon the existing body of knowledge. Investigating the information content and predictive capabilities of Divisia money at the industry or sector level is necessary to demonstrate that Divisia monetary aggregates are not only informative at the aggregate level but also connect with sector-specific activity. Sector-level data offer a more detailed and fine-grained perspective on the economy, labor market dynamics, and the intricacies of supply chains. This granularity enables a more precise understanding of the performance of different segments of the economy as well as empowering policymakers, businesses, and researchers to pinpoint specific areas of strength and vulnerability within the economy. Hence, investigating how fluctuations in Divisia money measures can enhance our understanding and prediction of sector-specific economic activity is crucial for refining economic models and informing targeted policy-making.
In terms of business cycle properties, the analysis shows that both narrow and broad Divisia money measures are more effective leading indicators of sectorial economic and labor market activities than the traditional Fed funds rate. Divisia M4 is favored in more sectors than Divisia M1, while Divisia M1A and M1AI consistently outperform their broad counterparts. Furthermore, Divisia money measures outperform the Fed funds rate in predicting sectorial real GDP, value added, employment, and unemployment rates. Specifically, the Fed funds rate has predictive information for these economic and labor market indicators in at most 6 out of 13 sectors. In contrast, narrow Divisia money (M1, M1A, and M1AI) predicts at least 10 out of 13 sectors, up to a maximum of 13. Broad Divisia measures (M4, M4A, and M4AI) predict at least 5 out of 13 sectors, up to a maximum of 12. Also, the sectorial predictive abilities of both narrow and broad money measures are neither absorbed nor diminished by the presence of a short-term interest rate like the Fed funds rate.
With regards to the forecasting regression analysis, I find that narrow Divisia money measures are more effective in predicting sectorial economic activity indicators compared to broad measures. The statistical and economic significance of the forecasted results are more pronounced and persistent as well as mostly in line with economic theory and expectations when using narrow measures. Lastly, sectors exhibit heterogeneous responses to a monetary policy shock identified with different narrow and broad Divisia measures. In the largest sector, the shock produces more pronounced and persistent effects when identified with narrow Divisia money compared to broad money. In the smallest sector, the responses are relatively similar regardless of whether narrow or broad Divisia money is used for identification.
Overall, the findings reveal that Divisia money measures are potent predictors of sectorial real GDP, value added, employment, and unemployment rates across diverse sectors. Notably, narrow and broad Divisia measures in each of the three categories considered in this study often outperform the traditional Fed funds rate in predicting sectorial economic and labor market activities. Narrow money in each category shows a slight edge over their broad counterparts. This study underscores the contemporary relevance of narrow Divisia monetary aggregates. The results further support the inclusion of Divisia monetary aggregates in monetary and business cycle analysis.
The remainder of this paper is structured as follows: Section 2 deals with the data and offers graphical representations of the differences between the narrow and broad Divisia money measures. This section also furnishes summary statistics that underscore the sectorial heterogeneity. Section 3 outlines the Kydland and Prescott (Reference Kydland and Prescott1990) methodology for cyclical correlations and the Hamilton (Reference Hamilton2018) regression-based filter for obtaining the cyclical components. Additionally, the results of the cyclical correlation analysis are presented within this section. Moving on to Section 4, I first introduce the Granger causality testing methodology employed to explore the information content of interest rates and both narrow and broad Divisia money measures. In the latter part of Section 4, my attention shifts to the forecasting regression approach, serving as an alternative method for assessing the sectorial information content of narrow and broad Divisia money. Section 5 present a structural VAR model to identify monetary policy shock and study sectorial responses to the aggregate shock. Finally, Section 6 closes the paper with a summary and concluding remarks.
2. The data
I use quarterly data from 2005Q1 to 2022Q4 to examine the cyclical behavior and predictive abilities of seven policy (predictor) variables across thirteen sectors/industries in the United States.Footnote 2 My analysis focused on their impact on sectorial economic activities, which are proxied with sectorial real Gross Domestic Product (GDP), real value added, employment, and the unemployment rate. I chose this specific sample period and data frequency to ensure a consistent datasets across all sectors, driven by data availability considerations.
I acquired monthly employment and unemployment rate data for all sectors from the Bureau of Labor Statistics (BLS). However, sectorial real GDP and value-added data, obtained from the Bureau of Economic Analysis (BEA), are reported on a quarterly basis. To align the datasets, I converted the BLS monthly employment and unemployment data into quarterly using period averages.
The Divisia money measures are from the Centre for Financial Stability (CFS). These Divisia monetary aggregates, originally constructed by Barnett (Reference Barnett1980), depart from the assumption of perfect substitutability inherent in simple sum aggregates. Instead, a weighting scheme based on monetary component user costs is used. See Barnett et al. (Reference Barnett, Liu, Mattson and Van Den Noort2013) and CFSFootnote 3 for a detailed discussion of the data and the methodology for the calculation of these monetary aggregates.
Whereas the CFS and Barnett et al. (Reference Barnett, Liu, Mattson and Van Den Noort2013) provided eight levels of Divisia monetary aggregation, my analysis of the predictive abilities of narrow and broad Divisia money measures for sectorial economic activities focuses on the predictive abilities of the narrowest and broadest Divisia money measures across three categories of Divisia monetary aggregation. Specifically, this includes an evaluation of the sectorial predictive capabilities at the original Divisia monetary aggregation level (Divisia M1 vs. M4), the credit card-augmented Divisia monetary aggregation level (Divisia M1A vs. M4A), and the credit card-augmented Divisia inside money aggregation level (Divisia M1AI vs. M4AI). In this context, a distinction is made between supply-side (Divisia M1A, M4A, M1AI, and M4AI) and demand-side (M1 and M4) measures of Divisia, as well as between inside and outside money (see Barnett and Su (Reference Barnett and Su2017) and Barnett and Su (Reference Barnett and Su2020) for details on credit card-augmented Divisia). Several studies including Barnett (Reference Barnett and Barnett2016), Keating et al. (Reference Keating, Kelly, Smith and Valcarcel2019), Jadidzadeh and Serletis (Reference Jadidzadeh and Serletis2019), Dery and Serletis (Reference Dery and Serletis2021b), and Liu et al. (Reference Liu, Dery and Serletis2020), have recommended the use of broad Divisia money for monetary and business cycle analysis. I compare the information content of the highly recommended broad Divisia money measures to narrow Divisia measures for sectorial economic activities. Additionally, since Liu et al. (Reference Liu, Dery and Serletis2020) asserts that credit card-augmented Divisia measures of money are more informative for predicting real economic activity than original Divisia monetary aggregates, particularly in the period following the 2007–2009 financial crisis, the predictive abilities of these credit card-augmented Divisia money measures are assessed at the sectorial level.
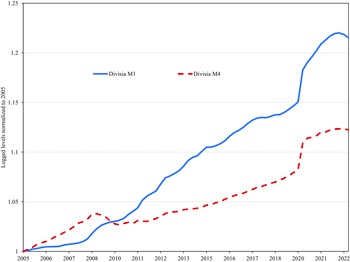
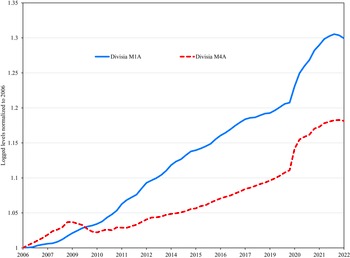
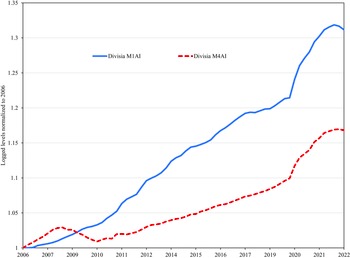
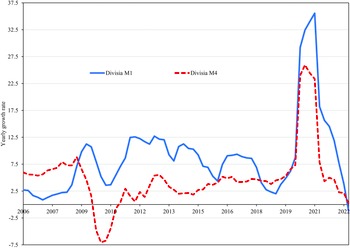
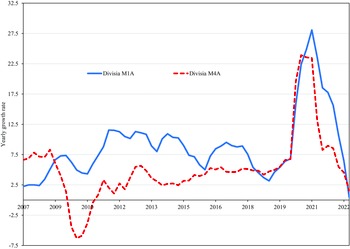
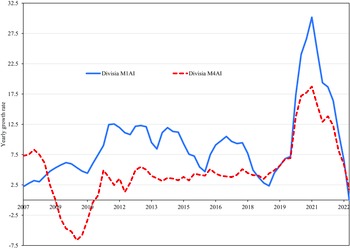
Figure 1 (original Divisia), Figure 2 (credit card-augmented Divisia), and Figure 3 (credit card-augmented inside money Divisia) display the logged levels of the narrowest and broadest Divisia monetary aggregates across these three categories. The logged values for the original Divisia (Figure 1) are normalized to 2005Q1, while the augmented Divisia values (Figures 2 and 3) are normalized to 2006Q3. These figures show distinct paths between narrow and broad money. In all cases, narrow money has increased steadily more than broad money since 2009. Figures 4 to 6 present their respective year-on-year growth rates. In summary, the aggregates are clearly distinguishable in both logged levels and growth rates.
Logged level of Divisia M1 and M4 money measures.

Logged level of Divisia M1A and M4A money measures.

Logged level of Divisia M1AI and M4AI money measures.

Growth rate of Divisia M1 and M4 money measures.

Growth rate of Divisia M1A and M4A money measures.

Growth rate of Divisia M1AI and M4AI money measures.

In an attempt to assess whether the high information content and predictive capabilities of Divisia monetary aggregates observed in aggregate data extend to the sectorial level, I examine disaggregated sectorial data across thirteen sectors with four measures of economic activities and six measures of Divisia money. Given the consensus in the literature on the superiority of Divisia money over simple sum money measures, I consider this distinction trivial and, therefore, do not assess the sector-specific information content and predictive prowess of simple sum money measures relative to Divisia money measures.Footnote 4
Throughout the analysis, I employ the Fed funds rate as a benchmark policy variable and account for the impact of price level changes by incorporating the Consumer Price Index (CPI). Since the sample period includes instances of the zero lower bound, particularly during the 2007-2009 financial crisis and the COVID-19 period, the shadow Fed funds rate from the Atlanta Fed, as measured by Wu and Xia (Reference Wu and Xia2016), is used in all cases as the effective Fed funds rate. The CPI data are sourced from FRED (Federal Reserve Economic Data). In all cases, I offer a corresponding analysis for the same sample period by utilizing aggregate economic indicators. These aggregated indicators, including real GDP, value added, employment, and unemployment data, are sourced from the BEA and FRED.
Table 1 presents the full list of the 13 sectors/industries along with a brief overview of the typical economic activities conducted within each sector. Table 2 provides a summary of the statistics for the various measures of sector-specific economic activities. For each sector, the table displays the mean values of the economic activity measures, with the corresponding standard deviations presented in parentheses. Additionally, the minimum and maximum values for each sector are enclosed in square brackets beneath their respective mean values.
As shown in Table 2, the sector with the highest real GDP is manufacturing, with average GDP of approximately $5.9 trillion. It is followed closely by the finance sector, with a GDP averaging around $5.3 trillion. In contrast, the utilities sector ranks as the smallest, with a GDP of approximately half a trillion dollars. In terms of value added, agriculture exhibits the lowest value added (approximately $173 billion). On the other hand, finance, professional and business services, manufacturing, and education emerge as the top four value adding sectors, each contributing significantly with values of $3.6 trillion, $2.2 trillion, $2.1 trillion, and $1.5 trillion, respectively.
In terms of employment, the education sector stands out as the largest employer, with an average of 21.3 million employees. It is closely followed by professional and business services, which average 19.1 million employees. Retail and hospitality sectors also rank high in employment, with mean figures of 15.2 million and 14.3 million employees, respectively. In contrast, agriculture employs the fewest individuals. Similar to other indicators of sectorial economic activity, unemployment rates within these sectors vary significantly, ranging from 2.7% in the utilities sector to 9.5% in the construction and finance sectors.
In this paper, I investigate whether the differences in levels and growth rates of the three categories of Divisia aggregates (original Divisia, credit card-augmented Divisia, and credit card-augmented inside money Divisia), as shown in Figures 1 to 6 are relevant for their predictive abilities across a range of highly distinct and heterogeneous sectors, as outlined in Table 2.
List and description of sectors

Summary statistics of sectorial indicators of economic activity

Notes: Real GDP and Value added are in Billion Dollars, Employment in thousands and unemployment in percent. Table report the mean values of the economic activity measures, with the corresponding standard deviations presented in parentheses and the minimum and maximum values for each sector are enclosed in square brackets beneath their respective mean values.
3. The cyclical behavior of money
I begin the analysis of the relationship between Divisia monetary aggregates and sectorial economic activities by first examining their respective cyclical characteristics. In this endeavor, I adopt the approach outlined by Kydland and Prescott (Reference Kydland and Prescott1990) to explore the cyclical properties of both narrow and broad Divisia monetary aggregates.
To derive the cyclical components of each sector’s economic activity metrics, as well as the Divisia monetary aggregates, I employ the novel regression filter introduced by Hamilton (Reference Hamilton2018). This filter extract the cyclical components from nonstationary time series(
 $y_{t}$
) through OLS regression. Specifically, the methodology involves performing an OLS regression of
 $y_{t}$
on four lags of itself back-shifted by 8 quarter as follows:
 \begin{equation*} y_{t}=\beta _{0}+\beta _{1}y_{t-8}+\beta _{2}y_{t-9}+\beta _{3}y_{t-10}+\beta _{4}y_{t-11}+v_{t}\text {.}\end{equation*}
Such that the regression residuals,
 $\hat{v}_{t}$
,
 \begin{equation*} \hat {v}_{t}=y_{t}-\hat {\beta }_{0}-\hat {\beta }_{1}y_{t-8}-\hat {\beta }_{2}y_{t-9}-\hat {\beta }_{3}y_{t-10}-\hat {\beta }_{4}y_{t-11}\end{equation*}
is the desired cyclical component of the series.
After obtaining the cyclical components of the chosen narrow and broad Divisia monetary aggregates, as well as the cyclical components of various economic activity indicators across the 13 sectors of the US economy, the next step involves evaluating the extent of cyclical correlation between a particular measure of money and the relevant indicator of sectorial economic activity. As noted in the data section, the narrowest and broadest Divisia measures from each of the three categories are utilized. For each sector, I gauge the level of cyclical co-movement between these money measures and sectorial real GDP, value added, employment, and the unemployment rate. The magnitude of the correlation coefficient serves as a measure of the degree of this cyclical co-movement, allowing us to assess the cyclical properties with the following:
 \begin{equation*} \rho (M_{t},Y_{t+j})\quad \text {, for }j=-8,-4,0,4,8 \end{equation*}
In the context of this analysis, the correlation coefficient
 $\rho (M_{t}, Y_{t})$
provides insights into the degree of contemporaneous co-movement between the monetary measure (
 $M_{t}$
) and the economic activity indicator (
 $Y_{t}$
). Specifically:
-
• If
 $\rho (M_{t}, Y_{t}) \gt 0$
, it suggests that
$M_{t}$
is procyclical, indicating that it tends to move in the same direction as economic activity.
-
• If
$\rho (M_{t}, Y_{t}) \lt 0$
, it implies that
$M_{t}$
is countercyclical, indicating an inverse relationship with economic activity. -
• If
$\rho (M_{t}, Y_{t}) = 0$
, it suggests that
$M_{t}$
is acyclical, meaning there is no significant contemporaneous co-movement with economic activity.


Furthermore, to assess the sectorial phase shift of
 $M_{t}$
, I examine the cross-correlation coefficient
 $\rho (M_{t}, Y_{t+j})$
for
 $j \neq 0$
. The absolute value of
 $\rho (M_{t}, Y_{t+j})$
is used to determine the leading, synchronous, or lagging behavior of
 $M_{t}$
with respect to the economic cycle:
-
• If the absolute value of
$\rho (M_{t}, Y_{t+j})$
is maximum for a positive
$j$
, it indicates that
$M_{t}$
is leading the economic cycle by
$j$
periods. -
• If the absolute value of
$\rho (M_{t}, Y_{t+j})$
is maximum for
$j = 0$
, it suggests that
$M_{t}$
is synchronous with the economic cycle. -
• If the absolute value of
$\rho (M_{t}, Y_{t+j})$
is maximum for a negative
$j$
, it implies that
$M_{t}$
is lagging the economic cycle by
$j$
periods.


These assessments help us understand the timing and direction of the relationship between the monetary measures and sectorial economic activity across different sectors.
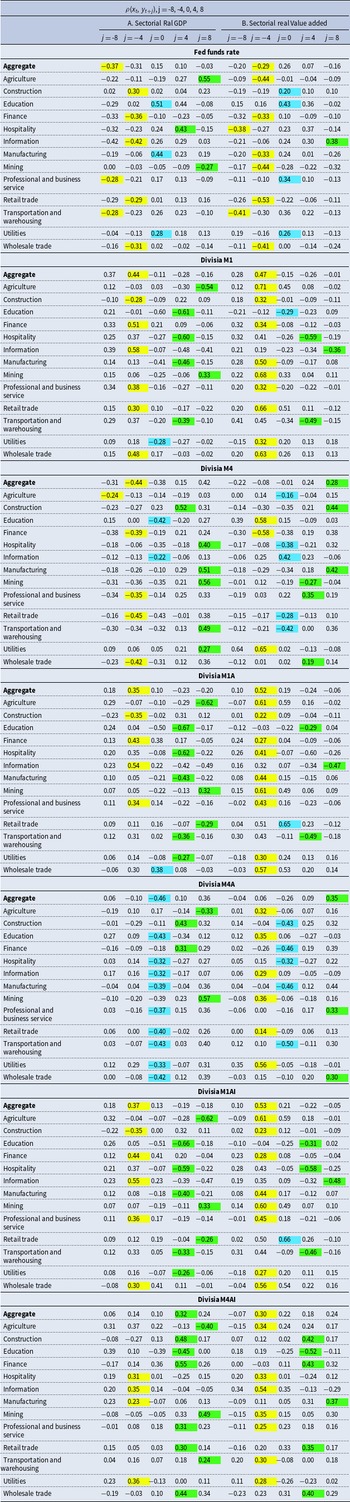
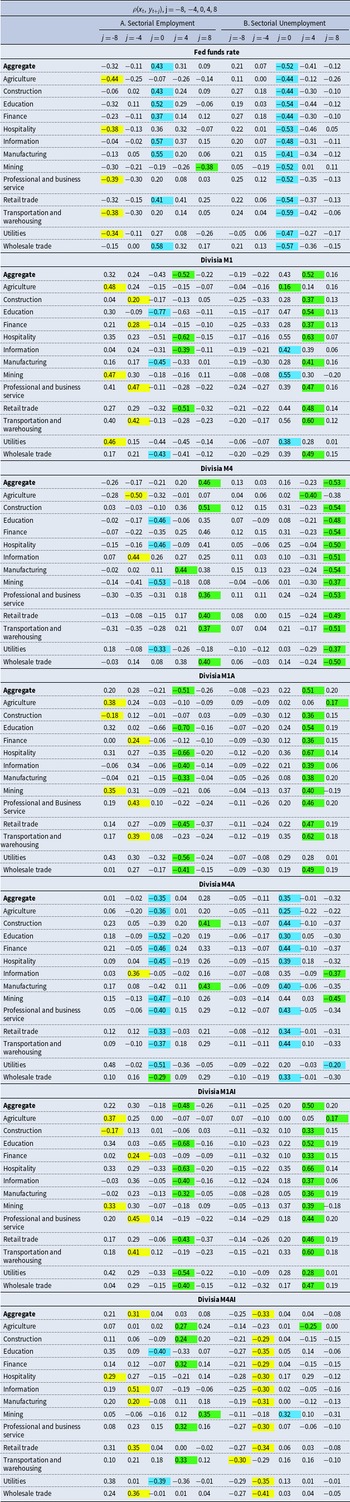
Tables 3 to 6 provide an overview of the cyclical correlations between sectorial real GDP (Table 3), value added (Table 4), unemployment (Table 5), and employment (Table 6) with both narrow and broad Divisia money measures, as well as with the Fed funds rate. For brevity, only the contemporaneous correlations (
 $j=0$
) and the phase shift information are reported in panels A and B, respectively. Detailed correlations are presented in Appendix Table A1 (sectorial economic activities) and Table 2 (sectorial labor market activities).
Aggregate and sectorial real GDP contemporaneous correlation and phase shift
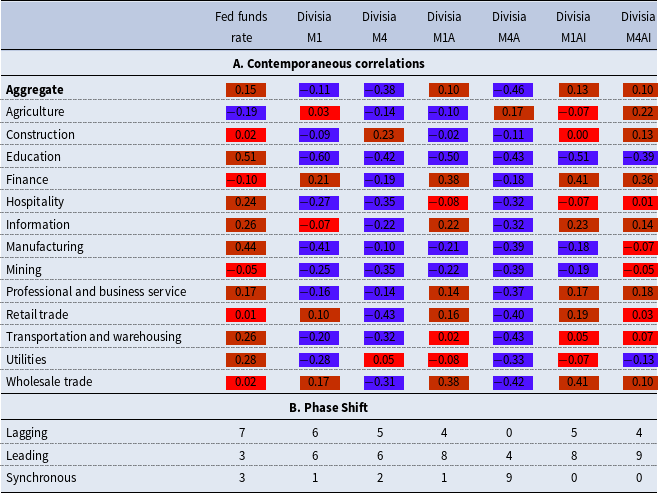
Notes: In panel A: Red = acyclical, purple = countercyclical, and orange = procyclical. Numbers in panel B indicate the number of sectors for which each policy variable was lagging, leading, or synchronous with the sectorial real GDP cycle.
As shown in Panel A of Table 3, at the aggregate level, the Fed funds rate is weakly procyclical with real GDP, with a contemporaneous correlation of 0.15. At the sectorial level, it is procyclical in 8 sectors, with the strongest correlation in the education sector at 0.51. The positive correlations between sectorial GDP and the Fed funds rate are generally larger than the correlation between aggregate GDP and the Fed funds rate. Construction, Mining, Retail trade, and Wholesale trade are generally acyclical with the Fed funds rate, while Agriculture and Finance are weakly countercyclical with the Fed funds rate.
The remaining part of Panel A of Table 3 shows the contemporaneous correlations of various Divisia monetary aggregates with aggregate and sectorial real GDP. The correlations largely depict countercyclical patterns of both narrow and broad Divisia measures with both aggregate and sectorial real GDP. The largest negative correlation is between Divisia M1 and the education sector’s real GDP (−0.60). Generally, the education sector has the highest absolute correlations for any Divisia money measure relative to all other sectors, which is also the case with the Fed funds rate. Notably, all the narrow Divisia money measures exhibit weakly procyclical relationships with Finance, Retail trade, and Wholesale trade, while being acyclical with Construction real GDP.
Aggregate and sectorial real value added contemporaneous correlation and phase shift
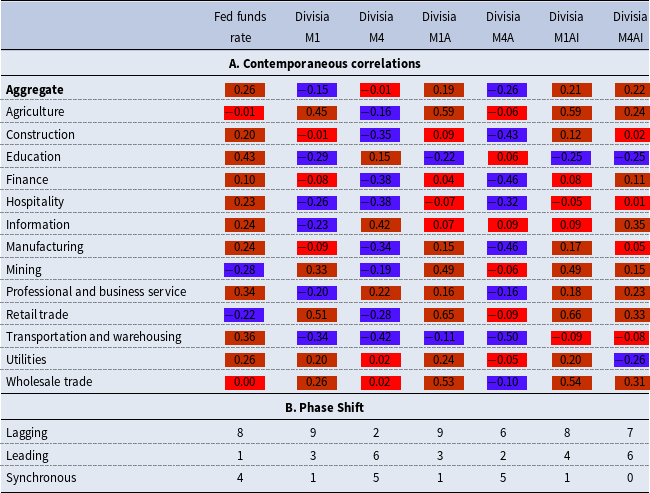
Notes: In panel A: Red = acyclical, purple = countercyclical, and orange = procyclical. Numbers in panel B indicate the number of sectors for which each policy variable was lagging, leading, or synchronous with the sectorial real value-added cycle.
Panel B of Table 3 presents the phase shift information, showing the number of sectors for which each policy variable was lagging, leading, or synchronous with the sectorial economic cycle. Details of the specific sectors where each policy variable is a lagging, leading, or synchronous indicator are shown in Appendix Table A1. The Fed funds rate is generally a lagging indicator of sectorial real GDP (7 out of 13 sectors) and only a leading indicator in 3 out of 13 sectors. In contrast, both narrow and broad Divisia measures are generally leading indicators of sectorial real GDP more frequently than the Fed funds rate.
Aggregate and sectorial unemployment contemporaneous correlation and phase shift

Notes: In panel A: Red = acyclical, purple = countercyclical, and orange = procyclical. Numbers in panel B indicate the number of sectors for which each policy variable was lagging, leading, or synchronous with the sectorial unemployment cycle.
Additionally, the Fed funds rate demonstrates procyclical tendencies when using an alternative measure of economic activity (sectorial value added in Table 4) across most sectors, except for mining and retail trade. The correlation between the policy rate and value added in the agricultural sector is −0.01, indicating an acyclical relationship. With this alternative measure of economic activity, the Divisia money measures are generally countercyclical, particularly with Divisia M1, M4, and M4A, at both the sectorial and aggregate levels, albeit with notable exceptions. Divisia M4AI is procyclical with sectorial value added except in education and utilities. In 6 out of 13 sectors, Divisia M4A is effectively acyclical. All the narrow measures also have positive contemporaneous correlations with sectorial value added in agriculture, mining, retail trade, utilities, and wholesale trade. Phase shift information indicates most policy variables are lagging indicators for value added. However, monetary measures are still more frequently leading indicators than the Fed funds rate.
Aggregate and sectorial employment contemporaneous correlation and phase shift

Notes: In panel A: Red = acyclical, purple = countercyclical, and orange = procyclical. Numbers in panel B indicate the number of sectors for which each policy variable was lagging, leading, or synchronous with the sectorial employment cycle.
Table 5, Panel A shows that both aggregate and sectorial unemployment rates are significantly negatively related to the Fed funds rate, with correlations ranging from −0.41 to −0.59. Additionally, Divisia monetary aggregates are contemporaneously positively related to both aggregate and sectorial unemployment rates, indicating that with tight labor markets (decreasing unemployment rates), policymakers decrease the money supply. The positive correlations are higher for both aggregate and every sector with Divisia M1 and M4A, while Divisia M4AI is basically acyclical with all sectors except Hospitality, Mining, Transportation and Warehousing, and Utilities.
In Panel B, we observe the Fed funds rate to be synchronous with sectorial unemployment rates in all 13 sectors, while the Divisia aggregates are leading indicators of sectorial unemployment rates in almost all industries except for Divisia M4A and M4AI. While Divisia M4 outperforms M1 as a leading indicator of sectorial unemployment rates (13 vs. 10 sectors), Divisia M1A and M1AI also lead their broad counterparts in this regard.
Table 6 displays the cyclical correlations between employment, Divisia money, and the Fed funds rate. The table reveals that the different monetary measures largely exhibit negative relationships with the level of economic activity, as measured by sectorial employment levels. This indicates that a sectorial employment boom is accompanied by a reduction in money supply. The table also shows a similar pattern of phase shifts, where Divisia monetary measures are more often leading indicators of sectorial economic and labor market activities than the Fed funds rate. Additionally, Divisia M4 outperforms M1 as a leading indicator, but the narrow measures Divisia M1A and M1AI tend to be more effective leading indicators than M4A and M4AI, respectively.
In summary, both narrow and broad Divisia money measures are generally more effective leading indicators of sectorial economic and labor market activities than the traditional Fed funds rate. In this regard, both narrow and broad money measures exhibit advantageous and desirable cyclical properties in relation to sectorial economic activities. Divisia M4 is generally favored as a leading indicator in more sectors than Divisia M1, while Divisia M1A and M1AI consistently outperform their broad counterparts in this regard.
4. The information content of money
After noting some desirable cyclical properties of both narrow and broad Divisia monetary aggregates, this section is dedicated to examining the predictive value of each monetary aggregate concerning sectorial economic indicators. I approach this assessment in two distinct ways: first, I employ Granger causality tests to gauge the ability of each aggregate to predict real economic activities in a Granger causal sense (Granger (Reference Granger1969)). Secondly, I employ forecasting regressions to evaluate how effectively the various monetary aggregates predict future sectorial economic activities. While the primary focus revolves around the information content of narrow and broad Divisia money measures for sector-level economic activity, I also assess the predictive capacity of the federal funds rate and, in all cases, present the information content of these predictors for aggregate economic activity indicators as benchmark.
4.1. Granger Causality Analysis
In this subsection, I adopt a modified version of Granger (Reference Granger1969)’s methodology. This modified version of the methodology inspired by Bernanke and Blinder (Reference Bernanke and Blinder1992), Belongia and Ireland (Reference Belongia and Ireland2015), and Dery and Serletis (Reference Dery and Serletis2021b), utilize the following regression equation:
 \begin{equation} Y_{t}=\alpha +\sum _{i=1}^{p}\beta _{i}Y_{t-i}+\sum _{j=1}^{q}\theta _{j}X_{t-j}+\sum _{k=1}^{r}\lambda _{k}P_{t-k}+e_{t} \end{equation}
where
 $Y_{t}$
is a measure of sectorial economic activity (Real GDP, Value added, employment, or unemployment),
 $X_{t}$
is a predictor variable (either the Fed funds rate or a monetary aggregate), and
 $P_{t}$
is the consumer price index which acts as an adjustment variable to remove the effects of general prices from the estimates. The optimal lag length for
 $p$
,
 $q$
, and
 $r$
are flexibly determined based on the Akaike information criterion after letting each of
 $p$
,
 $q$
, and
 $r$
take values from 1 to 12. Equation 1 is estimated separately for each predictor variable and for each measure of sectorial economic activity and then test for causality running from the predictor to the particular sectorial measure of economic activity. That is
 $\theta _{j}=0$
,
 $\ \forall \ j$
. Intuitively, I am testing the null hypothesis that all lags of the predictor variable (the
 $X$
variable in equation 1 ) can be excluded from the regression. In presenting the results, I report the marginal significance level. Therefore, smaller
 $p$
-values indicate a stronger role for that predictor variable.
Table 7 presents the Granger causality test results for aggregate and sectorial real GDP for the Fed funds rate and the narrow and broad Divisia measures. Bold numbers indicate that the null hypothesis of no causality from the policy variable to sectorial real GDP is rejected at the 10% significance level. The table shows that at the aggregate level, there is no causality from the Fed funds rate to real GDP, as there is insufficient evidence to reject the null hypothesis at the 10% significance level. Generally, causality from the Fed funds rate to sectorial real GDP exists in only 6 out of the 13 sectors: Agriculture, Construction, Information, Manufacturing, Retail trade, and Utilities.
Causality from policy variables to aggregate and sectorial real GDP

Notes: Numbers are marginal significance levels. Bold numbers indicate significance at 10%. Null hypothesis is no causality from policy variable to real GDP. Data is in logged levels.
Conversely, the various narrow and broad Divisia money measures provide significant information content for predicting both aggregate and sectorial real GDP. Specifically, in a Granger sense, there is causality from each narrow and broad Divisia money measure to aggregate real GDP. At the sectorial level, these Divisia indices are highly informative for predicting sectorial real GDP, as indicated by the near-total rejection of the null hypothesis of no causality in almost all sectors. Notably, there is information content for predicting 12, 13, and 12 out of the 13 sectors for Divisia M1, M1A, and M1AI, respectively. The corresponding numbers for M4, M4A, and M4AI are 11, 10, and 9, respectively.
Virtually every Divisia money measure has more predictive capability in a Granger sense than the traditional Fed funds rate within this recent sample period. In other words, money measures appear to connect better with sectorial real GDP than interest rate measures in this contemporary period. Additionally, narrow money outperforms their broad counterparts within their respective categories: M1 vs. M4 (12 vs. 11), M1A vs. M4A (13 vs. 10), and M1AI vs. M4AI (12 vs. 9).
Table 8 summarizes, for each sectorial economic activity measure (GDP, value added, employment, and unemployment) and for each predictor (Fed funds rate, Divisia M1, M4, M1A, M4A, M1AI, and M4AI), the count of the number of sectors in which the null hypothesis of no causality was rejected at the 10% significance level. The higher the number, the more informative the policy variable. The total possible count is 13. Appendix Table A3 contains the detailed causality results for Table 8.
Count of number of sector in which policy variable is informative

Notes: The numbers in this table represent the count of sectors where the null hypothesis of no causality from the policy variable to the specific economic activity measure is rejected at the 10% significance level. Data is in logged levels.
At the aggregate level, out of the 4 economic activity measures, the Fed funds rate only provides information content for predicting one measure. In contrast, for the various Divisia measures, the null hypothesis of no causality is rejected in all 4 cases with narrow measures and in 3 out of 4 cases with broad measures. Table 8 also reveals that across all 4 sectorial activity measures, narrow money measures are more informative than broad measures. For example, with Divisia M1, M1A, and M1AI and sectorial unemployment, the count is 12 out of 13 for each of them, while the corresponding numbers for Divisia M4, M4A, and M4AI are 7, 5, and 5 respectively.Footnote 5
Although the Divisia measures prove valuable in forecasting a range of sectorial economic indicators, it’s worth considering the possibility that their predictive power might be entirely absorbed by the presence of short-term interest rates, such as the Fed funds rate. This scenario echoes arguments made regarding the redundancy of simple sum monetary aggregates in the 1980s by Sims (Reference Sims1980) and Litterman and Weiss (Reference Litterman and Weiss1985). Therefore, I proceed to reestimate a modified version of Equation 1, explicitly accounting for the influence of the Fed funds rate as follows:
 \begin{equation} Y_{t}=\alpha +\sum _{i=1}^{p}\beta _{i}Y_{t-i}+\sum _{j=1}^{q}\theta _{j}M_{t-j}+\sum _{k=1}^{r}\lambda _{k}P_{t-k}+\sum _{\ell =1}^{s}\phi _{\ell }R_{t-\ell }+e_{t}\text{.} \end{equation}
Where
 $R_{t}$
is the Fed funds rate and
 $M_{t}$
represent a monetary aggregate, all other variables are as previously denoted in equation 1. This modified causality test evaluates whether the predictive abilities of Divisia money measures for sectorial economic activities are significantly impacted or diminished by the presence of a short-term interest rate.
In similar manner to Table 8, panel A of Table 9 present the sectorial predictive ability of narrow and broad Divisia accounting for the effect of the Fed funds rate.Footnote 6 In general, I find that the predictive capabilities of Divisia money measures for sectorial economic activity are not eroded in the presence of a short-term interest rate. The results also largely depict the informativeness of narrow over broad Divisia measures, except in the case of sectorial real GDP and value added, where Divisia M4 is more informative than Divisia M1.
Count of number of sector in which policy variable is informative while controlling for fed funds rate

Notes: The numbers in this table represent the count of sectors where the null hypothesis of no causality from the policy variable to the specific economic activity measure is rejected at the 10% significance level. The regressions control for the Fed funds rate, with data presented in logged levels and quarterly growth rates.
I conducted an analysis to assess the predictive power of selected narrow and broad Divisia money measures for sector-specific economic and labor market activity indicators. Up to this point, the causality analysis has been based on data presented in logged levels. In Table 9 panel B, I address the sensitivity of the findings to alternative data transformations by examining causality using the quarterly growth rates of the relevant economic activity measures. This approach aligns with the suggestion made by Christiano and Ljungqvist (Reference Christiano and Ljungqvist1988) that causality test results may vary depending on various data transformations. In this regard, I control variables for both short-term interest rate and the price level and present the results in Table 9 panel B directly comparable to panel A of the same table.Footnote 7
The information content of the various Divisia measures for predicting sectorial economic and labor market activities remains largely consistent with the results presented in Table 9, Panel A. Narrow Divisia money measures continue to exhibit slightly greater information content for predicting sectorial economic activity. The only exception is the result for sectorial value added, where Divisia M4AI is more informative than Divisia M1AI. In general, the informativeness of the various Divisia money measures for predicting sectorial economic activities, as assessed through Granger causality tests, appears to be unaffected by this alternative data transformation.
Delving beyond aggregate data and into sector-specific information is inherently enlightening, as it unveils the heterogeneity in the ability of these monetary measures to predict sectorial economic activities. For instance, when focusing on aggregate real GDP (Panel B of Table 9), both Divisia M1 and M4 are informative. However, these indices are not informative for predicting real GDP in every sector. In particular, Divisia M1 does not have information content for predicting construction, mining, and utilities real GDP. Similarly, Divisia M4 is uninformative for predicting agriculture, construction, mining, and utilities real GDP.
It is worth highlighting the significance of the findings, given that my sample period, spanning from 2005Q1 to 2022Q4, falls within the post-1980 era—a period during which Friedman and Kuttner (Reference Friedman and Kuttner1992) raised doubts about the predictive power of money. The fact that I observe significant predictive and information content in Divisia money at such a disaggregate sectorial level is indeed noteworthy
The conclusion that narrow Divisia money exhibits greater information content for predicting sectorial economic activities during the period from 2005Q1 to 2022Q4 is consistent with the findings of Belongia and Ireland (Reference Belongia and Ireland2015) and Dery and Serletis (Reference Dery and Serletis2021b), who established that narrow Divisia money at the aggregate level outperforms the Fed funds rate in terms of informativeness for the sample period from 2000 to 2018. This consistency underscores the robustness and contemporary relevance of this current research findings.
4.2. Forecasting regression analysis
To assess the connection between the various predictors and future levels of sectorial economic activities, I run a forecasting regression similar to the specification used in Caldara et al. (Reference Caldara, Fuentes-Albero, Gilchrist and Zakrajšek2016) and Dery and Serletis (Reference Dery and Serletis2021a) as follows:
 \begin{equation} y_{t+h}^s=\alpha ^s +\theta ^s x_{t}+\sum _{i=1}^{h+1}\beta _{i}^s y_{t-i}^s+e_{t+h}^s \end{equation}
The variable
 $y_{t+h}^s$
represents the forward difference in the growth rate of the relevant sectorial economic activity measure at a horizon of
 $h\geq 0$
quarters for sector
 $s$
. In Equation (3),
 $x_{t}$
is one of the predictor variables (Fed funds rate, Divisia M1, Divisia M4, Divisia M1A, Divisia M4A, Divisia M1AI, or Divisia M4AI). I run this regression separately for each sectorial economic activity measure and for each of the predictor variables at horizons within two years.
Table 10 presents the one-year-ahead (
 $h=4$
) forecasting regression results for real GDP (Panel A) and value added (Panel B). An increase in the Fed funds rate predicts an economically and statistically significant reduction in future real GDP and value added at both the aggregate and sectorial levels, except for mining and utilities real GDP, as well as education, mining, and utilities value added. A 1 percentage point increase in the Fed funds rate predicts the most significant decline in hospitality real GDP and value added, exceeding 2 percentage points.
One-year-ahead forecasting regression results for real GDP and value added

*p < 0.1, **p < 0.05, ***p < 0.01
Regarding the ability of narrow and broad Divisia money measures to predict future aggregate and sectorial real GDP, at the aggregate level, an increase in narrow money measures predicts a significant increase in real GDP, while broad money measures do not show an economically or statistically significant predictive relationship. At the sectorial level, changes in narrow money measures (M1, M1A, and M1AI) are clearly more effective in predicting future changes in sectorial real GDP than changes in their broad money counterparts (M4, M4A, and M4AI). For instance, an increase in M1 predicts a statistically significant increase in real GDP for education, finance, manufacturing, retail trade, transportation and warehousing, and wholesale trade, while a similar increase in M4 does not produce any statistically significant predictions for these industries. In general, the parameter estimates are larger for narrow money measures than for broad money measures in their respective categories.
While both narrow and broad money measures generally have a significant predictive relationship with aggregate and sectorial value added, the pattern of narrow money being economically and statistically more attuned to aggregate and sectorial economic activities is maintained. For example, except for education, information, and utilities, the parameter estimates for all other sectors are larger for narrow money than their respective broad counterparts, and in some cases more than double, as seen in hospitality and transportation and warehousing.
Although the absolute value of the parameter estimate of changes in the Fed funds rate on economic activities is generally larger than for monetary measures, the number of sectors with statistically significant relationships favors narrow money measures, particularly when considering sectorial value added.
Table 11 presents the one-year-ahead forecasting regression results for aggregate and sectorial labor market activities. As expected, an increase in the Fed funds rate predicts a decline in employment at both the aggregate and sectorial levels. This reduction in employment is predicted to occur in almost all sectors, except for mining and education, where the results are not statistically significant. An increase in narrow money also predicts an increase in employment across all sectors (except mining) and at the aggregate level. Besides having statistically significant relationships, the parameter estimates for changes in narrow money forecasting changes in sectorial employment are larger compared to broad money for every sector except mining and agriculture (for M4 and M4A).
One-year-ahead forecasting regression results for employment and unemployment rate

*p < 0.1, **p < 0.05, ***p < 0.01
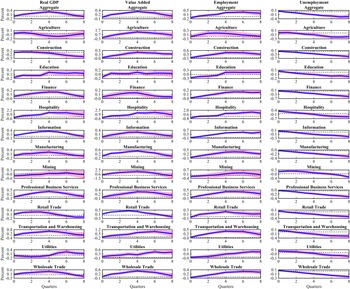
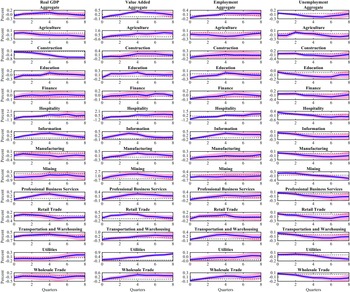
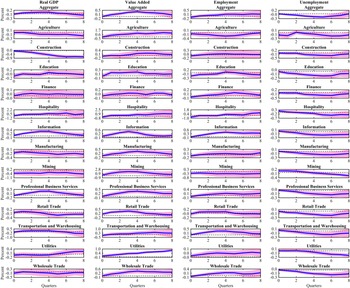
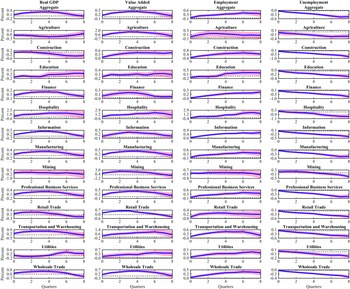
Both narrow and broad money measures are significant predictors of future changes in aggregate and sectorial unemployment, with narrow money within each category being more statistically related to sectorial unemployment. Additionally, both narrow and broad money measures outperform the Fed funds rate in predicting future changes in sectorial unemployment across a wide range of sectors. Appendix Table A7 (GDP and Value Added) and Table 8 (Employment and Unemployment) show the results of both the one- and two-year-ahead forecasts. These supplementary results of the two-year-ahead forecast largely align with the conclusion that narrow money has a significant future predictive ability over broad money. The two-year forecast results particularly show a stronger predictive ability of narrow over broad money for sectorial unemployment rates. Appendix Figures A1 to A7 trace out the parameter estimates for each forecast horizon from
 $h=0, 1, 2, \dots 8$
with their respective 90% confidence intervals for each predictor variable for the aggregate and sectorial economic activity measures. These results affirms the conclusions drawn based on the one-year-ahead results.
Considering the contemporary sample period spanning from 2005 to 2022, both the Granger causality analysis and the forecasting regression results consistently favor narrow Divisia monetary aggregates as having relatively more information content for predicting aggregate and sectorial economic and labor market activities. Narrow money, in particular, appears to have more predictive power than the traditional Fed funds rate within this recent sample period. This finding is consistent with those of Belongia and Ireland (Reference Belongia and Ireland2015) and Dery and Serletis (Reference Dery and Serletis2021b), who established that narrow Divisia money at the aggregate level outperforms the Fed funds rate in terms of informativeness for the sample period from 2000 to 2018.
5. Structural VAR analysis
In this section, I introduce a 4-variable VAR model to identify an aggregate monetary policy shock and analyze its impact on sectorial real GDP. The identification process sequentially incorporates each category of narrow and broad Divisia money measures to capture their role and importance in monetary policy identification and to assess the diverse sectorial responses to this aggregate shock.
Consider a standard structural VAR model of the form
 \begin{equation} {\boldsymbol{A}}{\boldsymbol{Z}}_{t}^{^{\prime }}=\boldsymbol{\Gamma }_{0}+\sum _{k=1}^{p} {\boldsymbol{Z}}_{t-k}^{\prime }\boldsymbol{\Gamma }_{k}+\boldsymbol{\varepsilon }_{t}^{\prime } \end{equation}
where
 ${\boldsymbol{Z}}_{t}^{\prime }$
is a
 $n\times 1$
vector of the relevant variables,
 ${\boldsymbol{A}}$
is a
 $n\times n$
matrix of contemporaneous coefficients,
 $\boldsymbol{\Gamma }_{0}$
is a
 $n\times 1$
vector of constants,
 $\boldsymbol{\Gamma }_{k}$
,
 $k=1,\dots, p$
, are
 $n\times n$
matrices of slope coefficients, and
 $\boldsymbol{\varepsilon }_{t}^{\prime }$
is a
 $n\times 1$
vector of structural disturbances with variance-covariance matrix
 ${\boldsymbol{D}}$
. Express equation (4) compactly as
 \begin{equation}{\boldsymbol{A}}{\boldsymbol{Z}}_{t}^{\prime } = {\boldsymbol{X}}_{t}^{\prime } {\boldsymbol{B}}+\boldsymbol{\varepsilon }_{t}^{\prime } \end{equation}
with
 ${\boldsymbol{B}}\, =\left [{\boldsymbol{B}}_{1}^{\prime },\ldots, {\boldsymbol{B}}_{p}^{^{\prime }},\boldsymbol{\Gamma }_{0}^{\prime }\right ]$
and
 ${\boldsymbol{X}}_{t}^{\prime } =\left [{\boldsymbol{Z}}_{t-1}^{^{\prime }},\ldots, {\boldsymbol{Z}}_{t-p}^{\prime },\mathbf{1}\right ]$
, such that the reduced-form VAR is
 \begin{equation} {\boldsymbol{Z}}_{t}^{\prime }= {\boldsymbol{X}}_{t}^{\prime }\boldsymbol{\Phi }+ {\boldsymbol{u}}_{t}^{\prime } \end{equation}
where
 $\boldsymbol{\Phi } = {\boldsymbol{BA}}^{-1}, {\boldsymbol{u}}_{t}^{\prime }= \boldsymbol{\varepsilon }_{t}^{\prime }{\boldsymbol{A}}^{-1}$
, and
 $E\left [{\boldsymbol{u}}_{t}{\boldsymbol{u}}_{t}^{\prime }\right ] =\boldsymbol{\Omega }$
.
The model as succinctly presented in equation 4 to 6 is identified using a penalty function approach similar to Caldara et al. (Reference Caldara, Fuentes-Albero, Gilchrist and Zakrajšek2016) and Dery and Serletis (Reference Dery and Serletis2023) among others. With this approach, the structural parameters in
 ${\boldsymbol{A}}, {\boldsymbol{B}}$
, and
 ${\boldsymbol{D}}$
are identified by maximizing a criterion function subject to inequality constraint(s). The criterion function comprises the summation of impulse responses for target variables, while the inequality constraints specify predefined sign restrictions on these responses within a specific period. Specifically, with a 4-variable VAR comprising of real GDP growth rate, inflation, Divisia money growth rate, and interest rate, a contractionary monetary policy shock is identified as an innovation that leads to the largest increase in the interest rate with a simultaneous decrease in real GDP growth, inflation, and money growth for three consecutive quarters. The penalty function that identifies shock is
 \begin{equation} \boldsymbol{\Psi }\left ({\boldsymbol{s}}_{1}\right )=\sum _{\gamma =1}^{3}\sum _{h=0}^{3}\left (\frac{{\boldsymbol{-}}{\boldsymbol{e}}_{\gamma }^{\prime } {\boldsymbol{L}}_{h}\left ( {\boldsymbol{T}}^{-1},\boldsymbol{\Phi }{\boldsymbol{T}}^{-1}\right ) {\boldsymbol{s}}_{1}}{\omega _{\gamma }}\right ) + \sum _{h=0}^{3}\left (\frac{{\boldsymbol{e}}_{4}^{\prime }{\boldsymbol{L}}_{h}\left ({\boldsymbol{T}}^{-1},\boldsymbol{\Phi }{\boldsymbol{T}}^{-1}\right ) {\boldsymbol{s}}_{1}}{\omega _{4}}\right ) \end{equation}
with
 \begin{align*} {\boldsymbol{e}}_{1}^{\prime }{\boldsymbol{L}}_{h}\left ({\boldsymbol{T}}^{-1},\boldsymbol{\Phi }{\boldsymbol{T}}^{-1}\right ) {\boldsymbol{s}}_{1} & \lt 0\text{, for }h=0,1,2, 3\\ {\boldsymbol{e}}_{2}^{\prime }{\boldsymbol{L}}_{h}\left ({\boldsymbol{T}}^{-1},\boldsymbol{\Phi }{\boldsymbol{T}}^{-1}\right ) {\boldsymbol{s}}_{1} & \lt 0\text{, for }h=0,1,2,3\\ {\boldsymbol{e}}_{3}^{\prime }{\boldsymbol{L}}_{h}\left ( {\boldsymbol{T}}^{-1},\boldsymbol{\Phi }{\boldsymbol{T}}^{-1}\right ) {\boldsymbol{s}}_{1} & \lt 0\text{, for }h=0,1,2,3\\ {\boldsymbol{e}}_{4}^{\prime }{\boldsymbol{L}}_{h}\left ( {\boldsymbol{T}}^{-1},\boldsymbol{\Phi }{\boldsymbol{T}}^{-1}\right ) {\boldsymbol{s}}_{1} & \gt 0\text{, for }h=0,1,2,3 \end{align*}
representing the constraints on real GDP growth, inflation, Divisia money growth, and interest rates. The model is estimated using Bayesian methods, with each estimation conducted separately using a different Divisia money measure to capture the role of alternative Divisia money measures in the identification of monetary policy shock.
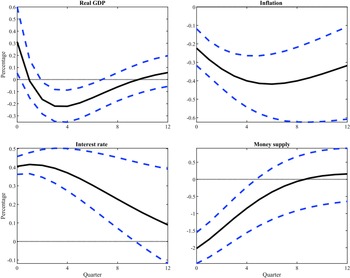
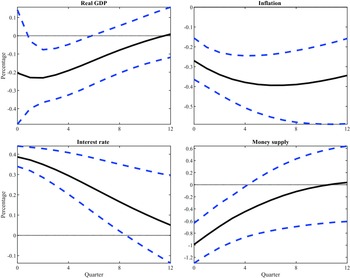
Responses of macroeconomic variables to contractionary monetary policy shock with Divisia M1 in identification. Black solid line is the median response while blue dashed lines are 68% credibility region.

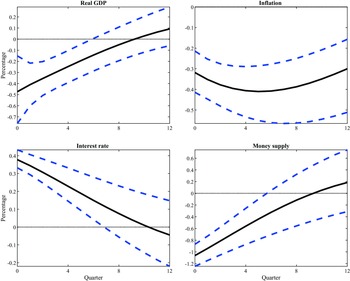
Responses of macroeconomic variables to contractionary monetary policy shock with Divisia M4 in identification. Black solid line is the median response while blue dashed lines are 68% credibility region.

Figures 7 and 8 present the impulse responses to a contractionary monetary policy shock using Divisia M1 (Figure 7) and M4 (Figure 8) in the identification of the shock. The responses of these macroeconomic variables are consistent with empirical evidence on the effects of a contractionary monetary policy shock, thus validating the identified shock. Appendix Figures A8 to A11 show similar results for both narrow and broad credit card-augmented and credit card-augmented inside money measures.
Responses of manufacturing sector real GDP to contractionary monetary policy shock with narrow and broad Divisia in identification. Black solid line is the median response while blue dashed lines are 68% credibility region.

Responses of utilities sector real GDP to contractionary monetary policy shock with narrow and broad Divisia in identification. Black solid line is the median response while blue dashed lines are 68% credibility region.

Figures 9 and 10 present the responses of real GDP in the largest sector (manufacturing - Figure 9) and the smallest sector (utilities - Figure 10) to the identified monetary policy shock.Footnote 8 For the manufacturing sector, the monetary policy shock generates a statistically significant reduction in real GDP growth rate when the policy identification includes a narrow Divisia measure. In the utilities sector, the results are relatively similar, except with Divisia M4.
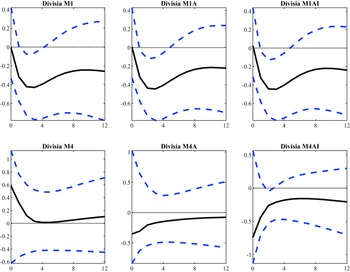
Lastly, Figure 11 compares the responses of the largest sector (manufacturing), the smallest sector (utilities), and the aggregate economy to the monetary policy shock for each category of Divisia money. The results show that the effects of the monetary policy shock are more pronounced and persistent in the manufacturing sector when the policy identification includes narrow Divisia money. In the utilities sector, the responses are generally more pronounced than the aggregate responses and are relatively larger in magnitude compared to the manufacturing sector.
Comparison of largest sector (manufacturing) and smallest sector (utilities) real GDP responses aggregate responses with narrow and broad Divisia in identification.

6. Conclusion
This study explores the behavior and predictive capabilities of narrow and broad Divisia monetary aggregates in relation to sectorial economic and labor market indicators. To accomplish this, I employ quarterly data spanning from 2005Q1 to 2022Q4 to scrutinize the information content and predictive performance of seven policy-related variables across thirteen sectors/industries within the United States (US). This exploration proceeds in four sequential steps.
Firstly, the study investigates the cyclical dynamics of Divisia money aggregates and their correlations with sectorial economic activity indicators. In this pursuit, I adopt the approach laid out by Kydland and Prescott (Reference Kydland and Prescott1990) and apply a regression-based filter as proposed by Hamilton (Reference Hamilton2018) to isolate the cyclical components of these monetary aggregates and sectorial economic activity indicators. I then assess the cyclical correlation and co-movement of money measures with those sectorial economic indicators. I make comparisons between and within three categories of narrow and broad Divisia monetary aggregates; the original Divisia aggregates (Divisia M1 and M4), credit cards augmented Divisia (Divisia M1A and M4A), and credit cards augmented inside money Divisia (Divisia M1AI and M4AI), as well as the traditional Federal funds rate, in order to discern their cyclical characteristics. The analysis shows that both narrow and broad Divisia money measures are more effective leading indicators of sectorial economic and labor market activities than the traditional Fed funds rate. Divisia M4 is favored in more sectors than Divisia M1, while Divisia M1A and M1AI consistently outperform their broad counterparts.
Secondly, following the approach inspired by Bernanke and Blinder (Reference Bernanke and Blinder1992), Belongia and Ireland (Reference Belongia and Ireland2015), and Dery and Serletis (Reference Dery and Serletis2021b), I employ the concept of Granger causality, as outlined by Granger (Reference Granger1969), to evaluate the information content of the Federal funds rate, narrow, and broad Divisia monetary aggregates in terms of their ability to predict sectorial economic and labor market indicators. The findings here reveal that Divisia money measures exhibit relatively higher levels of informativeness compared to the Federal funds rate when it comes to predicting sectorial real GDP, value added, employment, and unemployment rates. Specifically, the Fed funds rate has predictive information for these economic and labor market indicators in at most 6 out of 13 sectors. In contrast, narrow Divisia money (M1, M1A, and M1AI) predicts at least 10 out of 13 sectors, up to a maximum of 13. Broad Divisia measures (M4, M4A, and M4AI) predict at least 5 out of 13 sectors, up to a maximum of 12. Furthermore, the presence of a short-term interest rate does not absorb the information content of both narrow and broad Divisia money when predicting sectorial economic activity.
Thirdly, within the framework of a forecasting regression analysis, similar to the methodology employed by Caldara et al. (Reference Caldara, Fuentes-Albero, Gilchrist and Zakrajšek2016) and Dery and Serletis (Reference Dery and Serletis2021a), I evaluate the ability of changes in the growth rate of narrow and broad money measures to predict changes in the growth rate of specific sectorial economic activity indicators up to two years in advance. This analysis leads to the conclusion that narrow Divisia money measures exhibit greater effectiveness in forecasting sectorial economic activity indicators when compared to their broad money counterparts. The statistical and economic significance of the forecasted results are more pronounced and persistent, as well as mostly in line with economic theory and expectations when using narrow measures.
Lastly, a 4-variable structural VAR model is used to identify the monetary policy shock, with each narrow and broad Divisia money measure entering the identification sequentially. The sectorial real GDP responses to the identified monetary policy shock for the largest sector (manufacturing) and the smallest sector (utilities) are presented, demonstrating heterogeneous responses across sectors. In the largest sector, the monetary policy shock produces more pronounced and persistent effects when identified with narrow Divisia money compared to broad money. In the smallest sector, the responses to the shock are relatively similar regardless of whether narrow or broad Divisia money is used in the identification.
The results indicate that Divisia money measures, particularly narrow ones, are strong predictors of sectorial real GDP, value added, employment, and unemployment rates across various sectors. They often outperform the traditional Fed funds rate in terms of informativeness. The analysis remains robust when considering alternative data transformations, reinforcing the reliability of Divisia money measures in forecasting economic activities. Overall, the study highlights the contemporary relevance of narrow Divisia monetary aggregates in forecasting sectorial economic and labor market indicators across various sectors. These findings emphasize the significance of incorporating these measures in economic analysis and policy-making.
Appendix
Forecasting regression with fed funds rate.

Forecasting regression results with Divisia M1.

Forecasting regression results with Divisia M4.

Cyclical correlations between predictors and sectorial economic activity

Yellow = lagging, blue = Synchronous, Green = leading the cycle
Cyclical correlations between predictors and sectorial labor market activity

Yellow = lagging, blue = Synchronous, Green = leading the cycle
Granger causality test results with data in logged levels

Notes: Numbers are marginal significance levels. Bold numbers indicate significance at 10%.
Count of number of sector in which policy variable is informative when causality is conducted on filtered data

The numbers in this table represent the count of sectors where the null hypothesis of no causality from the policy variable to the specific economic activity measure is rejected at the 10% significance level. Data is filtered using Hamilton (Reference Hamilton2018) filter.
Granger causality test results with data in logged levels and controlling for interest rate

Notes: Numbers are marginal significance levels. Bold numbers indicate significance at 10%.
Granger causality test results data with in quarterly growth rates and controlling for interest rate

Notes: Numbers are marginal significance levels. Bold numbers indicate significance at 10%.
One and two year ahead forecasting regression results for real GDP value added

*p < 0.1, **p < 0.05, ***p < 0.01
One and two year ahead forecasting regression results for employment and unemployment

*p < 0.1, **p < 0.05, ***p < 0.01
Forecasting regression results with Divisia M1A.

Forecasting regression results with Divisia M4A.

Forecasting regression results with Divisia M1AI.

Forecasting regression results with Divisia M4AI.

Responses of macroeconomic variables to contractionary monetary policy shock with Divisia M1A in identification. Black solid line is the median response while blue dashed lines are 68% credibility region.

Responses of macroeconomic variables to contractionary monetary policy shock with Divisia M4A in identification. Black solid line is the median response while blue dashed lines are 68% credibility region.

Responses of macroeconomic variables to contractionary monetary policy shock with Divisia M1AI in identification. Black solid line is the median response while blue dashed lines are 68% credibility region.

Responses of macroeconomic variables to contractionary monetary policy shock with Divisia M4AI in identification. Black solid line is the median response while blue dashed lines are 68% credibility region.