Implications
The foetal ovine mammary gland is sensitive to maternal weight and nutrition during gestation, which can affect milk production at a ewe’s first lactation and the growth of her subsequent lambs to weaning. These affects, however, do not persist for the productive lifetime of the ewe and are not large enough to alter grand-offspring growth to weaning. Therefore, such manipulations are not a viable management tool for farmers to influence lamb growth to weaning.
Introduction
Maternal influences (e.g. diet and weight) during early developmental stages, particularly during foetal life, can lead to physiological and metabolic changes which may have consequences later in life, often referred to as foetal programming (Hales and Barker, Reference Hales and Barker1992; Barker, Reference Barker1997; Hales and Barker, Reference Hales and Barker2001; Gluckman and Hanson, Reference Gluckman and Hanson2004). With regard to livestock species, manipulation of the intrauterine environment (e.g. through differential dam size or maternal nutrition) has the potential to alter the productive performance of offspring – for example, offspring growth rates, carcass characteristics, milk yield (MY) and reproductive performance (Bell, Reference Bell2006; Wu et al., Reference Wu, Bazer, Wallace and Spencer2006; Kenyon, Reference Kenyon2008; Ashworth et al., Reference Ashworth, Dwyer, Mcevoy, Rooke and Robinson2009). Production traits in sheep, including growth and reproductive performance, have been demonstrated to be affected by factors including birth rank, and the nutrition, weight, body condition and age of the dam (Kenyon and Blair, Reference Kenyon, Blair, Jenkinson, Morris, Mackenzie, Peterson, Firth and Johnston2014). There are few studies that investigate the implications of an altered intrauterine environment on the productive performance of offspring over their entire productive lifetime. Knowledge of this would be useful, particularly with regards to selecting replacement animals for breeding.
Milk production of the ewe is an important contributing factor to her overall breeding efficiency. Milk is the sole source of nutrients for the lamb during the first 3 to 4 weeks of life (Degen and Benjamin, Reference Degen and Benjamin2005), and is correlated with lamb survival and growth to weaning (Mellor, Reference Mellor1983). Previous research has demonstrated that the foetal mammary gland may be susceptible to programming effects from maternal pregnancy nutrition. Blair et al. (Reference Blair, Jenkinson, Peterson, Kenyon, van der Linden, Davenport, Mackenzie, Morris and Firth2010, Study 1) reported that above maintenance (1.5× maintenance), compared with maintenance nutrition of the dam during gestation (days 19 to 136 of pregnancy), increased mammary gland ductal area in late gestation foetuses, with no effects on their mammary gland mass. In contrast, van der Linden et al. (Reference van der Linden, Kenyon, Blair, Lopez-Villalobos, Jenkinson, Peterson and Mackenzie2009) reported late gestation foetuses, from dams offered ad libitum nutrition during gestation (days 21 to 140 of pregnancy), had lighter mammary glands compared with foetuses from dams offered maintenance nutrition, with no difference in ductal area. Interestingly, in a cohort of ewe offspring retained for milking, those ewes born to dams offered ad libitum nutrition produced less milk with lower lactose and CP yields (CPYs) at their first lactation, when compared with ewes born to dams offered maintenance nutrition (van der Linden et al., Reference van der Linden, Kenyon, Blair, Lopez-Villalobos, Jenkinson, Peterson and Mackenzie2009). In addition to maternal pregnancy nutrition, weight of the dam may also affect development of the foetal mammary gland; with van der Linden et al. (Reference van der Linden, Kenyon, Blair, Lopez-Villalobos, Jenkinson, Peterson and Mackenzie2009) reporting that foetuses from heavy dams had reduced mammary gland ductal area when compared with foetuses from light dams. Further, in the same study (van der Linden et al., Reference van der Linden, Kenyon, Blair, Lopez-Villalobos, Jenkinson, Peterson and Mackenzie2009); ewes born to light dams also produced less milk than ewes born to heavy dams. More importantly, the lower milk production of ewes born to dams offered ad libitum nutrition and light dams led to them weaning lighter lambs (van der Linden et al., Reference van der Linden, Kenyon, Blair, Lopez-Villalobos, Jenkinson, Peterson and Mackenzie2009). In their second lactation, however, there were no differences in milk production based on dam live weight or pregnancy nutrition (Blair et al., Reference Blair, Jenkinson, Peterson, Kenyon, van der Linden, Davenport, Mackenzie, Morris and Firth2010, Study 2). This finding might suggest that the mammary gland is able to ‘reset’ during involution, however, it remains unclear if redevelopment in subsequent lactation cycles results in differential or similar lactation performance and whether this translates to any long-term production effects.
The ewe offspring from the first parity study of van der Linden et al. (Reference van der Linden, Kenyon, Blair, Lopez-Villalobos, Jenkinson, Peterson and Mackenzie2009) and the second parity study of Blair et al. (Reference Blair, Jenkinson, Peterson, Kenyon, van der Linden, Davenport, Mackenzie, Morris and Firth2010, Study 2) were retained by our research group. Milk production and lambing data were collected for the third, fourth and fifth parities. It was hypothesised that given there was no effect of dam weight and pregnancy nutrition on the second lactation performance of ewe offspring, that there would be no long-term effects on the ewe’s lifetime lactation and lambing performance. As such, the objective of this study was to utilise data collected over the five parities, to evaluate the productive lifetime lactation and lambing performance of ewe offspring that were born to dams’ of differing weight that were offered differing levels of nutrition during pregnancy.
Material and methods
This study was conducted at the Massey Keeble Sheep and Beef farm, 5 km south of Palmerston North, New Zealand (longitude: 175°36'36'E, latitude: 40°21'00'S, winter solstice 21 June). The study and all handling procedures were approved by the Massey University Animal Ethics Committee, Palmerston North, New Zealand.
Background of dam treatments
Briefly, as previously described by Kenyon et al. (Reference Kenyon and Blair2009), in 2005 Romney ewes that were either the heaviest (Hv: n=450, live weight (LW)=60.8±0.18 kg and body condition score (BCS; scale 1 to 5)=3.02±0.03) or the lightest (Lt: n=450, LW=42.5±0.17 kg and BCS=1.97±0.03) were selected from a commercial flock of 2900 ewes and bred using artificial insemination with semen from Suffolk rams. From day 21 of pregnancy (P21), ewes (n=612) were randomly allocated to one of two nutritional regimens until day 140 of pregnancy (P140): maintenance (M), or ad libitum (Ad), under pastoral grazing conditions. Pasture (i.e. a ryegrass and white clover sward mixture) was the only nutritional source. The average pre- and post-grazing pasture covers during P21 to P140 were 1330 kg dry matter (DM)/ha±156.8 and 804.0 kg DM/ha±133.4 for the maintenance treatment. The average pre- and post-grazing covers for the ad libitum regimen were 2304.0 kg DM/ha±156.8 and 1723.3 kg DM/ha±149.7, respectively. Ewes within treatments were rotationally grazed to ensure that target total live weight changes and pasture masses were achieved. The study, therefore, utilised a two-by-two factorial design including: heavy-ad libitum (AdHv), heavy-maintenance (MHv), light-ad libitum (AdLt) and light-maintenance (MLt), all of which contained both singleton-and twin-bearing dams. From day 141 of gestation, all ewes were merged for lambing and managed under ad libitum nutrition conditions. For the remainder of the study the ewe offspring, born in 2005, were managed under New Zealand commercial grazing conditions as one group.
Present study
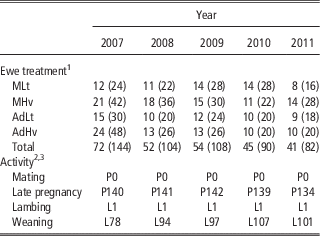
To evaluate the effects of dam weight (Lt and Hv) and nutrition (M and Ad) on ewe progeny lifetime lactational performance, cohorts of twin-bearing adult ewe offspring, born to the previously mentioned Lt- or Hv-dams offered either M or Ad nutrition (M- or Ad-dams, i.e. dams fed at M or Ad level in pregnancy) were milked for 5 consecutive years; from 2007 to 2011, and the LW of their lambs (the grand-offspring of the original dams, i.e. the lambs’ grand-dams), from birth until weaning, was recorded (see Table 1 for details).
Timing of breeding, lambing and weaning activities and number of animals milked during each of the 5 experimental years (2007 until 2011), for each of the dam nutrition (maintenance; M, or ad libitum; Ad)×live weight (light; Lt, or heavy; Hv) treatments: MLt=maintenance-fed, light dam; MHv=maintenance-fed, heavy dam; AdLt=ad libitum-fed, light dam; and AdHv=ad libitum-fed, heavy dam

1 Number in parentheses is number of lambs.
2 P=day of pregnancy
3 L=day of lactation
Ewe live weight and body condition
In the cohorts of twin-bearing ewe offspring retained for milking in 2007, 2008, 2009, 2010 and 2011, LW and BCS were measured at breeding (P0), late pregnancy and weaning of their lambs (refer to Table 1 for number of animals for each year). The same ewes were not necessarily milked each year as only twin-bearing ewes were milked and the ewes that conceived twins varied from year to year.
Lactation performance
In 2007, 2008, 2009, 2010 and 2011, breeding of the ewe progeny was synchronised. A subsample of ewes that were identified as twin bearing at pregnancy diagnosis, using transabdominal ultrasound, were retained for milking. Ewes were milked using the oxytocin method (McCance, Reference McCance1959) once per week for the first 6 weeks of their lactations, starting at an average day 7 postpartum (L7). Ewes were milked in the morning and, after an interval of ~5 h, again in the afternoon. The time of each milking and weight (kg) of milk obtained was recorded. The lambs were separated from the ewes between morning and afternoon milking to prevent suckling and were bottle fed as required. Daily MY was calculated using the formula:
 $${{24\:{\rm h}} \over {{\rm time}\,{\rm between}\,{\rm milkings}}}{\times}{\rm MY}\,{\rm at}\,{\rm second}\,{\rm milking}$$
Milk obtained by machine and hand-stripping was mixed and subsampled for analysis of milk composition and calculation of milk component yields (fat yield (FY), CPY, true protein yield (TPY), casein yield (CY) and lactose yield (LY)) by Fourier transform IR spectroscopy (Milkoscan FT120; FOSS, Hillerød, Denmark) as described by van der Linden et al. (Reference van der Linden, Kenyon, Blair, Lopez-Villalobos, Jenkinson, Peterson and Mackenzie2009). The 2007 and 2008 milking data have been reported separately by van der Linden et al. (Reference van der Linden, Kenyon, Blair, Lopez-Villalobos, Jenkinson, Peterson and Mackenzie2009) and Blair et al. (Reference Blair, Jenkinson, Peterson, Kenyon, van der Linden, Davenport, Mackenzie, Morris and Firth2010), respectively.
Lamb live weights
In 2007, 2008, 2009, 2010 and 2011, within 24 h after birth, lambs were identified to their dam and weighed. Twin-born lambs, whose dams were retained for milking, were weighed weekly during the 6-week milking period, and at weaning (Table 1). Data of lamb LW during the first 6 weeks of each lactation only included twin-born and twin-reared lambs. However, not all ewes successfully weaned both lambs, therefore, the data at weaning included both twin-born and reared lambs as well as twin-born and single-reared lambs.
Statistical analysis
All data are presented as least square means±a pooled standard error (SEp), with statistical significance defined as P⩽0.05 and a statistical tendency is defined as P⩽0.1 but>0.05.
Animal numbers, ewe live weight and body condition score
All data were analysed using ‘ewe’ as the experimental unit. To minimise variation due to the different pregnancy, birth and rearing ranks that naturally occurred (i.e. singleton, twin, triplet, etc.), only data from ewes with complete twin-sets for the duration of the milking period were included. This is an additional reason as to why individual ewes are not necessarily represented in each year of the study. A PROC MIXED in SAS 9.2 (SAS) was used to analyse ewe live weight and BCS, with the fixed effects of dam weight (Hv and Lt), dam nutrition (M and Ad) and ewe birth rank (single and twin). In addition, the two-way interaction of dam weight×dam nutrition was included in the model.
Calculation of lactation yields
Using daily MY data calculated from the once-per-week milkings in 2007, 2008, 2009, 2010 and 2011, accumulated yields were calculated for each lactation. This was done by fitting a third-degree orthogonal polynomial model to MY and composition data for each ewe milked each year:
 $$y_{i} {\,\equals\,}\alpha _{0} \varnothing ∅_{{0i}} {\plus}\alpha _{1} \varnothing ∅_{{1i}} {\plus}\alpha _{2} \varnothing ∅_{{2i}} {\plus}\alpha _{3} \varnothing ∅_{{3i}} {\plus}e_{i} $$
where y i is the record of milk or composition taken at day i, e i the error term associated with each milk record, α n the n regression and ø ni the rescaled value of i days in milk calculated as
 $$\eqalignno{&\varnothing ∅_{{0i}} {\,\equals\,}1; \,\varnothing ∅_{{1i}} \,{\equals}\,x; \,\varnothing ∅_{{2i}} \,{\equals}\,{{\left( {3x^{2} {\minus}1} \right)} \over 2}; \varnothing ∅_{{3i}} \,{\equals}\,{{(5x^{3} {\,\minus\,}3x)} \over 2}; \cr&{\rm where}\,\,x\,{\equals}\,{{2(i{\,\minus\,}(50{\,\plus} 1))} \over {(50{\,\minus\,}1)}}, $$
Accumulated MY and composition (FY, CPY, TPY, CY and LY) yields were calculated over L1 to L42 for each ewe using estimates calculated from the regression coefficients of the third-degree orthogonal polynomial model. Milk net energy (NE, MJ/l) was calculated for each ewe for each lactation using the following equation, based on cattle, from Holmes et al. (2002):
 $${\rm NE}{\,\equals\,}0.376{\times}{\rm F}\,\%\,{\plus}0.209{\times}{\rm CP}\,\%\,{\plus}0.976\left( {{\rm MJ}/{\rm l}} \right)$$
where F% is milk fat percentage and CP% is milk CP percentage. Accumulated milk net energy yield (NEY) was then calculated by multiplying the NE by the accumulated MY (kg) calculated from the Legendre orthogonal polynomial model.
Differences in the shape of the lactation curve were analysed by comparing the differences in MY at the start (day 1; MY1), and end (day 42; MY42) of the milking trial period. Differences in peak MY(MYp) and day of peak MY (dMYp), obtained from the Legendre orthogonal polynomial estimates, were also analysed. Lactation persistency for each year was calculated by two measures: the first measure (Persistency 1) was determined by the rate of decline of MY from dMYp to day 42 of lactation, calculated by the following equation:
 $${\rm MY}\,{\rm decline}{\,\equals\,}{{{\rm MY}_{{\rm p}} {\minus}{\rm MY}_{{42}} } \over {42{\minus}{\rm dMY}_{{\rm p}} }}$$
where MYp is MY at day of peak lactation, MY42 is MY at day 42 of lactation, and dMYp is day of peak lactation. Persistency 1 is particularly useful for investigating differences in the decline of MY after peak lactation. Differences in MY decline may indicate variation in rates of apoptosis and/or metabolic activity of milk secretory cells among the treatments. The second measure (Persistency 2) was determined by dividing the lactation measurement period into three equal periods (early lactation: L1 to L14, mid lactation: L15 to L28 and late lactation: L29 to L42). The area under the curve (AUC) for each period was calculated and the correlation between late lactation (AUC29–42) and early lactation AUC1–14 was determined. The more correlated AUC29–42 and AUC1–14 (i.e. closer to 1.0); the more persistent the lactation was considered. Persistency 2 considers the early lactation period as well as the decline in MY after peak lactation and is more representative of changes in the lactation curve than Persistency 1.
Analysis of lactation parameters
Effects on ewe lifetime MY, LY, FY, CPY, TPY, CY, NEY, MY1, MY42, MYp, dMYp, Persistency 1 and Persistency 2 were analysed. While each treatment was represented in each year, the individual animals varied; therefore, a repeat measure analysis was not used. Rather, a PROC MIXED in SAS 9.2 (SAS) was used with fixed effects of dam weight, dam nutrition, ewe birth rank and parity. In addition, the two-way interaction of dam weight×dam nutrition and the three-way interaction of dam weight×dam nutrition×ewe parity were included in the models. Interactions which were not significant were not removed from the model in order to test the study design. Analyses of MY and composition yields of ewes were run both with and without ewe LW in late pregnancy fitted as a covariate. This covariate was fitted to determine if any effects observed were due to live weight differences.
Analysis of lamb (grand-offspring) weights
Effects on lamb LW (the grand-offspring of the original dams) at birth and weaning, and lamb growth from birth to weaning were analysed. As per the analysis of the lactation parameters, repeat measure analysis was not used as individual animals varied. A PROC MIXED in SAS 9.2 (SAS) was used with fixed effects of grand-dam weight, grand-dam nutrition, ewe birth rank and parity. In addition, the two-way interaction of grand-dam weight×grand-dam nutrition and the three-way interaction of grand-dam weight×grand-dam nutrition×ewe parity were included in the models. Interactions which were not significant were not removed from the model in order to test the study design. Analyses of lamb LW at birth and at weaning were carried out using the combined LW of both lambs (in a twin pair), with ewe fitted as a random effect. All lambs in the analyses were twin born, however, not all ewes in the study successfully reared twins. Therefore, the number of lambs weaned per ewe was fitted as a covariate for the analysis of lamb LW at weaning. Data of ewes which did not successfully wean any lambs were removed from the analysis. In addition, the analysis of lamb LW at weaning was run both with and without lamb LW at birth as a covariate. This covariate was fitted determine if any effects observed were driven by lamb birth weight.
Results
Average ewe live weight and condition score over five parities
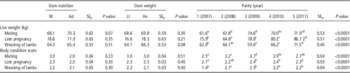
Dam nutrition had a tendency to affect the average ewe LW at breeding over 5 years, such that ewe offspring born to ad libitum fed dams (Ad-dams) tended (P=0.07) to be heavier at mating than ewe offspring born to maintenance fed dams (M-dams; Table 2). Dam nutrition (M or Ad) during pregnancy did not affect (P>0.05) the average LW of ewe offspring, over the 5 years examined, during late pregnancy or at the weaning of the ewe offspring’s lambs. Dam weight (Hv or Lt) did not affect (P>0.05) the average LW of ewe offspring, over the 5 years examined, at mating or during late pregnancy. Ewes born to Hv-dams tended (P=0.08) to be heavier, themselves, at weaning of their own lambs, when compared with ewes born to Lt-dams (Table 2). The average BCS, over 5 years, of ewe offspring at breeding, late pregnancy and weaning of their lambs was unaffected (P>0.05) by dam weight and dam nutrition during pregnancy. The average ewe LW and BCS, at mating, late pregnancy and weaning of their lambs, varied over the five lactations (P<0.0001; Table 2). Ewe LW at mating was at its lowest before their first lactation (Table 2). In addition, ewes had their lowest BCS at mating, late pregnancy and weaning of their lambs in their 1st reproductive year (Table 2). Ewe LW during late pregnancy, however, was the lowest during their second reproductive year, whereas ewe LW at lamb weaning was lowest during their 3rd reproductive year (Table 2). Ewes had their heaviest LW at mating, late pregnancy and weaning of their lambs in their 5th reproductive year (Table 2).
Least-squares means±pooled standard error (SEp) of live weight (kg) and body condition score of ewes born to either heavy (Hv) or light (Lt) dams that were fed either maintenance (M) or ad libitum (Ad) nutrition from pregnancy day 21 to 140 (P21-140), at mating, late pregnancy and weaning of their lambs and over five parities (2007 to 2011)

a,b,c,dValues within rows within treatment with different superscripts differ significantly at P<0.05.
Milk and milk component yields
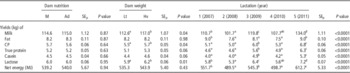
Nutrition of the dam during pregnancy influenced the performance of ewe offspring during their first lactation such that ewes born to Ad-dams had reduced MY (P=0.03) and LY (P=0.01) compared with ewes born to M-dams (Table 3 for MY and Table 4 for LY). There were, however, no differences (P>0.05), attributed to dam nutrition, on ewe-offspring lactation performance during any other parity (second, third, fourth and fifth lactations). Ultimately, dam nutrition during pregnancy did not (P>0.05) affect the average lactation performance of ewe offspring over five lactations, as evidenced by no differences in average MY, FY, CPY, TPY, CY, LY and NEY (Table 5).
Least-square means±pooled standard error (SEp) of yearly average accumulated milk yield (MY, kg), for 5 consecutive lactations, of twin-bearing ewes born to heavy (Hv) or light (Lt) dams that were fed either maintenance (M) or ad libitum (Ad) nutrition during pregnancy days 21 to 140 (P21 to P140)

a,bValues within rows within treatment with different superscripts differ significantly at P<0.05.
Least-square means±pooled standard error (SEp) of yearly average accumulated lactose yield (LY, kg), for 5 consecutive lactations, of twin-bearing ewes born to heavy (Hv) or light (Lt) dams that were fed either maintenance (M) or ad libitum (Ad) nutrition during pregnancy days 21 to 140 (P21 to P140)

a,bValues within rows within treatment with different superscripts differ significantly at P<0.05.
Least-squares means±pooled standard error (SEp) of average lactation yields (kg), over five lactations, for milk, fat, CP, true protein, casein and lactose, and average milk net energy yields (MJ) of ewes born to either heavy (Hv) or light (Lt) dams that were fed either maintenance (M) or ad libitum (Ad) nutrition from pregnancy days 21 to 140 (P21 to P140)

a,b,c,dValues within rows within treatment with different superscripts differ significantly at P<0.05.
Ewes born to Hv-dams tended to produce greater MY (P=0.07, Table 3) and produced greater LY (P=0.03, Table 4) during their first lactation, compared with ewes born to Lt-dams. Dam weight did not (P>0.05) affect ewe-offspring MY and LY produced in their second, third, fourth or fifth lactations. However, on average over the five lactations, ewes born to Hv-dams produced greater MY (P=0.04), CPY (P=0.04), LY (P=0.01) and tended to produce greater TPY (P=0.06) and CY (P=0.06), compared with ewes born to Lt-dams. There were no differences (P>0.05) in average milk FY and NEY produced over the five lactations by ewe offspring.
Lactation curve and persistency
Dam weight and dam nutrition during pregnancy had no effect on the 5-year average MY1, MY42, MYp, dMYp (Table 6). Lactation persistency, as measured by rate of decline in MY from peak to day 42 (Persistency 1) and correlation between late and early lactation (Persistency 2) also did not differ.
Least-squares means±pooled standard error (SEp) of average daily milk yields (kg) at 1 day after the mid-point of lambing (MY1), at peak production (MYP), at day 42 postpartum (MY42); and the average day postpartum at which peak milk yield occurred; and two lactation persistency (g/day) determinations are shown, Persistency 1 and Persistency 2. All measurements were made over five lactations, for ewes born to either heavy (Hv) or light (Lt) dams that were fed either maintenance (M) or ad libitum (Ad) nutrition from pregnancy day 21 to 140 (P21 to P140)

a,b,c,dValues within rows within treatment with different superscripts differ significantly at P<0.05.
1 Persistency 1: as measured by decline in milk yield from peak (MYp) to day 42 postpartum (MY42).
2 Persistency 2: as measured by determining the correlation between the area under the curve (AUC) for late lactation (days 29 to 42: AUC29–42) and the AUC for early lactation (days 1 to 14: AUC1–14). The more correlated AUC29–42 and AUC1–14 (i.e. closer to 1.0) the more persistent the lactation is considered.
Lamb live weights and growth to weaning
There were no (P>0.05) interactions seen in relation to the LW of grand-offspring at birth or on their growth from birth to weaning (data not shown). There was, however, a tendency for a three way interaction of ewe parity (1 to 5)×grand-dam nutrition (M and Ad)×grand-dam weight (Hv and Lt) on grand-offspring LW at weaning, such that during the first parity, grand-offspring of AdLt-grand-dams were lighter than grand-offspring from all other treatments (AdLt=44.5±1.45 v. AdHv=50.4±1.16, MLt=52.5±1.61 and MHv=50.6±1.22 kg). This difference was not observed in later parities. In addition, the interaction was no longer present when the model was adjusted for lamb LW at birth (data not shown). There were no effects (P>0.05) of grand-dam nutrition, grand-dam weight or dam birth rank on the LW of grand-offspring at birth and at weaning, or on their growth rates from birth until weaning (Table 7).
Least‐squares means±pooled standard error (SEp), recorded for 5 years (2007 to 2011), of the average combined LW (kg) at birth and weaning, and average daily gain from birth to weaning (ADG), of lambs born to ewes (lambs’ dams) that were themselves born to either heavy (Hv) or light (Lt) dams (lambs’ grand-dams) that were fed either maintenance (M) or ad libitum (Ad) nutrition from pregnancy days 21 to 140 (P21 to P140)

a,b,c,dValues within rows within treatment with different superscripts differ significantly at P<0.05.
1 The LW and ADG data presented is that of the combined twin lamb pair.
Discussion
Previous research has demonstrated that weight and pregnancy nutrition of the dam can affect first parity lactation performance of offspring (van der Linden et al., Reference van der Linden, Kenyon, Blair, Lopez-Villalobos, Jenkinson, Peterson and Mackenzie2009), whereas the second parity lactation appears to be unaffected (Blair et al., Reference Blair, Jenkinson, Peterson, Kenyon, van der Linden, Davenport, Mackenzie, Morris and Firth2010). However, the long-term effects on offspring lactation performance were unknown. The ewe offspring of the previously mentioned studies were retained and subsamples of twin-bearing ewes were milked each year for their third, fourth and fifth parities. Using milk production data from the five parities, the present study examined the effects of dam weight and pregnancy nutrition on the average lactation performance of offspring and the LW and growth of grand-offspring from birth to their weaning. In the present study there were no three-way interactions of ewe parity×dam nutrition×dam weight, or two-way interactions of dam weight×dam nutrition on any of the ewe LW, BCS and milk production parameters measured in the offspring over the five lactations. The results, therefore, are discussed in relation to the main effects of dam nutrition and dam weight only.
Dam nutrition
Despite ewes born to Ad-dams having reduced MYs in their first parity lactation, compared with ewes born to M-dams (van der Linden et al., Reference van der Linden, Kenyon, Blair, Lopez-Villalobos, Jenkinson, Peterson and Mackenzie2009), there appears to be no effect of dam pregnancy nutrition on offspring lactation performance over five parities. It appears that the programming effects in the first lactation are lost in subsequent parities thus explaining why there are no differences in lifetime lactation performance. It is possible that programmed differences may only be present in the mammary cells that undergo apoptosis during involution, and thus the effect is lost upon regression of the mammary gland after weaning (Akers and Capuco, Reference Akers and Capuco1999; Capuco and Ellis, Reference Capuco and Ellis2013). In subsequent pregnancies, the ewe offspring were maintained on the same nutrition and, therefore, may have undergone the same extent of mammary re-development. Furthermore, the adult ewe offspring were maintained on ad libitum nutrition in late pregnancy and in lactation which may be unlikely to cause physiological stress. If the mismatch hypothesis is correct offspring born to M-fed dams may be programmed to be thriftier under more constrained nutrition (Gluckman and Hanson, Reference Gluckman and Hanson2004); it may be worthwhile, in future studies, to test the productive performance of offspring in different postnatal nutritional environments. Consistent with the lack of differences in average milk production over the five parities, there were no differences in the total birth weight, total weaning weight and total growth rates of lambs born to the subset of ewes that were milked. This finding is consistent with the analysis of the whole flock, which included more than just the subset of ewes milked here, which showed no differences in lifetime ewe reproductive performance and in the number and weight of lambs weaned (Asmad et al., Reference Asmad, Kenyon, Pain, Parkinson, Peterson, Lopez-Villalobos and Blair2014). In terms of lamb production systems, collectively these findings indicate that there may be no long-term advantages to be gained on future offspring performance through manipulating nutrition of the dam during pregnancy.
Dam weight
The study of van der Linden et al. (Reference van der Linden, Kenyon, Blair, Lopez-Villalobos, Jenkinson, Peterson and Mackenzie2009) demonstrated that offspring born to Hv-dams produced more milk in their first lactation with greater LY compared with ewes born to Lt-dams. In the present study, there were no differences in MY each year, from 2008 to 2011, between ewes born to Lt and Hv-dams. However, numerically ewes born to Hv-dams produced more milk and this is reflected in the average yearly production over five parities, such that of ewes born to Hv-dams had greater MY, LY, CPY, TPY and CY, compared with ewes born to Lt-dams. These findings demonstrate a long-term effect on offspring lactation performance as a result of dam weight. It is possible that ewes born to Lt-dams may have reduced mammary gland development leading to impaired lactation performance in adult life. Indeed, the study of van der Linden et al. (Reference van der Linden, Kenyon, Blair, Lopez-Villalobos, Jenkinson, Peterson and Mackenzie2009) reported smaller mammary duct area in foetuses of Lt-dams compared with foetuses from Hv-dams. These findings may be of relevance in dairy production enterprises as farmers may be able to select heavier dams for breeding in order to permanently improve milk production of the subsequent generation.
Despite ewes born to Hv-dams having higher milk production than ewes born to Lt-dams, there were no differences in the average LW of grand-offspring at weaning, indicating that the extra milk produced did not result in greater lamb growth. In the whole population analysis, Asmad et al. (Reference Asmad, Kenyon, Pain, Parkinson, Peterson, Lopez-Villalobos and Blair2014) also reported no differences in the weights of lambs weaned based on dam size. This finding raises the possibility that the measure of milk production of the ewe does not reflect the intake of milk consumed by the lamb (van der Linden et al., Reference van der Linden, Lopez-Villalobos, Kenyon, Thorstensen, Jenkinson, Peterson and Blair2010). In addition, although milk is an important factor for lamb survival and growth, it is not the only influencing factor and solid feed intake (pasture), to some extent, will also contribute to lamb growth rates (Degen and Benjamin, Reference Degen and Benjamin2005). Thus, although dam weight appears to have a lasting effect on the lactation performance of the ewe offspring, there appears to be no benefit for lamb production. Therefore, in lamb production enterprises, it may be more efficient to breed lighter dams, compared with heavier dams (Morel and Kenyon, Reference Morel and Kenyon2006), as there appears to be no detrimental effects on offspring reproductive performance (Asmad et al., Reference Asmad, Kenyon, Pain, Parkinson, Peterson, Lopez-Villalobos and Blair2014).
In conclusion, dam weight had lasting effects on ewe offspring lactation performance, such that ewes born to Hv-dams produced more milk than ewes born to Lt-dams. However, despite producing higher MYs, ewes born to Hv-dams did not wean heavier lambs over a 5-year period. Therefore, there is no lamb production advantage to be gained from having heavier dams, in the range used in this study. The findings may, however, be of interest in farming enterprises where milk is harvested for human consumption. In support of the hypothesis, nutrition of the dam, while influencing first lactation performance, did not have lifetime effects. Thus, it appears that manipulating dam nutrition during pregnancy to enhance offspring lactation performance and increase the weight of subsequent offspring, is not a practicable option.
Acknowledgements
The authors would like to acknowledge the International Sheep Research Centre, Massey University and Gravida; National Centre for Growth and Development, for funding this work.