On 3 March 1873, the last day of the 42nd Congress, the congressional membership voted itself a 50 percent pay increase, from $5,000 to $7,500 per annum, which was also made retroactive to the first day of the Congress. At the time of the vote, a significant number of members were lame ducks, or nonreturning, which meant that they would be exiting the chamber with a $5,000 going-away present. The press characterized the pay raise as the “Salary Grab,” and many newspapers connected it to the recent Crédit Mobilier scandal in charging the governing Republican majority in Congress with perpetuating a climate of corruption. These charges would take their toll, as the Republicans would go on to suffer heavy losses in the state elections of 1873. Moreover, the public backlash against the grab was so intense and lasting that Congress acted to rescind the salary increase at the beginning of the following (43rd) Congress.
In this article, we investigate the determinants of congressional voting on the Salary Grab. The historical literature echoes the reporting of the time, suggesting that the passage of the grab was a function of Republican arrogance combined with lame duck greed. We show, however, that Republicans and lame ducks were no more likely to support the salary increase than Democrats or returning members of Congress. We posit, instead, that voting on the Salary Grab was part of a larger storyline of political reform that developed during the 1870s and stretched into the Progressive Era. Specifically, we argue that a reform coalition emerged during the 42nd Congress, coalescing around a series of “good government” issues, such as opposition to the Salary Grab. Although history has been kinder to the rhetorical strategies of this good government coalition, proponents of the salary increase also used the rhetoric of reform, arguing that raising salaries would democratize government by lowering entry barriers to Congress and by acting as an efficiency wage.
We argue that the Salary Grab constituted a major legislative battle that served as an early focal point in the decades-long war between the forces for “good government” and advocates of patronage-based machine politics. In analyzing the politics of the Salary Grab and the good government coalition that emerged in the 42nd Congress (1871–1873), we shed new light on the history of the Progressive movement by focusing on its historical antecedents. Specifically, we show that the liberal reform agenda that was an important component of the Progressive movement took hold shortly after the Civil War.
Most scholars of Progressive Era politics focus on events during the first two decades of the twentieth century, notably the period spanning Theodore Roosevelt's presidency; thus, they do not trace the groups advocating reform back to their beginnings. Part of the difficulty in determining the origins of the Progressive movement is that it comprised an amalgam of reform agendas—ranging from the control of big business to the control of personal behavior—that were advocated by a mix of interest groups in the early twentieth century. From our twenty-first century perspective, many of the Progressive Era reforms seem contradictory. For instance, expanding political rights through women's suffrage constituted a major success of the Progressive movement, as it allowed for greater equality between the sexes. However, limiting political rights through literacy requirements was also viewed as progressive because it limited immigrants' electoral impact and their ability to participate in patronage-based machine-style politics, which was often tied directly to the rising corruption in government after the Civil War.1
For an overview of the suffrage restrictions adopted in the late nineteenth and early twentieth centuries, see Keyssar, Right, pp. 119–29.
To understand the many impulses behind the Progressive movement, the origins of its constituent groups need to be carefully uncovered. We focus on the early postbellum political activity of one such group, the displaced traditional elite. Doing so expands on the work of Richard Hofstadter, who argues that the leadership of the Progressive movement consisted of these traditional elites—the established civic leaders from the Northeast and Midwest—who were dismayed by the appearance of a new industrial class and who failed to maintain a central role in politics as patronage-based mass parties grew in importance.2
Wiebe, Search, argues that the Progressive Movement found its support in the middle class, which sought to manage society with greater efficiency. See Fogel, Fourth Great Awakening, for a discussion of the importance of religious awakenings and their impact on political outcomes regulating personal behavior. Alston, Dupré, and Nonnenmacher, “Social Reformers,” provide evidence for Fogel's hypothesis.
Although this elite coalition of the early 1870s failed initially in its twin objectives of cleaning up the national political scene and creating a true “reform party,” it succeeded by helping to establish a viable reform element within the Republican Party and national party politics more generally. This, in turn, set the stage for later legislative victories such as the Pendleton Act in 1883, which initiated merit-based civil service, and state-level secret ballot initiatives in the late-1880s and early-1890s, which protected voters' identities and facilitated split-ticket voting. These legislative victories undercut the machine-politics that defined party organizations after the Civil War and presaged later political developments, such as the emergence of primary elections and the direct election of Senators, during the early twentieth century.
CONGRESSIONAL PAY AND THE “SALARY GRAB”
At the Constitutional Convention in 1787, the “Founders” spent a considerable amount of time debating broad institutional reforms to deal with the myriad of collective-action problems that emerged under the Articles of Confederation. The Founders also found time to discuss more pragmatic political issues, such as the “nuts and bolts” that would allow government to operate on a daily basis. One such issue was how to determine the pay of members of Congress. Eventually, they decided to place the duty of setting congressional salaries directly in the hands of Congress itself.3
See Article I, Section 6 of the Constitution: “The Senators and Representatives shall receive a Compensation for their Services, to be ascertained by Law, and paid out of the Treasury of the United States.”
This sensitive duty was a double-edged sword for members: they could make their positions more lucrative, but not without running the risk of upsetting their constituents. Case in point was the Compensation Act of 1816, which raised salaries from $6 per day to $1,500 per year.4
This $6 per diem was first established in 1789, during the First Congress (1 Statutes at Large 70–71; 22 September 1789). Members worked an average of 150 days per year during this era, which converted to an annual wage of around $900.
See Bianco, Spence, and Wilkerson, “Electoral Connection.” The pay raise was eventually repealed in 1817, in the lame-duck session of the same Congress that initially passed it (3 Statutes at Large 345; 6 February 1817). In 1818 the per diem of $6 a day was increased to $8 a day (3 Statutes at Large 404; 22 January 1818), where it stood until 1856, when an annual salary of $3,000 was instituted (11 Statutes at Large 48; 16 August 1856).
See Fisher, “History.”
On the whole, members of Congress in the nineteenth century enjoyed few of the perquisites that we associate with their contemporary counterparts. Although they had the ability to send mail to constituents free of charge (i.e., the “franking privilege”), members were not provided with any organizational benefits, such as a professional staff. If a member of Congress circa 1870 chose to employ any personal clerks or administrators, he had to pay them directly out of his $5,000 salary.7
The lone exception involved standing committee chairmen, who were provided with a clerk (and office space) at federal expense. This explains, in part, the expansion in the number of standing committees after the Civil War, many of which dealt with mundane matters and rarely (if ever) actually met.
White, Republican Era, pp. 380–82.
To stay afloat while living in Washington, many members of Congress pursued a second occupation on the side, to maintain an auxiliary source of income.9
Fisher, “History,” p. 34.
The Civil War was the first time that there was sufficient money at the federal level such that lobbying and graft arose. Prior to this period, the majority of allegations concerning corruption in government transpired at the state level.
The legislation that became known as the Salary Grab originated in the waning days of the 42nd Congress, amid the normal course of congressional business.11
Although we discuss portions of both House and Senate debates on the salary increase, we will focus specifically on the House votes in our narrative and regressions. This is because there was a greater electoral connection between constituents and House members at this time: House members were elected directly by district-level voters, whereas Senators were only indirectly elected, chosen instead by state legislatures.
Throughout the article we will refer to the roll calls by their Inter-University Consortium for Political and Social Research (ICPSR) codes.
Congressional Globe, 42–3, 10 February 1873, p. 1234. The Congressional Globe was a roughly verbatim account of the congressional proceedings. In terms of notation, each reference to the Globe will be followed by: Congress-Session, date, and page number of the debate or vote.
On 24 February 1873 the House convened to conduct the routine procedure of hammering out a legislative appropriations bill. As the membership debated technical provisions, Butler again proposed an amendment to increase the salaries of several government officials. On 28 February this bill (RC 506) was defeated 69–121, Republicans voting 40–77 and Democrats voting 29–44; however, the vote to reconsider and adjourn (RC 507)—essentially keeping the salary bill alive—was passed 114–61, Republicans voting 62–49 and Democrats voting 52–12.14
Congressional Globe, 42–3, 28 February 1873, p. 1926.
The next day, 1 March, brought three roll calls. The first (RC 508) was a motion to table the Salary Grab, offered by John Farnsworth (R-IL), which was defeated 66–105, Republicans voting 48–59 and Democrats voting 18–46. If this tabling motion had passed, the debate over the salary increase would have been over. The next roll call (RC 509) was a motion offered by Butler to reconsider the Salary Grab legislation, which passed 105–79, Republicans voting 57–52 and Democrats voting 48–27. The final roll call (RC 510) was a motion made by James Garfield (R-OH) to accept a Senate amendment that stipulated a smaller salary increase for members of Congress, from $5,000 to $6,500, while eliminating allowances for mileage, newspapers, and stationary. If passed, the amendment would be would tacked on to the legislative appropriations bill, which would then be sent to conference committee, where it could be further modified before a final bill was reported back to each chamber. This scaled-back salary increase passed 100–97, Republicans voting 52–62 and Democrats voting 48–35.15
Congressional Globe, 42–3, 1 March 1873, p. 1977.
A stacked conference committee included Butler and Matthew Carpenter (R-WI), who sponsored the pay raise legislation in the Senate. After much internal wrangling, the conference committee reported a bill out on 3 March, the final day of the Congress, which effectively mirrored the original proposal by Butler, reinstituting the $2,500 congressional pay raise.16
Peskin, Garfield, pp. 365–66, claims that five of the six members of the conference committee supported Butler's salary proposal. Only James Garfield, the chairman of the House Appropriations committee, opposed the initiative. Garfield eventually acquiesced after several hours of tense discussions, because of two factors: he was able to persuade the committee to eliminate a mileage stipulation in the plan, which would save the Treasury around $200,000; and he feared that voting down the appropriations bill would force a special session of Congress, which would open up a new set of potential problems for the Republicans.
Congressional Globe, 42–3, 3 March 1873, pp. 2105, 2184. For further accounts of these proceedings, see Robinson, Salary Grab; Rhodes, History; Peskin, Garfield; and Thompson, Spider Web.
The proposed increase in congressional salaries, though coupled with proposed increases for other governmental officials, was controversial throughout the various proceedings and votes. Congress was still reeling from the Crédit Mobilier scandal, leading many members to caution against any actions—such as a congressional pay raise—that might further “stir the pot” as the congressional session came to an end. In addition, the proposed pay raise was offered as an amendment to an appropriations bill, rather than as a separate bill, leading some members to worry that the public might view the increase as a “backdoor” attempt and yet another example of governmental corruption. Finally, and perhaps most importantly, the pay raise amendment was considered in the “lame duck” (or “short”) session of Congress, when nearly 50 percent of the House membership was in its final days.18
Lame ducks comprised 114 of 243 members in the House and 16 of 74 members in the Senate. Prior to the passage of the 20th Amendment in 1933, elections to the subsequent Congress took place prior to the short session of the current Congress, resulting in a legislative environment in which lame duck (or nonreturning) members were freed from electoral accountability.
To the chagrin of Butler and his supporters, the congressional pay raise prompted a public outcry. Although some newspapers, such as the Titusville Morning Herald, initially claimed that the salary increase was “reasonable enough,” and that a “liberal salary will leave the field of competition open to poor men as well as rich, to the man of brains, as well as to the owner of dollars, to the lawyer as well as the banker,” the tide of public opinion turned quickly once the retroactive element was widely understood.19
5 March 1873, p. 2, c. 1.
15 March 1873, p. 1, c. 2.
27 March 1873, p. 1, c. 3.
The Salary Grab, as described by newspaper reports, was an “easy” issue, one that could be processed at the gut level by all citizens regardless of their degree of sophistication or attentiveness to politics.22
For a discussion of “easy” versus “hard” issues, see Carmines and Stimson, “Two Faces.”
Josephson, Politicos, p. 186. See Rhodes, History; and Fisher, History, for similar arguments.
Recipients of the retroactive salary payment in the 42nd Congress were not forced to repay any monies, but many in fact chose to do so. The political costs of not repaying the retroactive “gift” were considerable for some members. 18 Statutes at Large 4. Both Butler and Carpenter continued to defend their support for the Salary Grab, but the public was unconvinced by their arguments. Both lost their bids for reelection to the 44th Congress.
HISTORY AND HYPOTHESES
The historical literature proposes several hypotheses to explain the passage of the Salary Grab. Both William Dunning and Josephson paint it as a Republican led initiative, resulting from the arrogance of a large and seemingly insurmountable partisan majority in place since the Civil War.25
Dunning, Reconstruction; and Josephson, Politicos.
Peskin, Garfield; and Thompson, Spider Web.
Theriault, “Congressional Pay.”
We find little empirical evidence to support these hypotheses. Examining the final Salary Grab vote on 3 March, we find that the Republicans were nearly split in both the House and Senate. In the House, 61 Republicans voted in favor of the salary increase and 56 against, whereas in the Senate, 26 voted in favor and 21 against. We also find minimal empirical support for the lame duck hypothesis.28
Although the lame duck argument seems quite reasonable on its face, given that exiting members of Congress should plausibly have different incentives (i.e., more self-interested incentives) once the “electoral connection” is severed, recent work on congressional voting behavior uncovers little evidence to support the argument. Rather, most scholars find that members of Congress “die in their ideological boots.” That is, according to Poole, “Changing Minds?” p. 3, “based upon the roll-call voting record, once elected to Congress, members adopt an ideological position and maintain that position throughout their careers—once a liberal or a conservative or a moderate, always a liberal or a conservative or a moderate.” This finding holds not only for members of the contemporary Congress, but also for members from bygone eras; members exhibit high levels of individual-level ideological stability across nearly all of U.S. history (see Poole and Rosenthal, Congress). Specifically, members' voting records remain essentially the same, regardless of whether they plan to retire from the House (Lott, “Political Cheating”; Van Beek, “Does the Decision”; Lott and Bronars, “Time Series Evidence”; Poole and Rosenthal, Congress), plan to run for a higher office (Hibbing, “Ambition”; and Poole and Romer, “Ideology”), serve in a higher office (Grofman, Griffin, and Berry, “House Members”; and Poole and Rosenthal, Congress), or have their districts redrawn (Poole and Romer, “Ideology”; Poole, “Changing Minds?”). The first two categories of evidence relate directly to the lame duck argument, suggesting that there are in fact no “last term” effects.
Theriault provides a more general framework in which to study congressional pay raises, arguing that such increases “perhaps better than any other issue, pit members' personal interests against their constituents' preferences.”29
Theriault, “Public Pressure,” p. 444.
During the debates on the proposed salary increase in 1873, members offered a series of sophisticated economic rationales concerning how a pay raise would affect their selection and incentives. Arguments were made by two competing camps, but these arguments were not correlated with the dominant left-right cleavage in congressional politics. On one side was a group of elite reformers, with a core allegiance in New England and the Midwest, whereas on the other side was a set of seasoned machine politicians in the Mid Atlantic and South. The elite reformers wanted to maintain the monetary entry barriers to Congress, preserving its exclusive and paternalistic status. The machine politicians wanted to broaden the representation of Congress and maintain the patronage- and spoils-based politics that brought them to power.
Background Context
After the Civil War and into the early-1870s, the Republican Party was run by the “Stalwarts,” a group close to the Grant Administration, who favored patronage-based, machine-style politics and supported a “crony” Republican regime in the Reconstructed South. Best known among the Stalwarts were Butler, Carpenter, and Roscoe Conkling (R-NY). Their principle rivals were the “Half Breeds,” moderate Republicans led by James Blaine (R-ME) who were less tied to patronage politics, favored the end of Reconstruction, and worked to tie the party more closely to the growing industrial interests that emerged after the Civil War. There was typically a half-hearted reform element within the Half Breed organization, but only when it was politically expedient. A third, smaller group of “Liberal Reformers” often proved to be pivotal within the Republican organization. Led by men such as Charles Sumner (R-MA), George Frisbie Hoar (R-MA), and Carl Schurz (R-MO), this group broke away from the Republican Party twice: once in 1872 to form the Liberal Republican party, which was a dismal failure, and again in 1884—when they were known as the Mugwumps—to support Democrat Grover Cleveland for president.30
In 1872 the reformers tired of the Grant Administration and decided to form their own Liberal Republican party. See Ross, Liberal Republican Movement. In March 1872 they held their nominating convention in Cincinnati, with the explicit goal of removing Grant and his allies from office and replacing them with liberal reformers. They were unable, however, to advance a liberal platform, as the convention attracted a mix of Republican dissidents with contradictory preferences—free traders and protectionists, civil service reformers and spoilsmen, and advocates of “Negro rights” and Southern redeemers all attended. Sproat, Best Men, p. 6. In the end, leaders in the liberal movement were passed over in favor of Horace Greeley, the editor of the New York Tribune, a man of conflicting visions. The Democrats also endorsed Greeley, further muddying the intended liberal message. Greeley won only 43.8 percent of popular vote and carried just six states: Georgia, Kentucky, Maryland, Missouri, Tennessee, and Texas.
In terms of political decision making, the Liberal Reformers believed that the common people were often unfit to rule; as such, they wanted to raise voting qualifications and favored the rich, educated, and wellborn as government leaders. Hofstadter describes them as:
the old gentry, the merchants of long standing, the small manufacturers, the established professional men, the civic leaders of an earlier era … the old-family, college-educated class that had deep ancestral roots in local communities and often owned family businesses, that had traditions of political leadership, belonged to the patriotic societies and the best clubs, staffed the governing boards of philanthropic and cultural institutions, and led the movements for civic betterment.31
Hosfstadter, Age, p. 137.
These Liberal Reformers generally lived in urban areas, in the Northeast and Midwest. They normally attended private secondary schools and prestigious colleges and universities. They were typically wealthy, often inheriting their wealth and maintaining it via trades such as banking or the law, and were less likely to have fought in the Civil War, both because they could afford to buy their way out and because they were tied through their financial and business activities to the economy of the South. Coming from a higher social status, they were less likely to have moved from their home state, having an established network on which they could build their careers. Few industrialists would fit the bill; in fact, the “newly rich, the grandiosely or corruptly rich, the masters of great corporations” were the source of Mugwump dismay.32
Ibid.
Politics during the Grant Administration stoked the ire of the Liberal Reformers, in part because there was more money and power over which to fight. They believed the Republicans under Grant abused patronage, filling civil service positions with unqualified friends rather than skilled administrators; propped up illegitimate carpetbag and scalawag governments in the Reconstructed South, while denying the vote to many leading white Southerners; and tied themselves too closely to the emerging “Lords of Industry,” subsidizing the “robber barons” and opening up the party to frequent opportunities for vice. The Liberal Reformers quickly cited the Salary Grab as yet another example of the Republicans' moral decline and corruption.33
Torok, Politics, p. 292.
The Liberal Reformers developed a fairly straightforward agenda with simple solutions to governmental problems. As John Sproat notes: “For the abuses that offended them they proposed the simple remedies of ‘good government,’ economic orthodoxy, and moral rejuvenation. Put ‘good men’ into positions of responsibility and power, they urged.”34
Sproat, Best Men, p. 6.
Despite their failure to spark a “reform revolution” in 1872, the Liberal Reformers made inroads in the public consciousness, thanks in part to a growing list of liberal newspaper editors of the time, such as E. L. Godkin of the Nation, George William Curtis of Harper's Weekly, George Eliot Norton of the North American Review, Horace White of the Chicago Tribune, and Murat Halstead of the Cincinnati Commercial. Under these liberal editors, charges of graft and corruption in local, state, and national politics became almost ubiquitous, resulting in a growing public distrust of government and ever louder calls for reform.35
At this time, newspapers were heavily partisan and ideologically biased in their coverage of persons and events. Between 1870 and 1920, as corruption in government declined, the press became less partisan (and ideological) and more informative. For an overview of the rise of the informative press, see Gentzkow, Glaeser, and Goldin, “Rise.”
Republican Stalwarts were typically the targets of the Liberal Reformers' attacks, and Benjamin Butler and Matthew Carpenter, the leaders of the Salary Grab in the House and Senate, respectively, took much of the heat due to their general willingness to provide public justification for their positions. Butler, in particular, was viewed as “earthy, Anglophobic, egalitarian, combative, unimpressed by their assertions of noblesse oblige, and possessed of a vast popular following which the [Liberal Reformers] regarded as unscrupulously obtained and properly their own.”36
Thompson, “Ben Butler,” p. 167. See Mallam, Butlerism, for a description of Butler's political machine.
Sproat, Best Men, pp. 48–49.
Prior to entering the military, Butler was a successful criminal defense lawyer. He had a keen understanding of the law and of the rules of Congress, which allowed him to shepherd the Salary Grab bill through the House against considerable opposition. During the Civil War, Butler used his political influence to obtain his general's stars, and he infamously commanded the occupation of New Orleans for eight months. Hearn summarizes Butler's class politics in New Orleans:
Secessionists among the upper class bitterly resented him … The elite and the literate, accustomed to having their way, attempted to use their wealth and influence to destroy the general … The huge, illiterate majority—the poorer classes of blacks and whites—would have starved had Butler not fed and employed them, and thousands may have died had his sanitation policies not cleansed the city of disease. For many years after the war the poor continued to praise him, but all the admirable aspects of Butler's administration were clouded by constant accusations of rampant corruption.38
Hearn, When the Devil, p. 4.
Butler described his political philosophy in the following way:
As to the powers and duties of the government of the United States, I am a Hamiltonian Federalist. As to the rights and privileges of the citizens, I am a Jeffersonian Democrat. I hold that the full and only end of government is to care for the people in their rights and liberties, and that that they have the right and privilege to call on either the State or the United States, or both, to protect them in equality of powers, equality of rights, equality of privileges, and equality of burdens under the law, by carefully and energetically enforced provisions of equal laws justly applicable to every citizen.39
Quoted in Nash, Stormy Petrel, p. 18
Although he changed his positions and “political stripes” quite frequently—switching parties six times during his career—Butler's sympathies were always with the common man, supporting equal rights for blacks, prolabor legislation, inflationary measures, and women's suffrage.
Matthew Carpenter shared many of Butler's political views, and was also a skilled tactician and accomplished debater. Although his political machine was not as extensive as Butler's, Carpenter was the more famous lawyer, having argued a total of 97 cases before the Supreme Court. Carpenter switched parties during the Civil War, but he always remained a Jeffersonian Democrat in his inclinations. He was not a populist champion, but his politics included women's suffrage, a narrow interpretation of the Constitution, regulation of railroads and monopolies, coeducation of blacks and whites, Chinese rights, and—when he thought it was what his constituents desired—inflationary monetary policies.40
Thompson, Matthew Hale Carpenter.
Selection and Incentives
Three arguments concerning the shape and actions of Congress were made during the debates over the Salary Grab. The first two concerned the shape of Congress, whereas the third concerned the incentives of members.41
The selection arguments generally divided the Liberal Reformers and the Stalwarts, but the dividing line was by no means clean. For instance, House, “Speakership,” argues that Michael Kerr (D-IN) defeated Samuel Randall (D-PA) in the election for House Speaker in 1875 in part because Kerr voted against the Salary Grab while Randall voted for it.
The first argument was that higher salaries would induce individuals to enter Congress simply for the monetary benefit. That is, rather than encouraging individuals to serve out of a sense of noblesse oblige, raising salaries would attract candidates with more pecuniary motives. George Frisbie Hoar (R-MA), Butler's leading opponent in the House, argued that a generous compensation package was not necessary for public servants:
I have been long of the opinion there are some classes of public servants which must derive compensation from conscientious discharge of public duty. There is a difference between the salary and the work. The judge, the clergyman, the teacher, the legislator, after you have reached the limits of a simple frugal livelihood, every increase in compensation makes the office an object of desire to men who seek it for that compensation mostly.42
Congressional Globe, 42–3, 24 February 1873, p. 1676.
Justin Morrill (R-VT) argued similarly that, “When it shall degenerate to this, that men come here to obtain a higher compensation than they can secure at home, it seems to me that the service that will be rendered will be unlikely to bear a favorable comparison with the past.”43
Congressional Globe, 42–3, 1 March 1873, p. 2049.
Congressional Globe, 42–3, 3 March 1873, p. 2180.
The second argument concerning the shape of Congress was that low salaries only allowed rich men to serve. Raising salaries, from this perspective, was democratic; it would increase opportunities by allowing poor but qualified men to serve in Congress. It would also compensate those men with a higher opportunity cost of their time. Carpenter pushed this line of argument most forcefully:
The real question is whether poor men shall be allowed to participate in the administration of the Government. Rich men are all opposed to increasing salaries. That is after their kind. They would abolish salaries altogether if they could, and then only rich men could hold the offices. They would be quite willing to take and administer this Government, make its laws, fill the bench, and take care of the people without a cent of salary. Take a Senator worth his million or two, what does he care whether the pay of a Senator is five or ten thousand dollars. The difference would not make a ripple on his bank account; but it would settle the question with a poor man whether he could be a Senator or not … [T]o pass a law saying no man shall be a judge or a Senator unless he has property yielding an income of five or ten thousand dollars a year, would cause a revolution. But what is the difference between such a law and one fixing the salaries of all these offices so low that a man cannot hold the office unless he has a private fortune? … Increase the pay of members of Congress so as to pay the reasonable expense of living and a fair compensation for the labor we perform and you open Congress to brains. Reduce the pay and you open it to men of wealth. Men will fill these seats not for what they are, but for what they have.45
Congressional Globe, 42–3, 1 March 1873, p. 2045.
James Nye (R-NV), Thomas Bayard (D-DE), and Nathaniel Banks (R-MA) echoed the argument that low salaries would allow only rich men to serve in Congress. Carpenter acknowledged that a poor man could run for Congress and live in Washington, but he argued that the inability to live in a way that the rich do would marginalize the poor.
[W]e “white trash” must live on a scale entirely below the nabobs of the Senate. Well, Mr. President, it does not require any genius to see and know that if you make these discriminations in social life, of necessity you force just such discrimination upon the influence of men in this body. There is great sublimity undoubtedly in the idea of rising above all the accidents of human nature, looking at things in the abstract, and regarding a man dressed in goat skins precisely as one dressed like a gentleman; but unfortunately the sentiment is not respected in practical life.46
Congressional Globe, 42–3, 3 March 1873, p. 2181.
Butler, like Carpenter, repeatedly used class-based arguments, often making reference to a member's familial burdens and quality of life. To Butler, a member of Congress “ought to live as he does at home and receive enough to pay his family expenses and to educate his children. Now, that cannot be done on less than $7,500. I am certain every man here ought to have his living expense, and that is my experience of the cost of living here.”47
Congressional Globe, 42–3, 24 February 1873, p. 1676.
The third and final argument concerned the actions of members once elected. Supporters of the pay raise portrayed it as a reform measure, something that would change the actions of members by acting as an “efficiency wage,” to combat the many outside lures of corruption. Carpenter led the way again in the Senate, reciting from the Lord's Prayer:
I tell you, Mr. President, that [raising salaries] is the true reformation for our service; that this would reform it and cure the abuses. “Lead us not into temptation” is our prayer. “Lead us not into temptation” should be the end which our laws should have in view; and members of Congress, members of the cabinet, everybody who serves this great people should be compensated for such service.48
Congressional Globe, 42–3, 3 March 1873, p. 2181.
Samuel Randall (D-PA) echoed Carpenter's logic, arguing that “if you will put members of Congress beyond temptation by giving them an adequate salary, you will pass fewer subsidy bills.”49
Congressional Globe, 42–3, 1 March 1873, p. 2051.
Congressional Globe, 42–3, 3 March 1873, p. 2103.
Congressional Globe, 42–3, 1 March 1873, p. 2048.
Hypotheses
We contend that the congressional pay raise was part of an ongoing ideological battle over access to political power. If the Salary Grab truly tapped into ideological divisions, we would expect to see evidence of this in congressional voting patterns in the 42nd Congress. For example, we should observe a correlation between voting on the Salary Grab and voting on similar issues of ideological disagreement. To explore this, we compare the vote on the Salary Grab with votes on civil service reform and the abolition of the franking privilege. In addition, we expect that the personal characteristics of members played a significant role in how they voted. Specifically, members with characteristics associated with the Liberal Reformers should be more likely to vote against the Salary Grab.
CIVIL SERVICE REFORM AND FRANKING
To make the case that a battle over “who should govern” emerged in the 42nd Congress, we move beyond a narrow examination of the Salary Grab and pursue evidence that the “access to power” rhetoric was used on other, similar issues. Examining the proceedings of the 42nd Congress, we find several issues on the legislative agenda that could be characterized as “reform” measures and also had an impact on who could serve in government. This section examines two such measures, civil service reform and the elimination of franking, and provides evidence that congressional voting on these issues and the Salary Grab were correlated.
Civil Service Reform
On the last day of the 41st Congress, Congress passed a bill giving the President the power to form a civil service commission. In June 1871 Grant appointed such a commission. Ari Hoogenboom describes the early proponents of civil service reform as elite New Englanders.52
Civil service reformers are described in the same way as the Liberal Reformers: “Most of them were lawyers, editors, clergymen, professors, and businessmen whose interests were mercantile and financial rather than industrial. The typical reformer came from an old-established New England family and was a descendant of merchants, clergymen, and public servants. He inherited wealth and consequently deplored the crass materialism of the new rich whose prominence, based on vast fortunes, eclipsed his own. The typical reformer was either an Episcopalian or a Unitarian and was a Harvard graduate.” Hoogenboom, Outlawing the Spoils, p. 20.
In the Senate, Carpenter's main defense of the patronage system rested on its constitutionality, but he also made class-based arguments similar to the ones he used in support of the salary increase. He attacked the use of competitive exams as a means of selecting civil servants, arguing that “reform” would replace the current political appointee, who was often a successful entrepreneur and had an understanding of business and practical knowledge of the world, with “the dunce who has been crammed up to a diploma at Yale.” By adopting civil service reform, the entrepreneurs “are all to be disenfranchised. Energy, activity, perseverance, integrity, all the qualities that have secured their success in their own paths of life, are to be put aside if they happen to lack those early advantages which only the sons of the rich can enjoy.”53
Congressional Globe, Appendix, 42-2, 18 January 1872, p. 458.
In the House, Butler led the charge against civil service reform. His arguments focused on logical flaws in the proposed reforms and the strengths of the current patronage-based system. Two opportunities to vote on civil service reform emerged in the 42nd House. The first was an amendment (RC 246) introduced by Butler to cut expenditures on the Civil Service Commission from $50,000 to $10,000. Passage of the amendment would effectively emasculate the commission, as it would possess far fewer resources to develop a reform agenda. It passed 115–59, Republicans voting 66–47 and Democrats voting 49–12.54
Congressional Globe, 42-2, 12 April 1872, p. 2398.
More specifically, the crux of RC 252 was to recommit H.R. 787, a bill providing for the independence of the several departments of the government, without instructions. In legislative parlance, a motion to recommit without instructions is a not-so-veiled attempt to kill a bill.
Congressional Globe, 42-2, 19 April 1872, p. 2585.
Because Liberal Reformers generated the initial impetus for civil service reform and Stalwarts opposed it, comparing vote choices on the congressional salary increase and civil service reform should provide some insight as to whether these factions were consistently at odds in the 42nd Congress. If our hypothesis is correct, we would expect there to be similar voting patterns, particularly among Republicans. Democrats, on the other hand, may have been motivated to vote for civil service reform for pragmatic reasons, as they were the “out party” and thus not receiving federal patronage to distribute. By supporting civil service reform, they may have felt that they could weaken the Republicans' stranglehold on government.
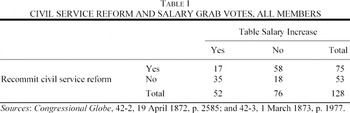
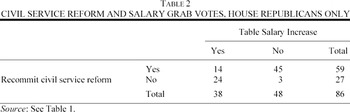
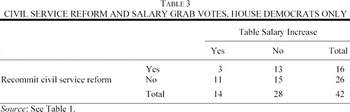
The results are shown in Tables 1–3. We compare the votes of members who voted on both the motion to recommit civil service reform (RC 252) and the motion to table the congressional salary increase (RC 508).


As shown in Table 1, of the 128 members who voted on both measures 93 (73 percent) switched their votes between civil service reform and the salary increase. Breaking this result down by party, 24 of the 42 Democrats (57 percent) and 69 of the 86 Republicans (80 percent) switched their votes between the two measures. This pattern of voting indicates that, particularly for Republicans, the salary increase and civil service reform were viewed as similar issues. Both issues influenced the balance of power at the federal level by altering the pool of potential legislators and administrators. Reformers, or those who wished to change the status quo, voted “yea” on the motion to table to the salary increase and “nay” on the motion to recommit civil service reform. Stalwarts, or those who wanted to maintain the status quo, voted “nay” on the motion to table the salary increase and “yea” on the motion to recommit civil service reform.
Franking
The franking privilege was another issue that led to accusations of corruption and was legislated on in the 42nd Congress. Franking allowed members of Congress to “inform their constituents” by sending material through the mail free of charge. The abuses of the franking privilege were criticized frequently, earning special notice by Mark Twain and Charles Warner in a story told by Hicks to Colonel Sellers:
Well Senator Balloon put fifteen cents worth of stamps on each of those seven huge boxes of old clothes, and shipped that ton of second-hand rubbish, old boots and pantaloons and what not through the mails as registered matter! It was an ingenious thing and it had a genuine touch of humor about it, too. I think there is more real talent among our public men of today than there was among those of old times—a far more fertile fancy, a much happier ingenuity. Now, Colonel, can you picture Jefferson, or Washington or John Adams franking their wardrobes through the mails and adding the facetious idea of making the government responsible for the cargo for the sum of one dollar and five cents? Statesmen were dull creatures in those days. I have a much greater admiration for Senator Balloon.57
Twain and Warner, “Gilded Age,” p. 261. According to French, Mark Twain, p. 135, Senator Balloon was modeled after James Nye (R-NV).
Although this story may have been an exaggeration, similar rumors—such as the member who sent his horse home through the mail—abounded, and claims of franking abuses captured the public interest.58
Additional “franked” items discussed in news coverage of the time included flower pots, plants, shrubs, and bouquets from the Congressional Public Gardens. Townsend, Washington, pp. 510–12.
[a] few of the wealthiest newspaper establishments in the country, who maintain correspondents here, will have it in their power to break any man, and to create just such public sentiment on any question as may promote their interest; and a system of favoritism and corruption will thus be inaugurated which will paralyze independent, individual action in Congress, and mislead the public mind, whenever it is for the interest of a few to do so.
Carpenter continued with his now-familiar attack on privilege, arguing that the elimination of franking would favor certain members of Congress and disempower others: “It is true, that a Senator who possesses wealth may set himself right with his constituents; but all others must fold their hands and submit to their fate.”59
Congressional Globe, 41-2, 15 June 1870, pp. 502–03.
Butler took up Carpenter's argument early in the 42nd Congress, arguing that the “metropolitan press” sought to end franking so that it could “crush down every local newspaper that now goes free.”60
Congressional Globe, 42-2, 2 April 1872, p. 458.
Congressional Globe, 42–3, 27 January 1873, p. 93. This “victory for reform” would prove to be fleeting. The franking privilege was partially reinstituted in the 43rd Congress, and gradually broadened until it was fully reinstituted in the 51st Congress. See Pontius, “Franking.”
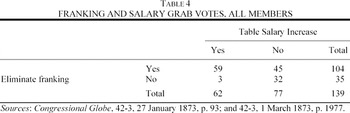
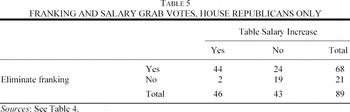
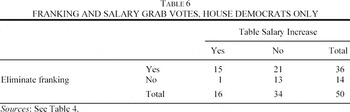
Tables 4–6 provide a comparison of the votes of members who voted on both the motion to eliminate the franking privilege (RC 423) and the motion to table the Salary Grab (RC 508).


As shown in Table 4, of the 62 members who voted on both measures and supported tabling the salary increase, only three—two Republicans and one Democrat—opposed eliminating franking. Breaking the results down by party, as shown in Tables 5 and 6, it initially appears that Democrats and Republicans voted similarly on the two issues. However, looking closer, we find that Republicans who voted to eliminate franking were almost twice as likely to support tabling the salary increase, whereas those Democrats who voted to eliminate franking were more likely to oppose tabling the salary increase. The Republican result reveals a core group of liberal reformers in that party. This vote comparison, like the vote on civil service reform, indicates that two opposing groups battled over “reform” issues. Those issues affected who could serve in the federal government either as a member of Congress or as a civil servant.
REGRESSION ANALYSES OF THE SALARY GRAB
In this section, we pursue a more systematic set of analyses in our search for coalitions battling over the issue of “who should govern” in the 42nd House. In the regressions that follow, we incorporate several explanatory variables. To isolate traits that distinguish between Liberal Reformers and Stalwarts, we include measures of education, wealth, military service, and whether the member of Congress represented his birth state. Education ranges from zero to three and is equal to secondary + college, where secondary takes on the value of one if the member went to a private secondary school and zero otherwise, while college takes on the value of zero for no college, two if the college was either Ivy League or had a Phi Beta Kappa chapter, and one otherwise. Wealth measures a member's real and personal wealth as reported in the 1870 Census.62
Joseph Ferrie supplied us with the majority of the observations on wealth from the 1870 Census. Those members of Congress who had no wealth reported were keyed in as a zero if wealth was reported for any other individual on that Census page. The observation was dropped if wealth was not reported for any other individual on that Census page. In this, we followed the suggestion of Ferrie. We supplemented the data from Ferrie with additional Census data assembled by Terry Seip. For more on the latter, see Seip, South.
New England thus represents the omitted category.
We predict that members with greater levels of elite education are more likely to vote against the Salary Grab. Education level should capture an important trait associated with the Liberal Reformers. We also predict that members with greater wealth will vote against the Grab. Two separate factors might drive this prediction: members with greater wealth may have a lower marginal utility of money; and members with greater wealth were more likely to be members of the “elite” class and thus would want to shape the membership of Congress by keeping salaries low. The importance of the second factor is diminished because opponents of the Liberal Reformers often had quite a bit of wealth. (That wealth, however, was not inherited; our ideal measure, therefore, would be inherited wealth, which is unavailable). We also predict that members with a military background and those who have moved away from their home states would be less likely to be among the elite class of reformers.
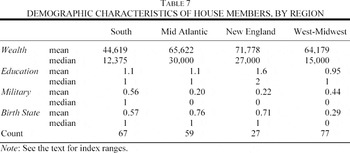
Conflated slightly with the measures of wealth, education, military experience, and birth state is region. The reformer sentiment originated in New England and the Midwest, regions from which members were considerably wealthier relative to members from the South. This is illustrated in Table 7.

At the same time, New Englanders and Midwesterners did not form a single, homogeneous group. New Englanders were more likely to have an elite education than members from any other region. Midwesterners were roughly twice as likely as New Englanders to have served in the military and to have moved away from their state of birth.64
Another difference between New England and the Midwest was the existence of strong third-party agrarian movements in the Midwest. Although McGuire, “Economic Causes,” ties the rise of agrarian unrest to rising agricultural uncertainty, the Patrons of Husbandry, which rose to its peak in the mid 1870s, also pushed a clean government platform. For the political platform of the Grange, see Sanders, Roots, pp. 105–08. We test for the impact of this agrarian movement on Salary Grab voting by including the number of Granges per 100,000 agricultural population in 1875 as an explanatory variable in our regression. Because the coefficient does not have the predicted sign; is not statistically significant; and does not affect the coefficients on our other variables, we choose not to report the results here.
In contrast to the reformers, the advocates of maintaining the status quo—the patronage-based party politics of the time—resided mainly in the Mid Atlantic and South. This Mid-Atlantic/South coalition traced its origins back to the early days of the republic, when an interregional coalition, centered on a New York-Virginia alliance, was built to control national politics. This Mid-Atlantic/South alliance grew stronger over time, reaching maturation during the Democrat-Whig battles of the 1830s and 1840s. And although members from these regions were fairly heterogeneous—those from the Mid Atlantic having considerable wealth, and those from the South having considerable military experience, for example—their careers were based on a common “investment” in the conventions of nineteenth-century machine politics. Thus, we predict that members from the Mid Atlantic and South would likely fight efforts to reform the nature of the governing structure.
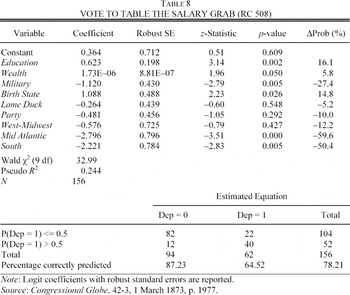
A total of eight Salary Grab votes were recorded in the 42nd House. The regression results for all eight reveal similar voting patterns, so for our regression analysis we chose RC 508, the motion to table the Salary Grab—a key procedural vote—which was defeated 66–105.65
We ran an additional seven regressions using the same independent variables as in Table 8. In all cases, the regression coefficients have the expected sign. The coefficients on our variables vary in their “significance” across the regressions. At the 10 percent confidence level we found significant coefficients on: Education in five regressions; Wealth in one regression; Birth State in six regressions; and Military in all seven regressions. We also created an index of all Salary Grab votes, ran the same econometric model, and uncovered similar results. In short, the estimates for the RC 508 analysis are robust.

Our measures of elite interests—wealth, education, military experience, and state of birth—all have the predicted signs and matter.66
Members voting to table the motion had twice as much wealth on average as those voting to sustain it.
To understand the economic importance of our measures we constructed a baseline probability of voting to table (kill) the Salary Grab. For our initial baseline we set wealth equal to the mean of all members of Congress, the education variable equal to 1, and the dummy variables for a non-lame-duck Northeastern Republican who has no military service and does not represent his state of birth.67
The mean of the wealth variable is $73,585, and its standard deviation is $196,585.
Poole and Rosenthal, “Patterns” and Congress, provide further evidence that the Salary Grab was not a party issue through their two-dimensional NOMINATE mapping of congressional voting. Across time, on a Congress-by-Congress basis, NOMINATE uncovers a single underlying dimension, which typically divides along party lines, that explains roughly 80 to 85 percent of individual roll-call vote choices. A second NOMINATE dimension typically explains additional variance by measuring cross-cutting cleavages, i.e., issues that divide the parties. For the eight Salary Grab votes, the first dimension provides virtually no explanatory power; however, all eight are among the top ten most-important second dimension votes.
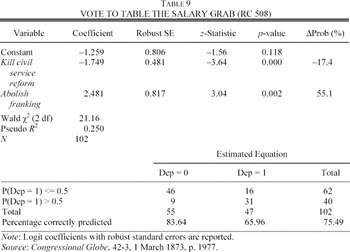
We also estimated the probability of tabling the Salary Grab (RC 508) using the roll calls on killing civil service reform (RC 252) and abolishing franking (RC 423) as explanatory variables. The results of this logit regression are reported in Table 9.

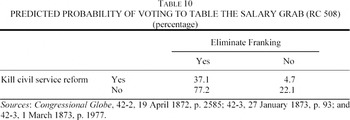
As these results indicate, members' vote choices on the motions to kill civil service reform and abolish franking do an excellent job of predicting their vote choices to table the Salary Grab: voting to kill civil service lowers the probability of voting to table the Salary Grab, while voting to abolish franking increases the probability of voting to table the Salary Grab. In Table 10, we estimate the predicted probability of voting to table the Salary Grab, contingent on voting on the motions to kill civil service reform and abolish franking.

If a member voted to preserve franking and kill civil service reform, there was a predicted 4.7 percent probability that he would vote to table (kill) the Salary Grab. Whereas, if a member voted to eliminate franking and preserve civil service reform, there was a predicted 77.2 percent probability that he would vote to table (kill) the Salary Grab. These results support our argument that a consistent ideological “current” permeated vote choice in the 42nd Congress, that is, opposing the Salary Grab, supporting civil service reform, and supporting the elimination of franking went hand-in-hand-in-hand as measures affecting “who should govern.”
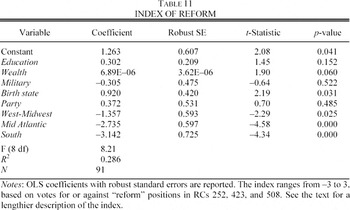
Finally, we examine whether our covariates pick up a consistent pattern of voting on all three issues affecting governance and the access to power. We attempt to capture a systematic ideology by creating an index that ranges from −3 to 3. To be included in the index, a member had to have voted on all three measures. A member received a 1 for each vote in favor of “reform”—opposing the Salary Grab, supporting civil service reform, and supporting the abolition of franking—and a −1 for each vote against “reform.” Table 11 reports the results from an OLS regression, using the same independent variables as in Table 8.69
The only exception is the lame duck variable, which is not included because the vote on civil service reform occurred in the “regular” session of Congress, not in the “lame duck” session. Thus, including a lame duck variable would lead to measurement error in the estimation. We also ran an ordered logit using the same variables as in Table 11. We obtained similar results.

As in the Salary Grab estimation, we find evidence that wealth, birth state, and region (West-Midwest, Mid Atlantic, and South) mattered for voting across the three “reform” issues. Education is also in the expected direction, but the coefficient is weaker in reliability.70
We also ran a separate regression on all members who voted on at least two of the three measures (N = 183). The results were similar, with only the West-Midwest variable losing statistical significance.
In terms of our regression analyses overall, we find substantial statistical evidence that a battle over “who should govern” occurred in the 42nd Congress. A group of members who believed strongly that Congress and the federal government ought to be run by the “best men” coalesced around a set of issues such as opposition to the Salary Grab, the abolition of franking, and the furtherance of a merit-based civil service. Our measures roughly capture this movement, but they are clearly not perfect. For example, Butler, the ultimate opportunist who sponsored the Salary Grab, was from New England, college educated, and one of the wealthiest members of Congress. In short, creating a strong proxy for Liberal Reformers is difficult. Nevertheless, we find a strong connection between wealth, education, military service, and birth state and support for measures that influenced access to power in congressional voting.
DISCUSSION
In this article, we argued that a reform coalition emerged in the 42nd Congress, responding to the growing public unease surrounding charges of graft and corruption associated with the Grant Administration. The reformers, composed of New England and Midwestern elites, believed that the patronage-based machine politics that came to dominate the Republican Party after the Civil War were unacceptable. These reformers supported a philosophy of “good government” wherein the “best men” would comprise public servants, specifically men from privileged backgrounds who would act selflessly, strive for efficiency, and promote the greater good. Growing weary of the Republican Party, the liberal reformers attempted to start their own party, the Liberal Republican Party, to challenge Grant and his associates in 1872. This proved to be a failure, however, as the liberals found it difficult to organize effectively, and Grant was reelected by a sizeable margin.
Yet, this liberal reform wave produced indirect benefits. First, a public awareness for “reform” was created, thanks in part to the growth of a liberal group of editorialists and media outlets after the Civil War. As charges of graft and corruption emerged as “good media copy,” constituent monitoring of public officials increased, and politicians responded by (occasionally) toning down their antics. Second, the liberal reformers were successful in placing “reform” on the political agenda. Although the 1872 campaign indicated that issues involving access to power, by themselves, could not drive the political process, they could help define the terms of partisan debate. In effect, the liberal reformers were able to get “reform” a place at the partisan table, not only within the Republican Party but within the Democratic Party as well. For example, the Democrats tried to take advantage of the corruption charges surrounding Grant's Administration by nominating Samuel Tilden (NY) for president in 1876, in large part because of his successful dismantling of the Tweed Ring while serving as Chairman of the New York Democratic Party.71
For a discussion of the Tweed Ring and Tilden's role as prosecutor, see Ackerman, Boss Tweed.
This “good government” coalition lived on, not as a separate political organization, but as an ideological movement. By creating a political consciousness for reform, the New England and Midwestern elites ensured that issues aimed at reducing the power of urban-based party machines would remain on the political agenda, even if their initial coalition did not survive. And this is exactly what occurred. As detailed earlier, while the Salary Grab was rescinded in the 43rd Congress, the franking privilege was reinstituted and civil service reform stalled. Yet, pressure for reform continued, and eventually a significant restructuring of the civil service system (the Pendleton Act) passed in 1883, and the first independent federal agency, the Interstate Commerce Commission, was created in 1887.72
Hayes made small steps toward dismantling partisan machine politics by regaining control over executive-based patronage appointments, which during the previous two decades had become controlled by powerful Senators in the Republican Party. Hayes took on the machine in New York State and scored successful victories. Garfield followed in Hayes's footsteps by effectively destroying the Stalwart wing of the Republican Party and working toward a system of merit-based patronage. But the biggest boost for civil service reform came with Garfield's assassination by a disgruntled office seeker. This was the leverage reformers needed to spur Congress to pass the Pendleton Act in 1883. See Morgan, From Hayes, for a detailed discussion.
See Fredman, Australian Ballot.
By the first decade of the twentieth century, a full-blown reform movement was underway—extending far beyond the initial antiparty reforms of the 1870s—led by the strong voice of President Theodore Roosevelt; this reform momentum would continue through the 1910s, with Roosevelt's mantle picked up by President Woodrow Wilson. For example, in addition to social reforms, such as the Pure Food and Drug Act (1906), the Child Labor Act (1916), and the Adamson Act (1918), which established the eight-hour workday, the new Progressive Era produced political reforms such as congressional primaries (early 1910s), the direct election of Senators (1913), and the extension of suffrage to women (1920). Over time, “reform” initiatives switched from being Republican initiatives—as the Republicans retrenched behind conservative candidates such as William Howard Taft, Warren Harding, and Calvin Coolidge—to becoming one of the hallmarks of the Democratic Party, culminating in the New Deal agenda of Franklin D. Roosevelt.
Our contention is that the political reforms in the late nineteenth century and the rise of Progressive Era politics in the early twentieth century trace their origins to the liberal reform efforts of the early 1870s. Although this movement failed initially in creating a true “reform party,” and had minimal success in expediting a broad reform agenda at the congressional level over “who should govern,” its emergence and perseverance put reform on the political map. In identifying the rise of the Liberal Reformers—the civic-minded elites of New England and the Midwest—and their connection to the Progressive movement, we also take the first step in a broader research agenda aimed at understanding the variety of interests that emerged to promote various “flavors” of reform during the Progressive Era. The terms “progressive” and “reform” meant different things to different groups at different points in time during the half-century spanning 1870 to 1920. This complexity often gets overlooked or glossed over in historical studies of Progressivism. To truly understand how the Progressive Era developed, we argue that the key interests and their policy agendas throughout the late nineteenth and early twentieth centuries must be carefully and clearly identified; only by doing so can we claim to have a firm grasp on the antecedents and evolution of Progressivism in the United States.
Kara Gorski was involved with the initial stages of the research project and we thank her for her insights. For helpful comments, we thank Jeremy Atack (Co-Editor of this JOURNAL), Joseph Ferrie, Brian Gaines, Claudia Goldin, Robert Margo, Robert McGuire, Jason Roberts, Werner Troesken, John Wallis, participants at the 2005 Economic History Association Annual Meeting and two NBER workshops, and two anonymous referees. For research assistance we thank Clayton Reck, and for assistance with assembling data on wealth, we thank Joseph Ferrie and Terry Seip.