Francis Fukuyama (Reference Fukuyama2013, 350) notes that governance quality reflects the extent to which administrative actors can execute the policy goals of their political principals. Bureaucratic capacity, which can be thought of as the bureaucracy’s ability to accomplish intended actions (Huber and McCarty Reference Huber and McCarty2004, 481), serves as a critical ingredient for understanding why public agencies become less effective at facilitating the conversion of politicians’ policy objectives into policy outcomes (Krause and Woods Reference Krause and Woods2014). Yet, little is known regarding how bureaucratic capacity affects the conversion of politicians’ policy objectives into policy outcomes. Addressing this issue can offer insight into how institutional arrangements translate government policies into policy outcomes consistent with the aims of political institutions.
It is firmly accepted that executive agency heads in the American states play a vital role in shaping public policies (e.g. Schneider et al. Reference Schneider, Jacoby and Coggburn1997; Bowling and Wright Reference Bowling and Wright1998, 431; Brudney and Wright Reference Brudney and Wright2010; Boushey and McGrath Reference Boushey and McGrath2017). In this study, we argue that when agency heads are not highly capable, political institutions find it difficult to coordinate their policy intentions through layers of the administrative state and, thus, considerable slippage may exist between politicians’ policy objectives and actual policy outcomes. Highly capable bureaucratic leaders thus represent a necessary, albeit not sufficient, condition that offers politicians their best hope of attaining their policy goals.
Specifically, we argue that highly capable bureaucratic leaders (termed henceforth as bureaucratic leadership capacity) are well positioned to convert politicians’ policy objectives into policy outcomes in the presence of unified partisan political institutions since public agencies obtain greater delegated authority (e.g. Epstein and O’Halloran Reference Epstein and O’Halloran1999), and also obtain coherent direction for the purpose of achieving their common policy goals (e.g. Hammond and Knott Reference Hammond and Knott1996; Miller and Whitford Reference Miller and Whitford2016, 167). Administrative institutions led by capable agency heads can attain policy outcomes that more closely reflect the wishes of unified partisan governments since they will be both empowered and capable of successfully exercising delegated authority for achieving the policy goals of political institutions.
To test this thesis, we analyse a policy outcome generally understood that politicians have clear policy differences among partisan lines, but the evidence is mixed with respect to observable policy outcomes – income variations among affluent citizens. It is generally believed that left-wing (Democratic) parties are pro-labour income and thus prefer outcomes limiting the incomes of the most affluent, while right-wing parties (Republicans) are pro-capital income and instead prefer outcomes that do not restrict the incomes of the most affluent. Yet, the evidence that particular parties actually shape the incomes of the most affluent American citizens is decidedly mixed (Bartels Reference Bartels2008; Kelly and Witko Reference Kelly and Witko2012) and around the world (Scheve and Stasavage Reference Scheve and Stasavage2009). Focussing on affluent citizens is important for representation purposes since this subset of the mass public obtains policy outcomes much closer to their policy preferences than for both moderate and low-income citizens in the United States (US) (Gilens Reference Gilens2012).
The data employed to test this thesis are aggregate household income panel data for citizens residing in the top 10% of the income distribution for 49 American states during the 1986–2008 period.Footnote 1 This is both the segment of the population and historical period where income inequality has surged most during the postwar era in the US (e.g. Piketty and Saez Reference Piketty and Saez2003; Sommeiller and Price Reference Sommeiller and Price2014), as well as around the world (e.g. Piketty and Saez Reference Piketty and Saez2006; Leigh Reference Leigh2007; Atkinson and Piketty Reference Atkinson and Piketty2010). The American states offer a suitable empirical setting to analyse the importance of bureaucratic leadership capacity on policy outcomes given longstanding efforts at federal policy-making devolution (Conlan Reference Conlan1998), heightened interstate policy competition (Eisinger Reference Eisinger1988; Dye Reference Dye1990) and fiscal decentralisation (Mikesell Reference Mikesell2007; US Government Accountability Office 2010, 28–30). State governments also confront strong incentives for acquiring greater administrative expertise in response to eroding legislative professionalism (Boushey and McGrath Reference Boushey and McGrath2017), coupled with fiscal constraints that place greater pressure on state government agencies to both provide and administer public policies (Stark Reference Stark2010, 961–962). Accordingly, constitutional law scholar Miriam Seifter (Reference Seifter2018, 111–112, 128–134) contends that state executive agencies are the dominant force for enacting policy in modern American governance. The market for capable agency heads has become increasingly competitive, and, thus states must offer competitive salaries (Boushey and McGrath Reference Boushey and McGrath2017).
Our statistical evidence reveals that lower levels of state executive agency head compensation under unified partisan government are associated with income variations for affluent citizens that run directly counter to each party’s preferred policy outcomes. Higher levels of average state executive agency head compensation, however, uncover an asymmetric partisan outcome effect. Unified Republican state governments are associated with income surges for affluent citizens above and beyond a divided partisan government control baseline. Unified Democratic state governments obtain their preferred outcome of declining incomes for affluent citizens as state executive agency head compensation rises but this pattern is restricted only at lower levels of compensation. The normative takeaway from this study is that efforts at dismantling the administrative state by lowering bureaucratic capacity at the top levels of public agencies undermines political institutions’ efforts at furthering their own policy objectives. These consequences are ironically most severe when political institutions are best positioned to convert majoritarian preferences into policy outcomes.
Converting partisan policy objectives into outcomes: the role of bureaucratic leadership
Agency leaders operate on a fulcrum between politics and administration. Thus, the capacity of politicians to realise their policy objectives heavily depends upon the capacity (competence) of their bureaucratic leaders. Because low capacity agency heads can neither successfully cultivate nor utilise any policy-making authority that politicians delegate to them (Huber and McCarty Reference Huber and McCarty2004; Krause and Woods Reference Krause and Woods2014), they confront a chasm between politicians’ policy objectives and just how to administer these policies for the purpose of attaining these preferred policy outcomes. Ceteris paribus, as the capacity of bureaucratic leaders rises, they acquire greater authority from politicians since they are viewed as being both more capable and willing to exercise policy-making authority to serve the policy interests of political principals.
Executive agency heads in the American states are strongly engaged in policymaking with political institutions and external interests, as well as leading their respective agencies in policy implementation.Footnote 2 State agency heads are capable of playing a critical policy-making role that can shape economic outcomes in three complementary ways: (1) policymaking, (2) resource allocation and (3) rulemaking. First, agency heads provide policy expertise when it comes to policy formulation. Survey evidence from the longstanding American State Administrators Project (ASAP) taken during the 1980s, 1990s and 2000s finds that agency heads are consistently ranked the most critical actor for making major policy decisions, ahead of both governors and legislatures (Brudney and Wright Reference Brudney and Wright2010, 29–30). ASAP survey evidence suggests that 50% of the legislation introduced by state governments originates in state agencies, compared to 33% and 10% originating, respectively, in the legislature and the governor’s office (Bowling and Wright Reference Bowling and Wright1998, 436). This pattern coincides with increased lobbying of state agencies conducted by private sector interests (Lowery and Gray Reference Lowery and Gray2001; Seifter Reference Seifter2018, 134–140).
Second, state agency heads play a key role in resource allocation decisions (Bowling and Wright Reference Bowling and Wright1998; Brudney and Wright Reference Brudney and Wright2010). The allocation of these resources can affect the most affluent incomes as state agency heads play a critical role in determining which clientele groups obtain benefits from the those that do not. One mechanism for channelling these resources for the purpose of delivering policy benefits to core constituent groups occurs when state agencies contract out services to third-parties for the provision of state government goods and services (Brudney et al. Reference Brudney, Fernandez, Ryu and Wright2005; Kelleher and Yackee Reference Kelleher and Yackee2009). Approximately 75% of state agencies engage in contracting decisions as a tool of governance (Salamon Reference Salamon2002; Brudney et al. Reference Brudney, Fernandez, Ryu and Wright2005). Contractor recipients represent organised interests that range across key sectors such as local governments, banks, insurance companies, businesses and nonprofit organisations, but to name a handful (Salamon Reference Salamon2002; Kelleher and Yackee Reference Kelleher and Yackee2009).
In addition, state agencies are also responsible for both the distribution and management of large sums of federal aid revenues that affords agency heads considerable policy-making discretion (Brudney and Wright Reference Brudney and Wright2010, 32–33; see also, Cho and Wright Reference Cho and Wright2007). State agencies can also exert influence over income distribution through conferring policy-making benefits to targeted constituent groups through tax expenditures. Langer (Reference Langer2001), for example, shows that state-level demand-side economic policies promoting research and development, technological advances and trade exports produce a more equitable distribution of income in the American states than supply-side policies entailing tax abatements and capital subsidies. These programmes are largely governed by state executive agencies and often fall under the radar of scrutiny from the media and other civil-society oversight institutions, they are uniquely situated to serve their governors and participate in the enactment of these policies (Seifter Reference Seifter2018). In Texas, for instance, the Texas Enterprise Fund which was created in September 2003 to award tax breaks and other financial incentives to large corporations having operations within the state. During the subsequent years, the Republican controlled state government had state agency heads with relatively high levels of compensation administering policy on their behalf. For example, in 2004–2005 the Texas Enterprise Foundation issued grants ranging from $5 million dollars to $38 million dollars to major corporations with highly compensated upper-level executive teams such as Citgo Petroleum Corporation, Triumph Aerostructures, LLC, JP Morgan Chase Bank and Co, Bank of America, Home Depot and Tyson Fresh Meats (Texas State Auditor’s Office (John Keel, CPA, State Auditor) 2014, 66–90). This example illustrates how state governments can facilitate greater wealth for their affluent citizens.
Finally, state agencies can easily rewrite and rescind rules because the press and other nongovernmental institutions do not carefully monitor them (Seifter Reference Seifter2018). Because both proposed and enacted agency rule-making activity is positively associated with state agency head capacity (Boushey and McGrath Reference Boushey and McGrath2017, 97–99), greater bureaucratic leadership capacity corresponds to greater activist policymaking by administrative agencies.
We maintain that state governments offer competitive compensation to state executive agency in order to attract talent. Boushey and McGrath (Reference Boushey and McGrath2017, 91–92) note that compensation yields and, hence, without adequate compensation it will be more difficult to recruit able, quality personnel who are willing to remain in an agency and cultivate expertise (Gailmard and Patty Reference Gailmard and Patty2013), while refraining from more lucrative career options (Teodoro Reference Teodoro2011). The importance of attracting and retaining a professionalised, skilled public sector workforce is embodied in the charters of state political compensation commissions (Boushey and McGrath Reference Boushey and McGrath2017, 90). This is an especially critical issue considering the rapid growth of state agencies in recent decades (Moncrief and Squire Reference Moncrief and Squire2013), coupled with greater centralisation efforts undertaken by governors for harnessing the power of state administration (Seifter Reference Seifter2017).
The importance of the relationship between compensation and robust administrative capacity in state government is a long-standing concern voiced by professional associations representing state administrators focussing on the recruitment and retention of skilled individuals (National Association of State Personnel Executives 2013, 2016). This problem has been exacerbated through time for state executive agency heads since they have the highest turnover, as well as the most attractive outside market opportunities (Bowling and Wright Reference Bowling and Wright1998, 439; Brudney and Wright Reference Brudney and Wright2010). In response to these pressures, Boushey and McGrath (Reference Boushey and McGrath2017, 90–91) chronicle the surge in state executive agency heads’ compensation levels in recent decades.
State executive agency compensation levels serve as a proxy measure for bureaucratic leadership capacity. In turn, this capacity is critical for shaping policy outcomes when a single party controls both the chief executive and legislative branches since administrative agencies obtain greater policy-making authority (e.g. Epstein and O’Halloran Reference Epstein and O’Halloran1999; Volden Reference Volden2002). Conversely, bureaucratic leadership capacity will be less consequential for facilitating political principals’ policy goals during times of divided party government since not only will these institutions offer less coherent guidance to public agencies (Hammond and Knott Reference Hammond and Knott1996; Miller and Whitford Reference Miller and Whitford2016, 167) but also can effectively check one another’s power through a variety of mechanisms ranging from appointments to lawmaking to oversight (e.g. Persson et al. Reference Persson, Roland and Tabellini1997; Acemoglu et al. Reference Acemoglu, Robinson and Torvik2013).
In short, political institutions have the best chance of enacting their most preferred polices when a single party controls state government, conditional on having highly capable bureaucratic agency heads to enact their policy goals. Next, we apply this logic to understanding how alternative political-bureaucratic arrangements across the American states shape the incomes of the most affluent citizens. We begin with a discussion centred on the mixed evidence obtained from analysing partisan income differences at the subnational, national and cross-national levels. We posit that bureaucratic leadership capacity provides a mechanism to understand the precise conditions that enable political parties to attain their preferred policy outcomes over incomes among affluent citizens.
Partisan politics of income distribution: a view from the American states
The tide of rising income inequality observed in recent decades, both in the US and developed democracies around the world, is attributed to the sharp income gains for the most affluent citizens (e.g. Piketty and Saez Reference Piketty and Saez2003, Reference Piketty and Saez2006; Leigh Reference Leigh2007; Scheve and Stasavage Reference Scheve and Stasavage2009; Atkinson and Piketty Reference Atkinson and Piketty2010). In the US, for example, unified partisan control of government by Democrats should empower them to better protect their core constituents comprised of the working class, unions, and robust product and financial market regulations, while Republicans advocate for market deregulation and owners of capital at the expense of labour (e.g. Brady and Leicht Reference Brady and Leicht2008, 80–82; see also, Gelman et al. Reference Gelman, Kenworthy and Su2010, 1203).
These differences in partisan policy preferences lie with a starkly opposed understanding of the relationship between inequality and economic growth. A leading liberal economist, Nobel Laureate Joseph Stiglitz, asserts that “Increasing Inequality means a weaker economy, which means increasing inequality, which means a weaker economy” (Lowery Reference Lowery2012, B1). Conversely, conservative economists such as the Heritage Foundation’s Rea S. Hederman are of the view that “the problem is that the policies that encourage growth also encourage inequality” (Lowery Reference Lowery2012, B1). Partisan differences should be reflected in the distribution of income – most notably, the income of affluent citizens. Partisan differences should be greatest at either end of the income distribution since both parties must compete for the median voter (Meltzer and Richard Reference Meltzer and Richard1981). Converting partisan policy preferences into actual state policies thus requires sufficient institutional control by a single political party (Barrilleaux et al. Reference Barrilleaux, Holbrook and Langer2002).
The statistical evidence, however, is decidedly mixed for whether differences arising from partisan policy preferences are observed in policy outcomes. In the US, partisan control of the executive branch, at the federal or state levels, is associated with reductions or gains in income inequality (e.g. Bartels Reference Bartels2008; Kelly and Witko Reference Kelly and Witko2012), while others contend that the partisan control of legislative institutions is influential for altering the share of income going to the top 1% of the income distribution (Volscho and Kelly Reference Volscho and Kelly2012). Moreover, at the cross-national level, partisan control of the executive branch has a negligible impact on rising incomes for affluent citizens based on cross-national data (Scheve and Stasavage Reference Scheve and Stasavage2009).
Past studies, however, fail to consider the role that bureaucratic leadership capacity plays in facilitating the policy objectives of partisan politicians, as well as the conditions that determine the exercise of administrative expertise. To be more precise, we maintain that the capacity of bureaucratic leaders enables unified partisan majorities to enact their preferred policy outcomes. When a single party controls political institutions, administrative institutions obtain greater authority from political principals and they are also more politically constrained when exercising policy-making authority under these conditions. Applied to the case of affluent citizens’ incomes in the American states, the extent to which partisan-based income differences occur among affluent citizens will be contingent on bureaucratic leadership capacity under unified party government. This logic yields the following testable hypotheses:
H1: Incomes for affluent citizens will be rising (falling) in the presence of unified Republican (Democratic) partisan control of state political institutions as bureaucratic leadership capacity increases.
The empirical implications associated with Hypothesis 1 predict that incomes for affluent citizens will be positively associated with bureaucratic leadership capacity under unified Republican partisan control of state political institutions, while inversely associated with bureaucratic leadership capacity under unified Democratic partisan control of state political institutions. This logic presumes that political institutions can leverage state agencies to advocate partisan policy platforms on their behalf as maintained by Seifter (Reference Seifter2017, 486, 536), and that the effectiveness of such efforts is contingent upon the capacity of bureaucratic leaders.
Research design, data and econometric methods
These hypotheses are tested using panel data on the average state-level real adjusted real gross income (ARGI) reported on US Internal Revenue Service (IRS) tax returns within a given income fractile group among the top decile of the income distribution covering 1986–2008 (Sommeiller and Price Reference Sommeiller and Price2014).Footnote 3 These data best capture the underlying source of economic inequality in the US and around the world – affluent citizens in the top decile of the income distribution.Footnote 4 These measures constitute the prefiscal redistribution market income since personal current transfer receipts are excluded, capital income is included and modest upward adjustments are made for income deductions relating to various personal individual contributions to pensions and retirement plans, health saving accounts, plus moving expenses (Sommeiller and Price Reference Sommeiller and Price2014, 21–22).Footnote 5 Further, the ARGI-IRS type measure adopted here is preferable to Current Population Survey (CPS) which underestimates incomes in the top decile due to top-coding, undercoverage and underreporting (Burkhauser et al. Reference Burkhauser, Feng, Jenkins and Larrimore2012, 371–372).Footnote 6
The state average ARGI measures for High Affluent Citizens are denoted for the following three income fractiles covering the upper half-percentile (i.e. the top 0.5% in a given state-year) of the income distribution (see Online Appendix Table: Descriptive Statistics for Variables Employed in Study): Top 0.01%, Top 0.1%:Top 0.01% and Top 0.5%:Top 0.1%. The three lower income fractiles covering the remainder of the upper decile of the income distribution (between the top 10% and to 0.5% in a given state-year), termed Low Affluent Citizens, consists of the Top 1%:Top 0.5%, Top 5%:Top 1% and Top 10%:Top 5%. Considerable variations exist for real income growth across the American states. For example, during the 1979−2007 period, Sommeiller and Price (Reference Sommeiller and Price2014, 7, Table 1) demonstrate that the Top 1% fractile experienced a real income growth surge of nearly 415% in Connecticut (maximum), 163.5% in South Carolina (median rank) and 74% in West Virginia (minimum).
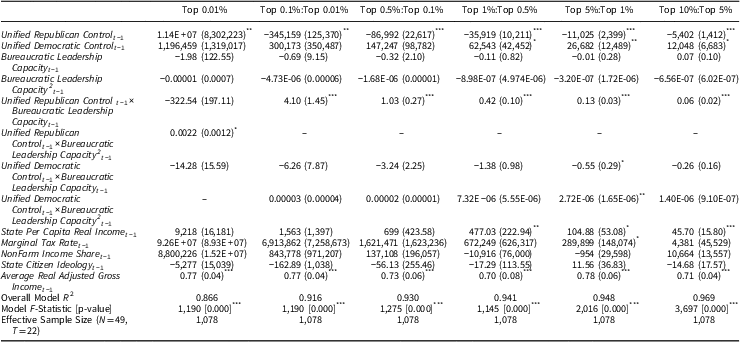
Explaining average real adjusted gross income for affluent citizens in the American states by income fractile (1986−2008) [ARDL(1,1) dynamic multiplicative model specification: OLS with both state and year fixed effects]
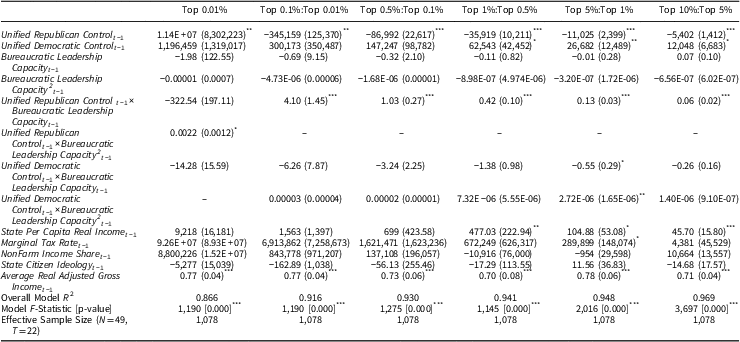
Note: Models estimated by ordinary least squares (OLS) with robust standard errors clustered by state appearing inside parentheses. All regressions include both state and year fixed effects binary dummy indicators (not reported). Nebraska is dropped from the sample because it is the only state that has a unicameral and nonpartisan state legislature.
***p⩽0.01; **p⩽0.05; *p⩽0.10.
Unified partisan control of both governors and the legislature is critical given that each party’s ability to obtain their preferred policy outcomes requires interbranch coordination in a separation of powers system. Unified Republican Control (URC) is equal to 1 when both the Governor and both legislative chambers are controlled by this party for a given state-year, and equal to 0 otherwise. Unified Democratic Control (UDC) is equal to 1 when both the Governor and both legislative chambers are controlled by this party for a given state-year, and equal to 0 otherwise. Divided Partisan Control is captured in the intercept term.
As noted previously, bureaucratic leadership capacity in US state governments is measured using executive agency head salary compensation (Boushey and McGrath Reference Boushey and McGrath2017). Although the institutional means by which executive agency heads’ compensation is determined varies across states,Footnote 7 the level of compensation does affect the capacity of candidates who are willing to serve in these positions.Footnote 8 Boushey and McGrath (Reference Boushey and McGrath2017: 90) note that “… There is a broad consensus that maintaining competitive salaries is essential for securing a professional and expert workforce”. This measure parallels studies analysing the impact of state legislative capacity on policymaking that relies on legislators’ compensation (e.g. Huber and Shipan Reference Huber and Shipan2002).
Our key conditioning covariate is termed Bureaucratic Leadership Capacity. This variable is operationalised as the median year 2000 constant-dollar adjusted salary compensation for major state agency heads across 35 high-level executive offices that pertain to major administrative functions of each state for a given year.Footnote 9 We exclude several offices that are routinely engaged in political activities (e.g. Attorney General, Secretary of State), or offices that engage in administrative tasks that should exert little, if any, bearing on policy administration that would influence the income earnings among affluent citizens in a given state (e.g. historic preservation, public libraries, elections administration).Footnote 10 Because this measure focusses on a common set of administrative functions performed by US state governments, it allows us to comparatively gauge aggregate bureaucratic capacity across a broad swath of administrative agencies (Fukuyama Reference Fukuyama2013, 355). These data exhibit more between-state variation than within-year variation (SDState/SDYear=1.74), and also exhibit a stationary time series process based on heterogeneous panel unit root tests (Im, Pesaran, and Shin (Reference Im, Pesaran and Kim2003) test (four lags): W t−bar=−1.96, p=0.025).
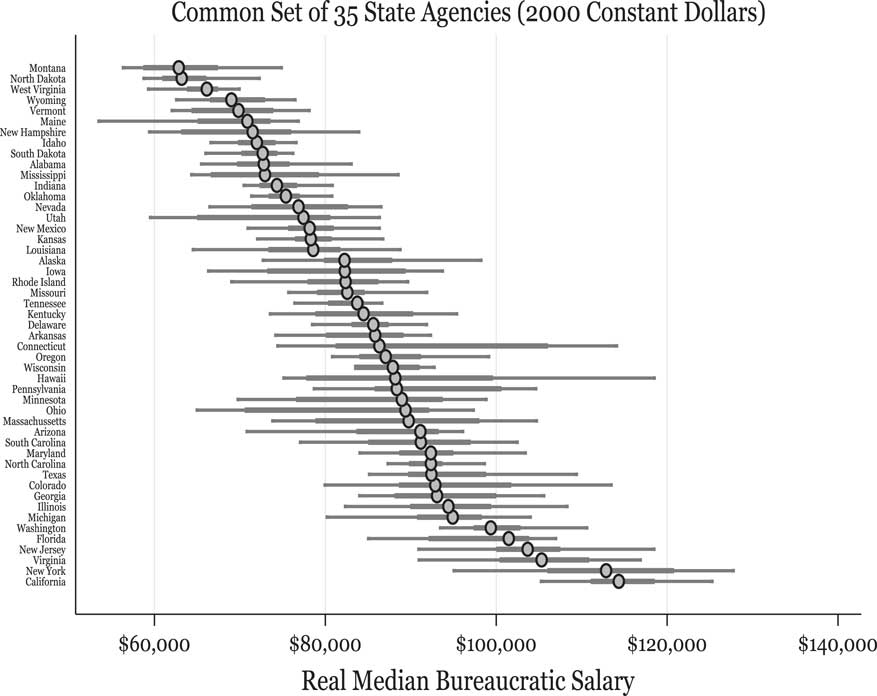
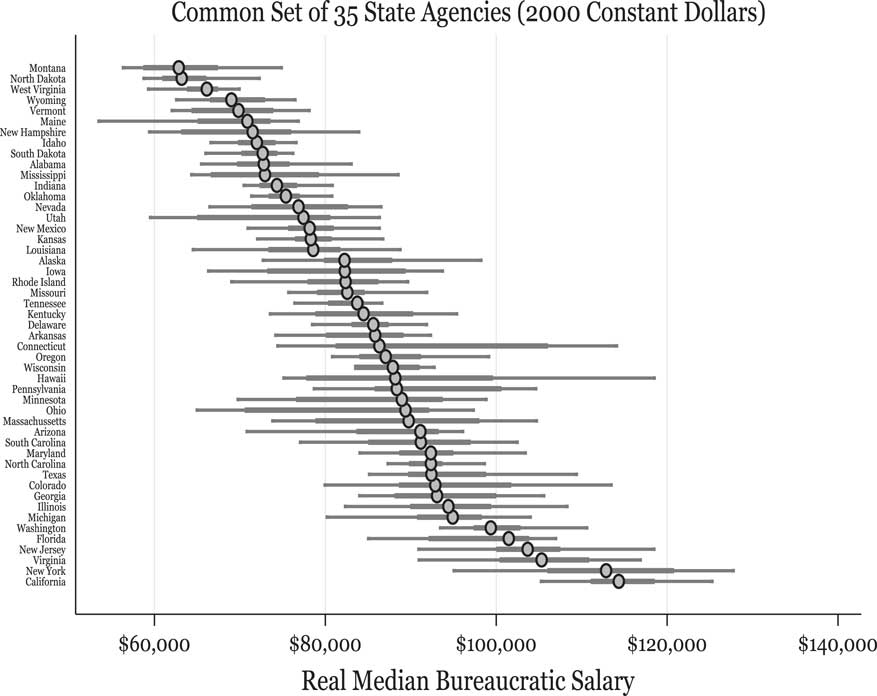
Figure 1 provides a summary graphical portrait of these data with Box-Whisker plots. At the poles, the states with the lowest median executive agency head salary compensation are typically less populous states. For instance, Montana has the lowest median level of executive agency head salary compensation while California’s is the largest between 1986 and 2008. Tennessee is at the median value of executive agency head salary compensation during this period. Although states paying the highest and lower compensation to their executive agency heads do considerably vary by income and cost of living, abundant between-state variation exists that does not fit this pattern. For example, it is worth noting that eight southern states are above the grand state median value of executive agency head salary compensation, including states such as South Carolina, Georgia and Virginia. Generally, states exhibiting either low or high executive agency head compensation values tend to exhibit less within-state temporal variation compared to those states that lie in the interquartile range of states.
Executive agency head compensation by state (1986–2008) common set of 35 state agencies (2000 constant dollars).
Note: Large dots represent state median values.
We also control for other covariates that may also explain income variations among affluent citizens in the American states. Changes in income among affluent citizens in the American states may also be a function of marginal tax rates (Saez et al. Reference Saez, Slemrod and Giertz2012).
To address this potential confounder, each statistical model contains a panel-based covariate, Marginal Tax Rate, that represents the estimated dynamic marginal tax rates for a given state-year based on the methodology advanced by Reed et al. (Reference Reed, Rogers and Skidmore2011).Footnote 11 Controlling for state marginal tax rates as a potential confounder ensures that the effects of bureaucratic leadership capacity on income changes for affluent citizens under alternative partisan government regimes are independent of tax policy variations.
Besides this potential state marginal tax rate confounder, additional ancillary control variables are modelled to represent factors that often correlate to income for affluent citizens in the American states. Accounting for these covariates is especially critical when analysing affluent citizens whose incomes will be affected more by market economic conditions compared to middle class and lower income groups. State Real Per Capita Income is expected to exert a positive impact on a state’s affluent citizens’ incomes since richer (poorer) states tend to have more (less) affluent citizens for a given level of citizen affluence represented by their respective income fractile group. NonFarm Income Share should be positively related to affluent citizens’ income for a given level of citizen affluence. States that derive a larger share of total income from agriculture possess affluent citizens with lower income levels compared to their state counterparts that derive a larger share of their income from manufacturing or technology.
State Citizen Ideology (Berry et al. Reference Berry, Evan, Fording and Hanson1998) may influence income for affluent citizens as a potential confounding factor with the partisan control of government.Footnote 12 Because income redistribution favours a left-leaning median voter (Kenworthy and Pontusson Reference Kenworthy and Pontusson2005), affluent citizens in states comprised of more liberal (conservative) constituents will tend to have lower (higher) incomes, ceteris paribus. This covariate should yield more reliable estimates of the theoretical hypotheses of interest given that the extra variation due to electoral changes captured by this measure will better account for income shifts that may otherwise be falsely attributed to discrete unified partisan control shifts.
The methodological approach adopted here is to estimate a series of first-order autoregressive distributed lag panel regression models using both time and state fixed effects.Footnote 13 In addition, we compare the robustness of the model specifications reported in the manuscript to those based on a generalised ARDL(1,1)-error correction modeling approach that accounts for distinct short and long-run relationships (e.g. see Kelly and Witko Reference Kelly and Witko2012).Footnote 14 Although the estimates vary somewhat in certain instances, the total long-run marginal effect results from this alternative dynamic model specification offer substantively similar support for Hypothesis 1 compared to the evidence presented in the next section based on a more parsimonious approach that is desirable given the stationarity properties of the Bureaucratic Leadership Capacity measure.
Both unobserved state-level and temporal heterogeneity are accounted for by specifying two-way fixed effects in all model specifications. This aspect of our identification strategy is critical for our substantive problem to ensure that the estimates are not confounded by omitted variable bias attributable to common national government forces that impact all states at a given point in time, nor unobserved time invariant state-level characteristics, as well as allowing for meaningful comparisons both across states and time. This modelling approach allows for direct relationship comparisons, for example, between unified Democratic control of Alabama state government in 1993 with unified Democratic control of California state government in 2003. Controlling for state fixed effects should account for nonexpertise variations associated with executive agency head compensation (Boushey and McGrath Reference Boushey and McGrath2017, 94).
The general form of the statistical model specification employed is:
 $$\eqalignno{ ARGI_{{i,t}} {\equals}& \alpha _{0} {\plus}\alpha _{1} ARGI_{{i,t{\minus}1}} {\plus}\beta _{1} URC_{{i,t{\minus}1}} {\plus}\beta _{2} UDC_{{i,t{\minus}1}} {\plus}\beta _{3} BLC_{{i,t{\minus}1}} {\plus}\beta _{4} BLC_{{i,t{\minus}1}}^{p} \cr & {\plus}\beta _{5} \left( {URC_{{i,t{\minus}1}} {\times}BLC_{{i,t{\minus}1}} } \right){\plus}\beta _{6} \left( {URC_{{i,t{\minus}1}} {\times}BLC_{{i,t{\minus}1}}^{p} } \right) \cr & {\plus}\beta _{7} \left( {UDC_{{i,t{\minus}1}} {\times}BLC_{{i,t{\minus}1}} } \right) {\plus}\beta _{8} \left( {UDC_{{i,t{\minus}1}} {\times}BLC_{{i,t{\minus}1}}^{p} } \right) \cr & {\plus}\gamma _{k} Z_{{k\,i,t{\minus}1}} {\plus}\psi _{i} S_{i} {\plus}\eta _{t} T_{t} {\plus}{\epsilon}_{{i,t}} $$
The dependent variable ARGI i,t is the adjusted real gross income by household for state i in year t (see Sommeiller and Price Reference Sommeiller and Price2014). URC i,t is unified Republican control in state i and year t, UDC i,t is unified Democratic control in state i and year t, BLC pi,t represents the pth higher order polynomial of Bureaucratic Leadership Capacity in state i and year t, Z ki,t consists of a kth vector of ancillary control variables in state i and year t, S i a vector of state-level fixed effects, T t a vector of time fixed effects and εi, a residual term. The covariates are modelled as operating on a one-year lag effect on affluent citizens’ market incomes since both policy and implementation lags will necessarily create temporal friction in the conversion of political and policy conditions into policy outcomes. The pth higher order polynomial of Bureaucratic Leadership Capacity covariates account for potential nonlinearities present for the conditional interaction effects for various partisan control regimes. If such nonlinearities are not present in these data, then these terms are excluded from the relevant model specifications.Footnote 15
Recalling Equation 1, the total long-run marginal effect of unified Republican partisan control on affluent citizens’ incomes relative to the divided partisan control baseline is: ([β 1+β 5×BLC i,t−1+β 6×BLC pi,t−1]/[1−α 1]), where evidence of Hypothesis 1 occurs when (β 5+β 6)/[1−α 1]>0. That is, executive agency head compensation has the long-term marginal effect of increasing affluent citizens’ incomes when major political branches are controlled by the Republican party. Similarly, the total long-run marginal effect of unified Democratic partisan control on affluent citizens’ incomes relative to the divided partisan control baseline is: ([β 2+β 7×BLC i,t−1+β 8×BLC pi,t−1]/[1−α 1]), where Hypothesis 1 obtains empirical support if (β 7+β 8)/[1−α 1]<0. Put simply, the capacity of executive agency heads will translate into decreasing incomes for affluent citizens relative to the divided partisan control baseline. Total long-run marginal partisan income differences accrued between unified Republican and unified Democratic regimes is given by {[β 1+β 5×BLC i,t−1+β 6×BLC pi,t−1]/[1−α 1]}–{[β 2+β 7×BLC i,t−1+β 8×BLC pi,t−1]/[1−α 1]}. These total long-run effects of institutional arrangements of state governments exerts a multiplier effect on affluent citizens’ incomes through time over multiple periods, with the degree of persistence or accumulation increasing in α 1. In the limiting case where α 1=0, all such institutional effects will manifest in a single year.
In the Supporting Information document (2. Robustness Checks: Comparison of Reported Model Results to Alternative Model Specifications and Functional Forms section), we consider the possibility of potential endogeneity between governmental conditions and income variations among affluent citizens by implementing placebo-based reverse causality tests. These tests augment the existing model specifications by incorporating one-year ahead leads for these relevant covariates (including interactions and power terms) as potential confounders. The findings from this sensitivity analysis are consistent with the results reported below in the next section of the manuscript. Next, we present the empirical results.
Statistical findings
Table 1 reports the regression estimates for the statistical models that test the theory’s predictions. One notices that the lack of statistical significance for the Bureaucratic Leadership Capacity additive coefficients suggests that the level of executive agency head compensation in the American states has little bearing on policy outcomes under divided partisan control of state governments. For the highest income fractile (Top 0.01%), the pattern of coefficients associated with URC covariates indicate that a U-shaped income surge for this group arises at sufficiently high levels of bureaucratic capacity. For the remaining five income fractile models below the Top 0.01%, the positive and statistically significant coefficients for the URC×Bureaucratic Leadership Capacity. Although the coefficients associated with the UDC×Bureaucratic Leadership Capacity covariate is the correct hypothesised sign in every instance, it is only estimated with sufficient precision for the Top 5%:Top 1% income fractile. These coefficient patterns reveal an asymmetric pattern regarding Hypothesis 1, whereby incomes are rising in a state’s level of executive agency head compensation under unified Republican partisan control regimes, but are more variable in the extent to which they fall under unified Democratic partisan control of state government.Footnote 16
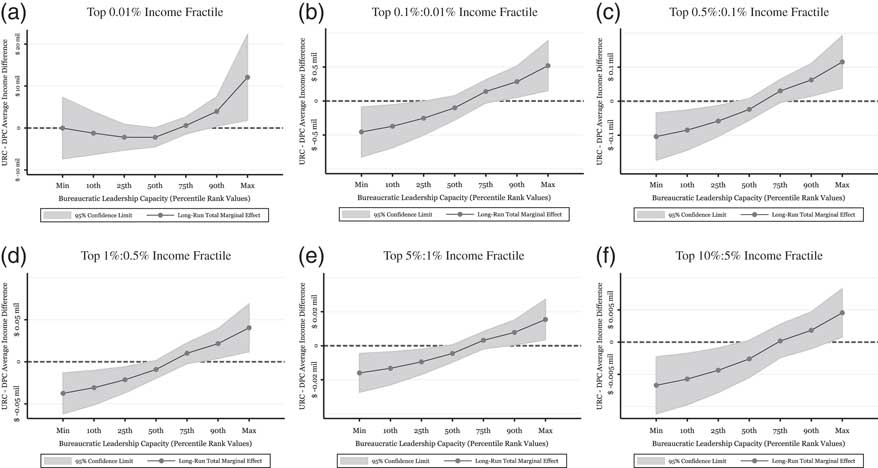
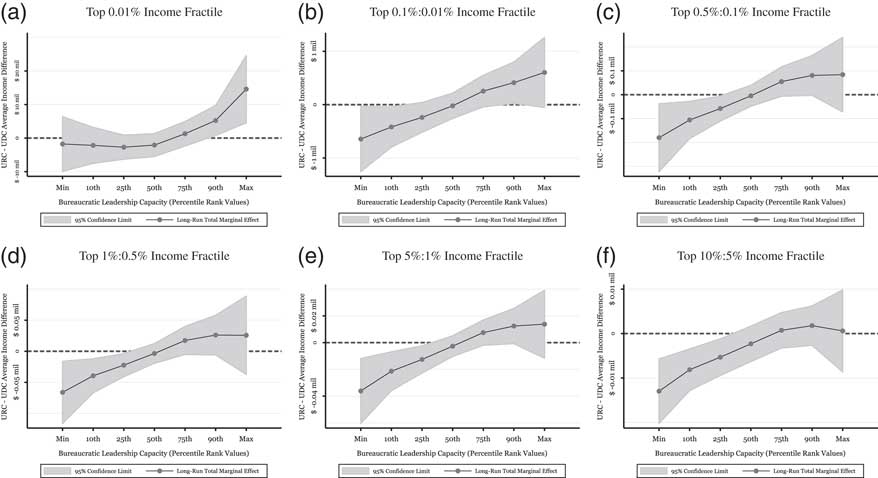
Direct evaluation of Hypothesis 1 requires analyses of the total marginal partisan income differences under URC of state political institutions versus a baseline of divided partisan control for a given income fractile group, conditional on varying levels of bureaucratic leadership capacity. If Hypothesis 1 is supported by these data, then income differences should be upward sloping with respect to the bureaucratic capacity displayed by agency leaders. This is graphically portrayed in Figure 2. Figure 2a displays the conditional average impact of bureaucratic leadership capacity on incomes for the most affluent subset of citizens (Top 0.01%) under this unified partisan regime. Incomes are higher than the divided partisan control baseline under very low levels of bureaucratic leadership capacity before declining at moderate levels.
Analysing affluent citizens’ incomes increasing in bureaucratic leadership capacity: unified Republican governments in the American states.
Note: Long-run total marginal effect is computed as ([β 1+β 5×BLC i,t−1+β 6×BLC pi,t−1]/[1−α 1]) from Equation 1. The comparison baseline is divided partisan control of state governor and legislative branches. p=1 (first-order polynomial) for all income fractiles except for top 0.01% (where p=2). URC=Unified Republican Control; DPC=Divided Partisan Control.
What is worth noting in Figure 2a is that incomes noticeably surge at the 90th percentile value under URC regimes (π BLC|URC⩾0.90). For instance, income rises by $3.95 million, on average, when bureaucratic leadership capacity is at the 90th percentile value for this type of partisan regime (π BLC|URC=0.90) compared to the divided partisan control baseline. The patterns for those affluent citizens whose incomes fall below the Top 0.01% group reveal a similar pattern. Contrary to their partisan preferences, incomes for affluent citizens during times of URC of state institutions is significantly lower than compared to divided partisan control eras only when bureaucratic leadership capacity is moderate (π BLC|URC=0.50) predicated on the nonlinear functional form.Footnote 17
Figure 2b reveals that the second most affluent group (Top 0.1%:0.01%) experiences lower incomes by $455,196 (π BLC|URC=Min) and $371,198 (π BLC|URC=0.10) at lower levels of bureaucratic leadership capacity. However, under higher levels of bureaucratic leadership capacity, incomes are estimated, on average, to be $140,949 (π BC|URC=0.75), $284,622 (π BLC|URC=0.90) and $519,940 (π BLC|URC=Max) higher than compared to the divided partisan control baseline, respectively. The change from the 10th–90th percentile values in bureaucratic leadership capacity results in a total long-run average income surge of $655,820 for this group relative to divided partisan control eras. Figure 2c and 2d uncover a substantively similar pattern for the third and fourth most affluent groups (Top 0.5%:Top 0.1%; Top 1%:Top 0.5%). In each instance, incomes under unified Republican governments are noticeably lower than compared to divided party government at low levels of bureaucratic leadership capacity (π BLC|URC⩽0.10), but the pattern reverses at higher levels of this covariate (π BLC|URC⩾0.75). For instance, Figure 2d indicates that incomes for the Top 1%:0.5% fractile fall by an average of $30,813 at the 10th percentile value of bureaucratic leadership capacity, yet rise by an average of $21,627 at the 90th percentile value of bureaucratic leadership capacity. This $52,440 surge of income represents a 26.18% of a standard deviation income change in this group ($200,273) relative to the divided partisan control baseline.
Although the numerical effects are attenuated in absolute terms at lower income fractiles due to substantially lower incomes at lower levels of affluence, these general statistical patterns also hold for the pair of least affluent citizen groups (Top 5%:Top 1%; Top 10%:Top 5%) appearing in Figure 2e and 2f. Figure 2f, for example, shows that that incomes for the least affluent group drop on average by $5,737 at the 10th percentile value of bureaucratic leadership capacity relative to a divided partisan control regime, yet rises by $4,550 at the maximum value of this covariate. These results consistently support Hypothesis 1 in terms of the conditional linkage between unified Republican control of state government and higher incomes for affluent citizens. Moreover, this evidence reveals that low levels of bureaucratic capacity for agency leaders, reflected by executive agency head compensation, result in poor implementation of desired policy outcomes for Republican governments compared to divided partisan control of state political institutions. This pattern suggests that unified political parties’ greater willingness to delegate authority to bureaucracies exhibiting low leadership capacity has deleterious consequences for attaining policy outcomes consistent with majoritarian preferences.
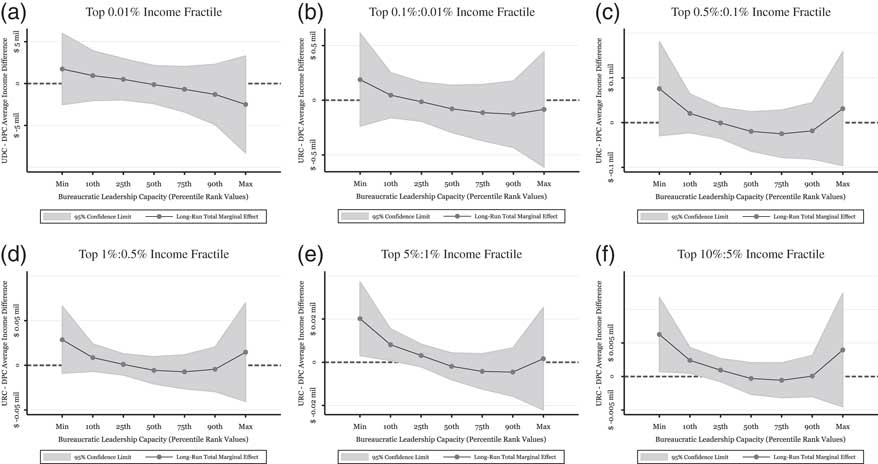
Figure 3 analyses the total marginal partisan income differences under unified Democratic control of state political institutions versus a baseline of divided partisan control for a given income fractile group, conditional on varying levels of bureaucratic leadership capacity. Consistent with Hypothesis 1, a downward sloping relationship should exist between such income differences and bureaucratic leadership capacity. In the top panel of graphs (Figure 3a–3c), although incomes among the Top 0.5% affluent citizens generally declines in the level of bureaucratic leadership capacity, these impacts are both modest and less precise compared to unified Republican partisan regimes for the three most affluent groups. Citizens falling below the top 1% of the income distribution threshold accrue statistically discernible income gains in times of unified Democratic partisan control in the presence of bureaucratic leadership capacity. For instance, incomes for the Top 5%: Top 1% (Figure 3e) and Top 10%: Top 5% (Figure 3f) are $8,117 and $2,406 higher than the divided partisan control baseline when bureaucratic leadership capacity is at the 10th percentile value (π BLC|UDC=0.10), respectively.
Analysing affluent citizens’ incomes decreasing in bureaucratic leadership capacity: unified Democratic governments in the American states.
Note: Long-run total marginal effect is computed as ([β 2+β 7×BLC i,t−1+β 8×BLC pi,t−1]/[1−α 1]), from Equation 1. The comparison baseline is divided partisan control of state governor and legislative branches. p=2 (second-order polynomial) for all income fractiles except for top 0.01% (where p=1). UDC=Unified Democratic Control; URC=Unified Republican Control; DPC=Divided Partisan Control.
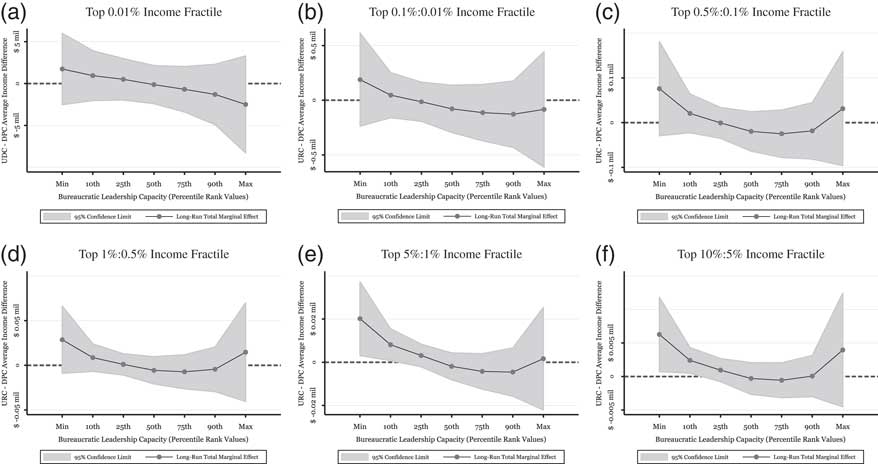
Clearly the statistical evidence shows that incomes for affluent citizens are never significantly lower under unified Democratic party state governments when bureaucratic leadership capacity is high. This asymmetric pattern may explain to some extent why reducing income inequality is challenging for unified Democratic governments, even when sufficiently high levels of executive agency head compensation are associated with converting their unified partisan policy preferences into policy outcomes. Taken together, bureaucratic capacity, in the form of state executive agency head compensation, offers the most benefits for unified Republican governments in attaining their preferred policy outcomes. Although caution are warranted for generalising these asymmetric partisan findings to other policy settings, these findings imply that unified political parties are more effective in conferring policy benefits to core constituent groups than perhaps they are at extracting costs for opposing constituent groups.
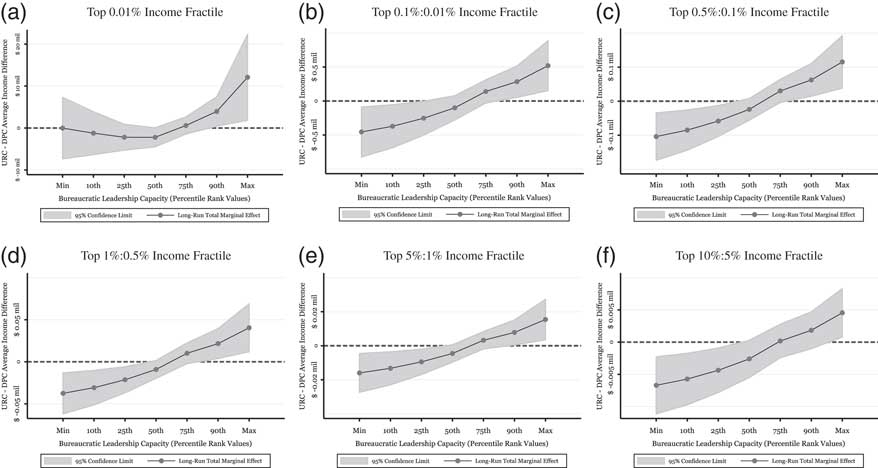
Figure 4 displays the estimated average income differences between unified Republican versus unified Democratic state governments, conditional on bureaucratic leadership capacity. These graphs allow for evaluating whether UDC can stem income gains compared to unified Republican governments at various levels of bureaucratic leadership capacity. Based on Hypothesis 1, income differences between this pair of unified partisan control regimes should be increasing with respect to bureaucratic leadership capacity. For the wealthiest income group (Top 0.01%), Figure 4a reveals that incomes are $5.24 million higher under URC of state government versus single party control by the Democrats at the respective 90th percentile values of bureaucratic leadership capacity and rises to $14.6 million at the maximum values of this covariate.
Analysing differences between affluent citizens’ incomes between alternative unified Partisan control governments in the American states, conditional on bureaucratic leadership capacity [unified Republican control (URC)−unified Democratic control (UDC)].
Note: Long-run total marginal effect is computed as {[β 1+β 5×BLC i,t−1+β 6×BLC pi,t−1]/[1−α 1]}–{ [β 2+β 7×BLC i,t−1+β 8×BLC pi,t−1]/[1−α 1]} from Equation 1. The comparison baseline is an absence of a unified partisan control income difference. Unified Republican partisan control: p=1 (first-order polynomial) for all income fractiles except for top 0.01% (where p=2). Unified Democratic partisan control: p=2 (second-order polynomial) for all income fractiles except for top 0.01% (where p=1).
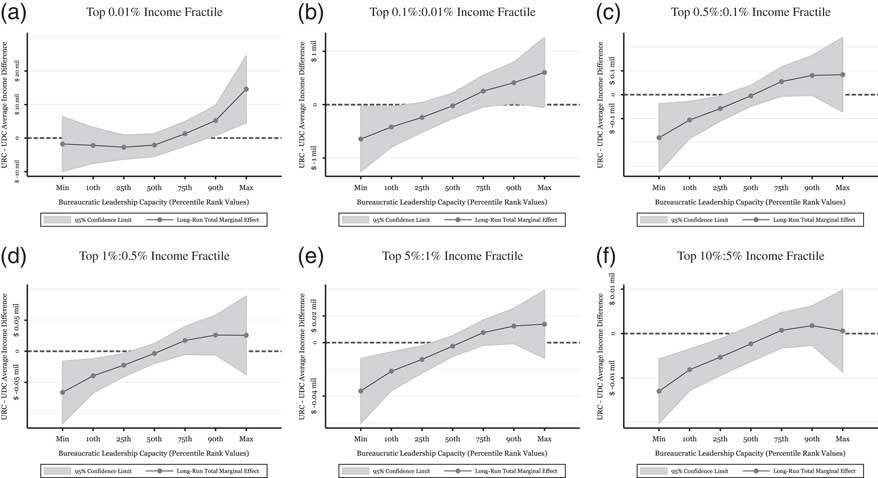
For affluent citizens below the top 0.01% (Figure 4b–4f), levels of bureaucratic leadership capacity below the 25th percentile value associated with each unified regime (π BLC|URC⩽0.25, π BLC|UDC⩽0.25) are associated with inverted partisan income differentials. The average income per fractile for these groups is significantly lower under unified Republican governments compared to unified Democratic governments. This finding underscores the adverse effects that low bureaucratic leadership capacity has for converting majoritarian preferences into policy outcomes. At higher levels of bureaucratic leadership capacity (π BLC|URC⩾0.75, π BLC|UDC⩾0.75), unified partisan income differentials are consistent with partisan policy preferences regarding incomes among the most affluent citizens in the top 0.1% of the income distribution. This difference ranges from an average low of $254,503 (Figure 4b: π BLC|URC=0.75, π BLC|UDC=0.75) to an average high of $14.6 million (Figure 4a: π BLC|URC=Max, π BLC|UDC=Max). While such differences are observed for the remaining four lower income fractile groups (Figure 4c−4f), these estimated relative differential effects are more modest and estimated with considerable imprecision that do not attain statistical significance at conventional levels.
Finally, we analyse unconditional unified partisan control differences to demonstrate that any partisan government control differences involving affluent citizens’ incomes are highly contingent upon the bureaucratic leadership capacity. This analysis estimates the statistical models appearing in Table 1 but, omits all interaction terms between the bureaucratic leadership capacity covariate and unified partisan control binary indicators, as well as the squared bureaucratic leadership capacity covariate. For brevity, we only report the results for coefficient differences among state government partisan regimes in Table 2. We evaluate whether incomes under each unified partisan control regime are statistically discernible from the divided partisan control baseline, as well as between unified partisan control regimes.
Testing for unconditional unified Partisan control differences: explaining average real adjusted gross income for affluent citizens in the American states by income fractile (1986−2008) [ARDL(1,1) dynamic additive model specification: OLS with both state and year fixed effects]

Notes: Coefficient entries represent total long-run marginal effect differences in constant dollar terms: Unified Republican Partisan Control–Divided Partisan Control Baseline: β URC/(1–α 1); Unified Democratic Partisan Control–Divided Partisan Control Baseline: β UDC/(1–α 1); and Unified Republican Partisan Control–Unified Democratic Partisan Control: [β URC/(1–α 1)−β UDC/(1–α 1)], where α 1 equals the coefficient on the lagged dependent variable (average real adjusted gross income per fractile).
Probability values are listed inside brackets. Models estimated by ordinary least squares (OLS) with robust standard errors clustered by state appearing inside parentheses. All regressions include the set of covariates included in the Table 1 models reported in the manuscript (including both state and year fixed effects), except for omitting squared bureaucratic leadership capacity and interaction terms between the linear bureaucratic leadership capacity covariate and the unified partisan control binary indicators. Nebraska is excluded from the sample because it is the only state that has a unicameral and nonpartisan state legislature.
The evidence reveals that the magnitude of these differences is modest, especially among the more affluent groups. Moreover, we fail to uncover a single instance where income differences are attributable to partisan control of government, independent of bureaucratic leadership capacity. These findings reveal that unified party control of government – in isolation − does not adequately account for partisan differences in explaining income variations for affluent citizens in the American states. In other words, the data do not support standard conceptions of partisan differences between Republican and Democratic unified control of state governments. This particular evidence, coupled with the evidence presented in both the manuscript and subsequent robustness checks in the Supporting Information document (2. Robustness Checks: Comparison of Reported Model Results to Alternative Model Specifications and Functional Forms section), underscore the importance of qualified state executive agency heads for enabling political parties to achieve their preferred income distribution when they control both the governor and legislature.
Taken together, these findings support our argument that which party controls all branches of government, in conjunction with the capacity of top-level agency officials that are charged with providing administrative leadership in US state governments, shapes policy outcomes consistent with their partisan objectives. When the bureaucratic leadership capacity is low, policy outcomes run counter to majoritarian preferences. Public bureaucracies led by high capacity agency leaders offer a promising mechanism for ensuring that policy outcomes are consistent with the intention of elected officials operating under unified partisan governments. The empirical implications of Hypothesis 1 are further corroborated by a more granular analysis of these executive agency head salary compensation data employing alternative measures for both low (bottom quartile median) and high (top quartile median) data quantiles.Footnote 18
The evidence obtained here provides a rather conservative test of our logic since both Democratic and Republican party organisations have supported policies for wealthier Americans in recent decades (Hacker and Pierson Reference Hacker and Pierson2010). We surmise that the empirical findings would be sharper in the lower income fractiles for two reasons: first, our general argument predicts that high capacity executive agency heads should translate into the poorest citizens faring much better (worse) under unified Democratic (Republican) governments compared to divided partisan control regimes; and unlike wealthy citizens and groups influence over Democratic politicians noted by Hacker and Pierson (Reference Hacker and Pierson2010), those in the bottom portion of the income distribution should be comparatively less effective in influencing Republican elected officials.
Our study has several caveats that may yield fruitful avenues for future inquiry. First, this study cannot ascertain agency-specific sources of contributing income gains/losses among affluent citizens, nor demarcate between abridgement versus expansion efforts on behalf of state governments. Rather, we can only establish whether aggregate policy outcomes, reflecting political parties’ different policy preferences, are consistent with the overall capacity of each state government’s bureaucratic leadership team. Because we cannot trace how specific policies in the American states (e.g. disbursement of specific contracting decisions or intergovernmental aid revenues to particular constituencies) map to affluent citizens’ incomes, we cannot infer which specific agencies are most responsible for influencing aggregate economic outcomes due to a cross-level inference problem that affects research on this topic.
Second, because this study restricts its focus to a single dimension of bureaucratic performance – the extent to which public agencies can administer policies that convert partisan politicians’ policy objectives into corresponding policy outcomes – other dimensions for evaluating bureaucratic performance (e.g. social equity concerns, professional norms) can yield novel insights beyond this study. Finally, future studies may wish to explore the role of lower organisational layers within public agencies and the slippage that ensues within administrative institutions seeking to attain policy outcomes consistent with political institutions’ objectives.
Discussion
Speaking to the issue of policy execution in Federalist 70, Alexander Hamilton asserted “And a government ill executed, whatever it may be in theory, must be in practice a bad government” (The Federalist Papers 1982, 355). Much of Hamilton’s advocacy of a robust unified executive branch is rooted in the simple idea that effective governance requires the conversion of unity of purpose into action. Speaking of the critical role required of effective administration in a democracy, Norton Long perceptively proscribed decades ago “Attempts to solve administrative problems in isolation from the structure of power and purpose in the polity are bound to prove illusory” (Reference Long1949: 264). Motivated by these complementary insights, we maintain that unity of purpose among elected officials cannot guarantee policy success without the support of capable agency leaders who are willing to act on behalf of their policy interests.
Elected officials seeking to ensure that their policy objectives are carried out through the administrative state face a daunting task. In this study, we propose that a combination of unified party government and sufficiently high levels of bureaucratic capacity associated with executive agency heads are necessary to obtain policy outcomes consistent with majoritarian preferences. We test this proposition by analysing income variations among several affluent income groups across the American states. Not only do clear partisan policy preference differences arise over these policy outcomes (e.g. Bartels Reference Bartels2008; Brady and Leicht Reference Brady and Leicht2008, 80−82; Gelman et al. Reference Gelman, Kenworthy and Su2010), but these affluent groups are most responsible for the surge in income inequality that has transpired in the US (Piketty and Saez Reference Piketty and Saez2003; Sommeiller and Price Reference Sommeiller and Price2014), and also around the world (e.g. Piketty and Saez Reference Piketty and Saez2006; Leigh Reference Leigh2007; Atkinson and Piketty Reference Atkinson and Piketty2010).
Our statistical evidence reveals that low levels of capacity for executive agency heads undermine elected officials’ efforts at attaining their policy goals when the latter share common policy objectives. Higher levels of bureaucratic leadership capacity are generally associated with policy outcomes that more closely cohere to politicians’ policy preferences when the Republican party controls each of the major electoral branches of government, but not when the Democratic party possesses such unified control. This asymmetric pattern may explain, in part, why income inequality has grown through time given that Democratic partisan efforts have been ineffective at offsetting income gains made by affluent citizens under unified Republican governments possessing highly capable bureaucratic leaders. In turn, a necessary, but not always sufficient condition for attaining partisan policy objectives occurs when politicians share a unity of purpose, in conjunction with executive agency heads that are both able and willing to facilitate policy-making authority on their behalf.
A major lesson from this study is that bureaucratic capacity is normatively desirable for executing the popular will of majorities in representative democracies. For public laws and executive actions to achieve their intended policy consequences, it requires government agencies to interpret, implement and enforce such policies. In recent decades, politicians and citizens’ groups alike have advocated efforts to “hollow out” the administrative state for stated purposes of bringing about a closer connection between democratic preferences and policy outcomes (e.g. Peters and Pierre Reference Peters and Pierre1998; Terry Reference Terry2005). Yet, political efforts to undermine the authority of the administrative state work at cross-purposes for obtaining policy outcomes consistent with majoritarian preferences. Bureaucratic capacity, especially among top agency officials, can therefore be viewed as a critical ingredient for enhancing substantive representation over policy outcomes whenever elected officials possess a unity of purpose since it provides a means for the effective exercise of policy-making authority by governments.
Supplementary materials
To view supplementary material for this article, please visit https://doi.org/10.1017/S0143814X18000405
Data Availability Statement
Data replication materials for the empirical analysis presented in both the manuscript and Supporting Information document are available at the JPP Dataverse located at: https://dataverse.harvard.edu/dataset.xhtml?persistentId=doi:10.7910/DVN/GCXFYS.
Acknowledgements
The authors thank Despina Alexiadou, Barry Ames, Charles Barrilleaux, Arie Beresteanu, Christopher Bonneau, Stephen Chaudoin, Daniele Coen−Pirani, Ian Cook, Steven Finkel, Brad Gomez, Justin Grimmer, Jude Hays, Laura Paler, Randall Walsh, Christopher Witko, Jonathan Woon, the anonymous JPP referees and editor, plus seminar participants at these various forums for helpful comments. The authors also thank Estelle Sommeiller for graciously making her income shares data available to us, as well as both Graeme Boushey and Rob McGrath for graciously sharing their state executive agency head salary compensation data with us. The authors also thank Yen−Pin Su and Kiyoung Jeon for excellent research assistance.