

In recent years, interest in the comparative study of judicial independence has increased markedly. There has been an explosion of good work, be it quantitative (Hayo and Voigt Reference Hayo2007; Powell and Staton Reference Powell and Staton2009; Popova Reference Popova2010), qualitative (Chavez Reference Chavez2003; Trochev Reference Trochev2004; VonDoepp Reference VonDoepp2009), or formal (Vanberg Reference Vanberg2001; Stephenson Reference Stephenson2003) in nature.Footnote 1 While a significant focus of much work uses judicial independence to explain economic outcomes (Haggard, MacIntyre, and Tiede Reference Haggard2008; Helmke and Rosenbluth Reference Helmke2009), no less attention has been paid to explaining variation in levels of both formal de jure and behavioral de facto judicial independence. This article contributes to the study of judicial independence in two ways. First, I present an argument suggesting that independent courts can act as an important mechanism to minimize the risks of post-tenure punishment on the part of state leaders. Independent courts do so both by restricting the ability of those in power to successfully use politicized justice against their predecessors and by acting as a deterrent mechanism against such attempts.
Second, I link the analysis of post-tenure fates to popular “insurance” explanations of judicial independence, showing how the analysis provides a first test of a key, previously unexamined assumption of these strategic models of judicial independence, which “have recently emerged as a leading framework to investigate the issue” (VonDoepp and Ellet Reference VonDoepp2011, 148). While subtle differences exist between the explanations offered by different scholars, these strategic or “insurance” models share a remarkably similar fundamental logic: when credible electoral alternatives to those in power exist, those in power are incentivized to create or strengthen minoritarian institutions capable of protecting their policies, property, and political rights after leaving power. A key assumption of this electoral logic of judicial independence is that independent courts do in fact provide benefits to those recently out of office; without the provision of these benefits, independent courts are only costly—inhibiting political actors’ prerogatives while still in office. Despite the importance of such provisions, in the existing literature the ability of courts to protect political actors after leaving office has typically been assumed or at best been justified by reference to anecdote rather than systematic analysis. If this assumption does not hold, and independent judiciaries do not provide protection to leaders after losing power, then the logic underlying the strategic framework fails to obtain. As such, testing and correcting the assumption is important not solely so the political insurance models are more descriptively accurate representations of reality but also because if it is found incorrect then the foundation on which most existing explanations of judicial independence are built crumbles.
Using global data on the fate of leaders after leaving office, I test the hypothesis that independent courts are associated with a higher likelihood of an unpunished post-tenure fate, finding that judicial independence is a strong and consistent predictor of post-tenure fate. These results offer support for the hypothesis forwarded in the article and provide both evidence for the validity of this key assumption of insurance models of judicial independence as well as ancillary evidence for their descriptive accuracy. In this article, I proceed as follows. Section I offers a brief overview of the strategic model of judicial independence. In Section II, I present a hypothesis as to why independent courts should minimize the risks of post-tenure fate and discuss how, although the hypothesis is independent of insurance models of judicial independence, it provides a first test of acritical assumption of these models. In Section III, I discuss measures of both post-tenure fate and judicial independence, as well as a number of additional covariates. Section IV presents the results of a number of logistic regression models, interprets them via simulation and visualization, and examines a further test of the models. I conclude in Section V with a discussion of the implications of these findings. The appendix provides significant support for inferences presented in the empirical models, including model fit, cross-validation of results, and a variety of alternative modeling strategies.
I. Explaining Judicial Independence Strategically
In his seminal comparative study of US and Japanese courts, Ramseyer (Reference Ramseyer1994) generalizes Landes and Posner’s (Reference Landes and Posner1975) argument that independent courts serve the electoral interests of rational politicians, contending that variation in the competitiveness of the electoral arena affects the interests of political actors vis-à-vis independent courts. Ginsburg (Reference Ginsburg2003) further develops the argument that strategic political actors facing electoral competition have incentives to establish independent judiciaries, offering what he calls an “insurance model” of judicial independence. Hirschl (Reference Hirschl2004) presents a closely related argument, integrating the substantive positions and worldviews of political actors into the strategic framework. In all these formulations, the crux of the argument is that independent courts are able to bind future actors and decrease the uncertainty around future outcomes for those in power today. A similar idea has been introduced in the literature on American political development, although there has been a less explicit focus on the strategic calculation of political actors: Gillman (Reference Gillman2006) labels this the “entrenchment” function of the federal judiciary, whereas Tushnet (Reference Tushnet2006) considers the potential for an intertemporal collaborative role for the US Supreme Court.
Ramseyer (Reference Ramseyer1994) argues that despite de jure similarities between Japanese and US courts (the postwar Japanese constitution being modeled closely on the American constitution), Japanese courts had little de facto independence. For Ramseyer, this is best explained by the Liberal Democratic Party’s extreme dominance of electoral politics in the postwar era. In his analysis of new democracies in East Asia, Ginsburg (Reference Ginsburg2003) contends that the distribution of political power during and immediately after transitions to democracy determines the degree of independence accorded to courts under the new democratic regimes. When political actors expect to dominate the political scene for the foreseeable future, they have no incentive to create strong minoritarian institutions. This is because if they expect to hold the reins of power for a long period of time, the perceived benefits of independent judiciaries (critically protecting political minorities) do not obtain, while the costs (courts ability to constrain political actors) remain. As a result, when competition is weak, so is judicial independence. However, when there is robust political competition and those in power thus know it is likely that they will soon find themselves out of power, judicial independence is enshrined as insurance against no longer being in power. According to this “electoral logic,” independence should be expected when competition within and between the political branches of government is greater (Chavez, Ferejohn, and Weingast Reference Chavez2003).
II. Independence and Post-tenure Fate
Why might independent courts provide more protection to former leaders than dependent courts? Simplified, the two typical situations facing a former leader are courts that have been independent—that is, courts possessing autonomy and the ability to make judgments free from undue political influence—and those have been dependent, where the previous conditions do not hold. At first it might seem that departing leaders would prefer the reins of justice to be held by those they appointed (especially with regard to apex courts), in the expectation that these individuals will side with them should they find themselves the target of legal action. However, this is very much not the case: dependent courts rarely remain dependent on those previously in power, instead typically becoming dependent on those newly in office, regardless of the nature of the transfer of power. This is often because those newly in power replace high-ranking officials—including judges—with their own people (Helmke Reference Helmke2005). But this replacement (or rather the risk of it happening) also incentivizes dependent judges appointed by those previously in power to defect, siding with their new bosses over their old (Helmke Reference Helmke2002). As a result, the real situation faced by those formerly in power is not between independent and dependent courts but between independent courts and courts dependent on those newly in power.
Given that dependent courts should be expected to side with those newly in power, the question of whether independent or dependent courts should be of greater protection against politicized prosecutions becomes clear. If a former leader is free from the taint of corruption or criminality, an independent judiciary effectively insures an unpunished post-tenure fate, almost by definition: in instances in which accusations are baseless, prosecutions of former leaders are politicized by their very nature. And if the judiciary is in fact independent of political actors, attempts to politicize prosecution and punish former leaders should be constrained by the courts and, thus, unsuccessful. If, however, a former leader were under genuine suspicion for actions committed while in office, an independent court increases the likelihood of legal rules being applied fairly and judges ruling without bias. This, however, is not the case when courts are lacking independence. In such situations, it is unclear whether even innocence of wrongdoing is enough to secure an unpunished post-tenure fate in all instances: neither the use of fabricated charges nor the criminalization of questionable administrative decisions is rare. In this context, the question of post-tenure punishment instead relies on the discretion of those in power and the degree to which they are able to influence the judiciary.
Similarly, any extrajudicial punishments of former leaders when courts lack independence are far less likely to be constrained by the judicial branch, and the actions of those in power are far more likely to be upheld as permissible. Contrast this to a situation in which independent courts serve as effective arenas for redress of grievances, better allowing individuals to contest state actions. In such a context, even extrajudicial punishments of former leaders should be less likely because those in power are aware that their actions can be nullified by judicial decisions. As a result, independent courts can serve to block both politicized prosecutions and extrajudicial forms of punishment. But perhaps more important, we should expect independent courts to serve as a deterrent mechanism, inducing leaders to refrain from pursuing such activities in the first place, knowing that the chances of success are limited.
Not only might independent courts lead those who take power to refrain from the politicized prosecution of former leaders—regardless of their potential culpability for criminal actions—because they doubt their inability to influence the judiciary, but they may also do so for fear of sparking public outcry. In the democratic context, Vanberg (Reference Vanberg2001, Reference Vanberg2005) argues that the fear of public backlash and electoral punishment causes those who occupy the political branches to refrain from violating judicial independence. Even in autocracies with severely limited party systems—a context in which the salience of backlash should be less critical—overt pressure on, and meddling with, the judiciary can at times result in public outcry and protest (Moustafa Reference Moustafa2003, Reference Moustafa2007). Such outcomes should not be limited to prosecutions but extend to the physical security of former leaders. In a context in which a strong and independent court system exists, those who assume power—by legitimate means or otherwise—should be less likely to risk public backlash by either strong-arming the judiciary or circumventing it and pursuing extrajudicial punishment. Thus, an independent judiciary can act as a critical check on politicized prosecution and extrajudicial punishment, and, as critically, it can act as a deterrent to engage in such activities in the first place.
An Illustration
The contemporary case of Yulia Tymoshenko, the former prime minister of Ukraine, illustrates the danger of being a former leader in a situation in which judicial independence is severely constrained.Footnote 2 In the 2010 presidential elections, Tymoshenko was the sitting prime minister, running for the presidency against two main opponents: her former Orange Revolution ally (and the incumbent president) Viktor Yushchenko and the leader of the opposition Party of Regions, Viktor Yanukovych (the former prime minister and the loser in the electoral disputes of the 2004 Orange Revolution). In reality, the contest was between Tymoshenko and Yanukovych, as Yushchenko’s approval—along with Ukraine’s gross domestic product (GDP)—had plummeted, and nearly 80% of voters listed his name in response to the survey question, “Who would you vote for under no circumstances?” (Interfax-Ukraine 2009). The second round of the elections, held in early February, was a choice between Tymoshenko and Yanukovych, the two candidates with the most votes in the first round. In results widely regarded as free and fair, Yanukovych won the election with 49% of the vote to Tymoshenko’s 45.5% (ODIHR 2010). Despite at first appealing the results of the election, Tymoshenko soon declined to take her legal challenge to the Supreme Court, and Yanukovych was the uncontested winner of the presidential election.
Two months later, a case that had been closed 5 years prior was reopened, and Tymoshenko was under investigation for trying to bribe judges. This was simply the first in a series of criminal cases against the former leader, to which have been added investigations or prosecutions for a variety of offenses, including abuse of office when signing a gas deal with Russia, misappropriation of funds, nondelivery of goods by a firm she controlled in 1996, the reopening of a 2001 investigation of tax evasion, involvement in the 1996 murder of businessman and member of parliament Yevhen Shcherban, bribery of former prime minister Pavlo Lazarenko by a Cypriot company co-owned by Tymoshenko, and four further charges of tax evasion and embezzlement covering 1996–2000.Footnote 3
Both domestic and international observers, including the United States, Russia, and the European Union, considered these actions to be politically motivated prosecutions at the time they were pursued by the Yanukovych administration (BBC News Europe 2011) and continue to maintain this position.Footnote 4 Many suggest that the new charges filed against her while in prison are to prevent her from running in the 2015 presidential election, which would be possible if the European Court of Human Rights were to rule in her favor (the decision is pending) with regard to her conviction for abuse of office (Danilova Reference Danilova2013), a conviction the Council of Europe has called the “criminalization of normal political decision-making” (Spillius Reference Spillius2012).
These politically motivated prosecutions have been successful in no small part because of the fact that in Ukraine the judiciary is subject to intense political pressure (Futey Reference Futey2011). In the early 2000s the judiciary was severely lacking in independence, and this situation has deteriorated significantly under the Yanukovych presidency: multiple Constitutional Court justices critical of Yanukovych resigned and were replaced by loyalists, changes to the Supreme Council of Justice gave the executive wide latitude in the appointment and dismissal of judges, and the discretion of courts was severely curtailed (Freedom House 2011). In 2011 a vote of no confidence was taken against the chairman of the Supreme Court (the highest appellate court), seen as independent of Yanukovych. Although it failed, his term expired later in the year, and he chose not to run again, coincidentally immediately after a district court dropped criminal charges against his son-in-law (Freedom House 2012).
It is highly likely that were it not for the severe lack of judicial independence in Ukraine, Tymoshenko would not be forced to appeal her conviction to international courts and, in fact, would not have been convicted at all, given the weak nature of the cases and the politicized nature of the prosecution and trial. That the prosecution is highly politicized is the official position articulated by individual European governments, the European Union, the United States, and Russia and is further evidenced by the fact that it was not until her political opponents took power that she was implicated in a murder that took place 15 years prior, an implication that was only made after she lodged a complaint with the European Court of Human Rights appealing her prosecution on abuse of office (European Court of Human Rights 2011). Additionally, the trial itself was marred by practices that an independent judiciary would immediately flag as serious violations: among other blatant problems, the court refused to allow certain defense witnesses to be called and allowed witnesses for the prosecution to testify when counsel for the defense was not present (Pifer Reference Pifer2012).
Linking This to the Assumption of Insurance Models
A key assumption of strategic models of judicial independence dominant in the literature is that courts decrease uncertainties associated with being out of power: independent judiciaries serve as insurance, decreasing the likelihood that a number of negative outcomes come to pass after a leader or party leaves office. Ginsburg’s (Reference Ginsburg2003, 32) conception is that independent courts serve most fundamentally as a “risk-reduction device,” offering post-tenure protection. Ginsburg’s monograph is arguably the most exhaustive treatment of the insurance model, and he goes to great lengths to demonstrate the role that competition played in creating independent courts in Taiwan, Mongolia, and Korea and to explain the variation in the degree to which constitutional courts in these countries were able to assert themselves as independent actors after the establishment of democracy. When it comes to a systematic analysis of whether these courts were effective at providing insurance in the cases studied, however, Ginsburg’s otherwise impressive work is less convincing, offering a handful of cases in which courts ruled against those in power as evidence of the efficacy of insurance.
A critical test of whether a judiciary is able to offer insurance to outgoing leaders is whether said leader is able to save his (or her) skin. Although traditional conceptions of the insurance model focus primarily on policy continuity (Landes and Posner Reference Landes and Posner1975; Ramseyer Reference Ramseyer1994; Ginsburg Reference Ginsburg2003), there is no reason the logic of the framework stops there, as one’s freedom from arbitrary punishment is also an important factor that those formerly in power must consider. In fact, making the traditional assumption of self-interested actors, a leader’s post-tenure fate is the fundamental test of the insurance assumption: most former leaders would find policy continuity a small consolation if they are exiled, imprisoned, or killed, and it is hard to conceive of a judiciary that is willing to protect a former leader’s policies but not the leader herself. In other words, following the insurance logic articulated in the literature, if independent courts are unable to provide insurance for the physical security of leaders after leaving office, we must question the models of political insurance that currently dominate the literature.Footnote 5
An effective test of the assumptions of the insurance model needs to determine whether judicial independence is associated with an outcome that those who might in the future no longer be in power would care about (and whether such an outcome might be minimized by an independent judiciary) but one that is not directly implicated by a strategic or attitudinal model of judicial decision making—in other words, an outcome in which the existence of judicial independence might constrain other noncourt actors from infringing on the rights of those who have recently lost power. Post-tenure fate is just such a test.
III. Data
The two key variables needed to test the assumption of insurance in the manner specified above are the fate of leaders after leaving office (the dependent variable) and the degree to which courts exhibit de facto judicial independence (the independent variable of interest). In this section, I discuss measurement issues for these two variables and the data employed (other covariates and their data sources are discussed briefly in Sec. IV).
Post-tenure Fate
Until recently, comprehensive data on the fate of leaders were unavailable. With the publication of the Archigos data, however, this has changed. These data compile (among other things) the post-tenure fate of leaders of 188 countries for 1875–2004. The Archigos data identify and code the effective ruler of a given polity, here conceived of as the person who asserted de facto control over government. As such, these data do not focus on ceremonial heads of state such as sovereigns in constitutional monarchies or presidents with ceremonial powers such as those in Germany and Estonia (but do in presidential parliamentary systems with strong presidencies, such as France and Russia).Footnote 6
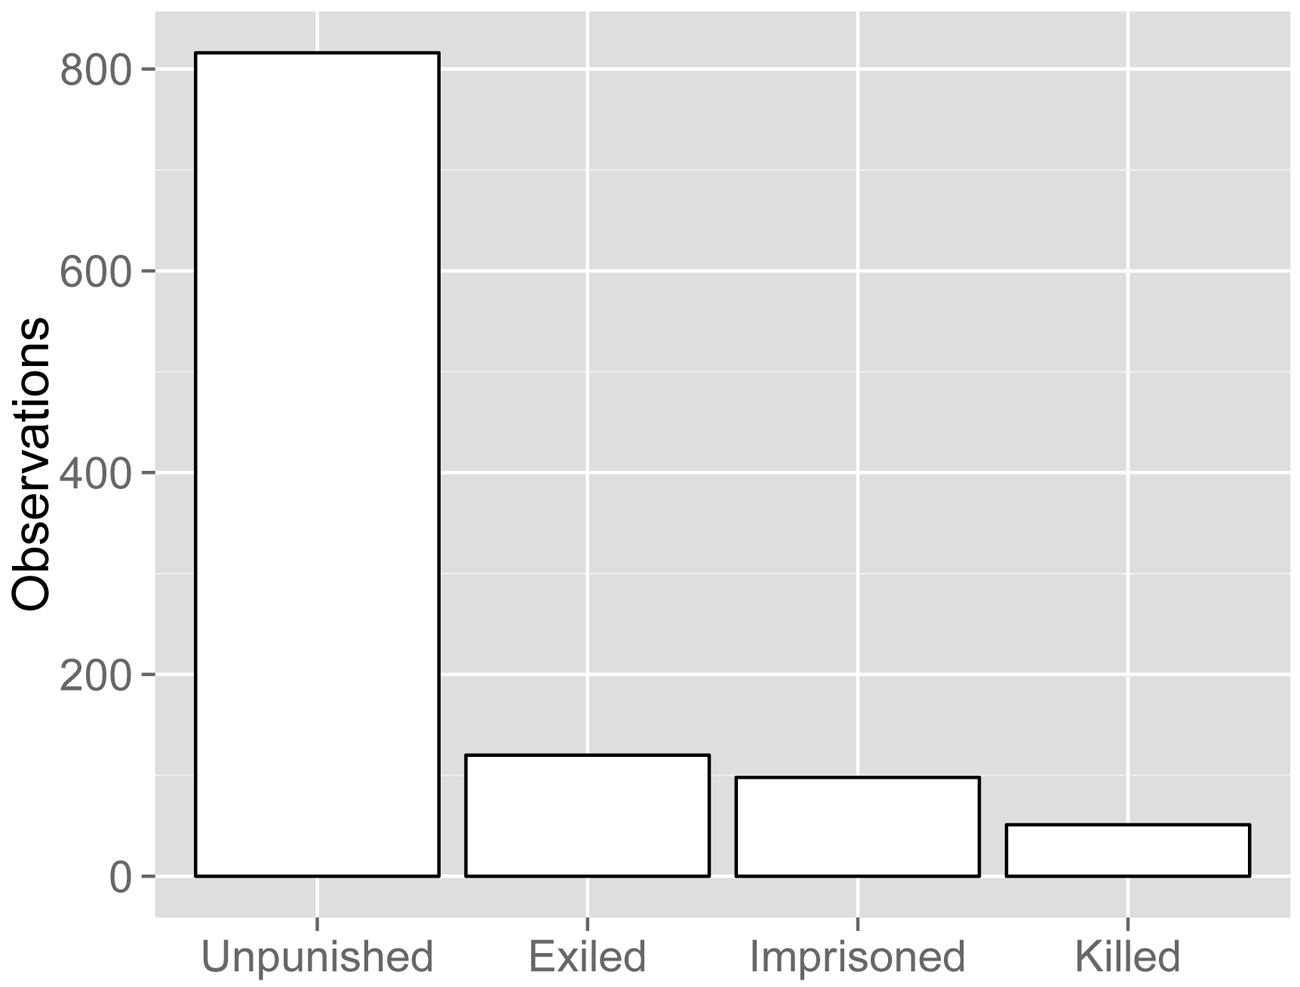
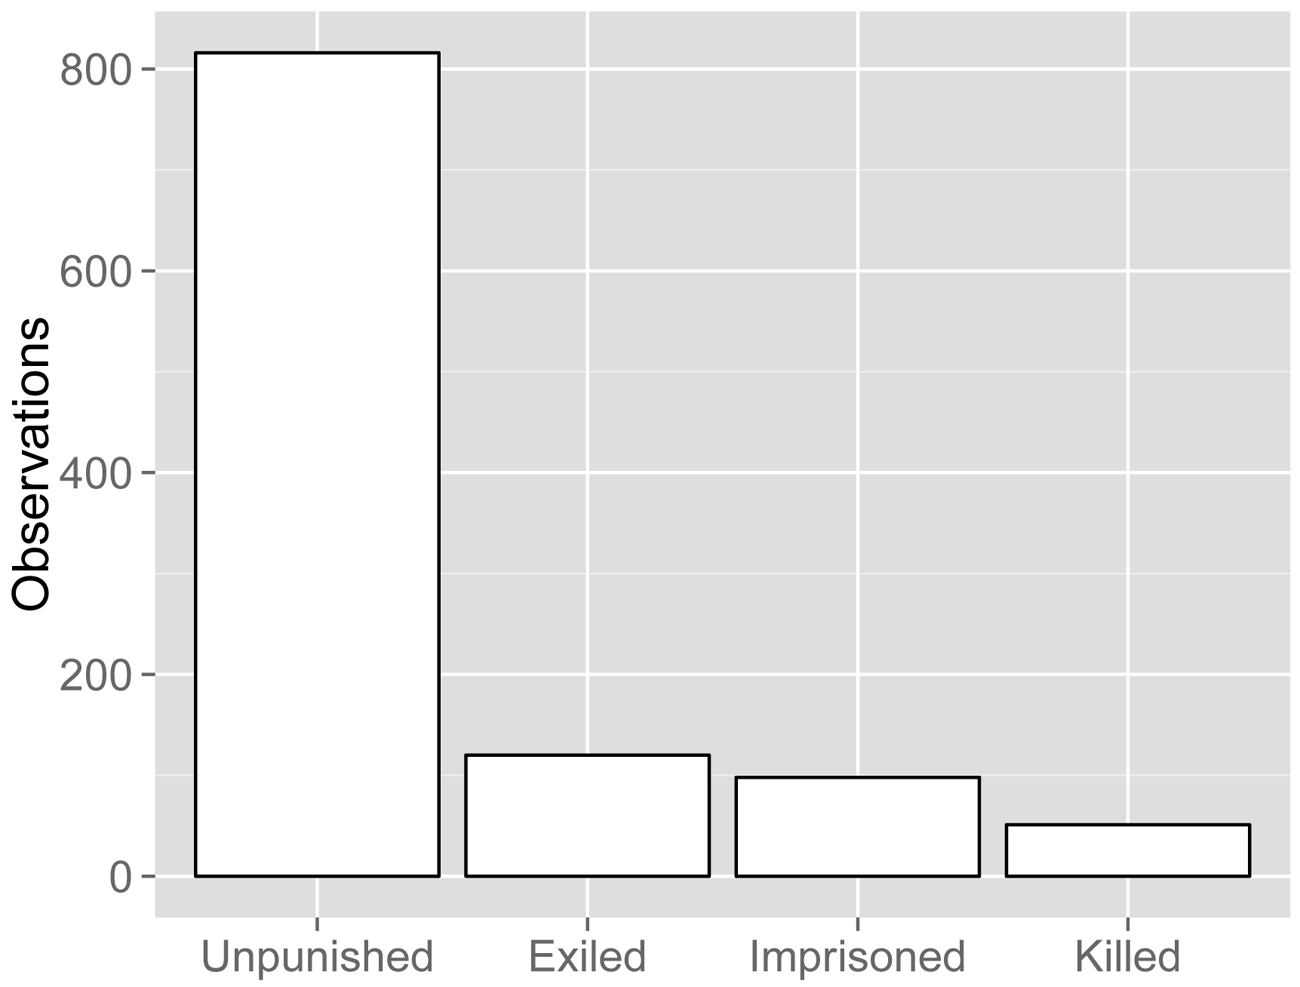
One of the unique features of Archigos is that it does not code observations in a country-year format but rather in a leader-year format, allowing for the analysis of the fate of leaders, rather than countries. For post-tenure fate, the authors’s coding “records one of four types of post-exit fates: when a leader suffers (1) no punishment, (2) is exiled, (3) imprisoned, or (4) killed” (Goemans, Gleditsch, and Chiozza 2009, 273). The coding of this variable is explicitly ordinal, as the authors only code the highest form of punishment any given leader receives (e.g., imprisonment includes house arrest, and therefore a leader put under house arrest before being exiled is coded as having been imprisoned rather than exiled). Figure 1 illustrates the relative frequencies of the four categories of leader outcomes in the Archigos data. As can be seen, while during this period most leaders did not face problematic experiences after leaving power, a full quarter of those who held the highest office were exiled, imprisoned, or killed after leaving office.
Relative frequency distribution of the four categories of post-tenure fate of leaders from 1960 to 2000.
Although the Archigos data classify post-tenure fate in four categories, they need not be used in this manner, and in the next section I analyze these data dichotomously to better understand the relationship between judicial independence and post-tenure fate (analyses using the data in four-category ordinal and multinomial models are presented in the appendix). Thus, I consider all instances of post-tenure punishment (exiled, imprisoned, killed) as one category.Footnote 7 Given the lack of data within each punishment category compared to the “baseline” category of no punishment, there are methodological reasons for doing so. Perhaps more compelling, however, is the theoretical reason: a leader worried about his or her post-tenure fate is likely most worried about any punishment, rather than the specific nature of the punishment imposed by those succeeding in power. Put simply: exile, imprisonment, and execution are unhappy outcomes to be avoided, and insurance if effective would likely be insurance against all forms of extreme punishment. If a leader is “only” exiled, it can probably be said that any insurance policy that he or she hoped an independent judiciary might provide was in fact an insurance policy that could not be collected.
Judicial Independence
The question of how to measure de facto judicial independence has received a not-insignificant amount of attention in recent years (Ríos-Figueroa and Staton 2009). Given the latent and unobservable nature of the phenomenon, a number of alternative measures exist, all with varying temporal and cross-sectional coverage.Footnote 8 Three of these draw on the same underlying data source, the US State Department’s Country Reports of Human Rights Practices, each producing a three-category ordinal measure. These are produced by Howard and Carey (Reference Howard and Carey2004), Tate and Keith (2007), and Cingranelli and Richards (Reference Cingranelli and Richards2010). Three are based on expert or popular surveys: one is produced by a nongovernmental organization, the Fraser Institute (Gwartney and Lawson Reference Gwartney2007); another by the firm Political Risk Services Group (2012); and the third by economists Feld and Voigt (Reference Feld2003). Finally, two others are based on a variety of sources produced by groups of academics, relying on methods such as expert coding and the aggregation of economic data. These are the executive constraints component of the Polity IV measure of democracy (Marshall, Jaggers, and Gurr Reference Marshall and Gurr2003) and the contract-intensive money measure popularized by Clague et al. (Reference Clague1999).
Until recently, researchers were forced to choose one or more of these indicators of de facto independence on the basis of their specific needs and the coverage the indicator was able to offer. As these measures agree in many cases and are correlated with one another, there is reason to suspect the literature is moving in the right direction (Ríos-Figueroa and Staton Reference Ríos-Figueroa and Staton2009). Comparisons across indicators, however, are difficult, given the different nature of the measures (binary, ordinal, and continuous) and their differing coverage. Thanks to recent work by Linzer and Staton (Reference Linzer and Staton2011), the difficult question of which measure to choose has been substantially mitigated. They offer a new measure, based on a heteroskedastic graded response item-response-theory model developed for time series cross-sectional data. It uses the eight common measures of judicial independence outlined above, taking into account missing data and directly modeling the time dependence inherent in the concept. The final value created for each country-year is a value bounded by 0 (minimal independence) and 1 (maximal independence).
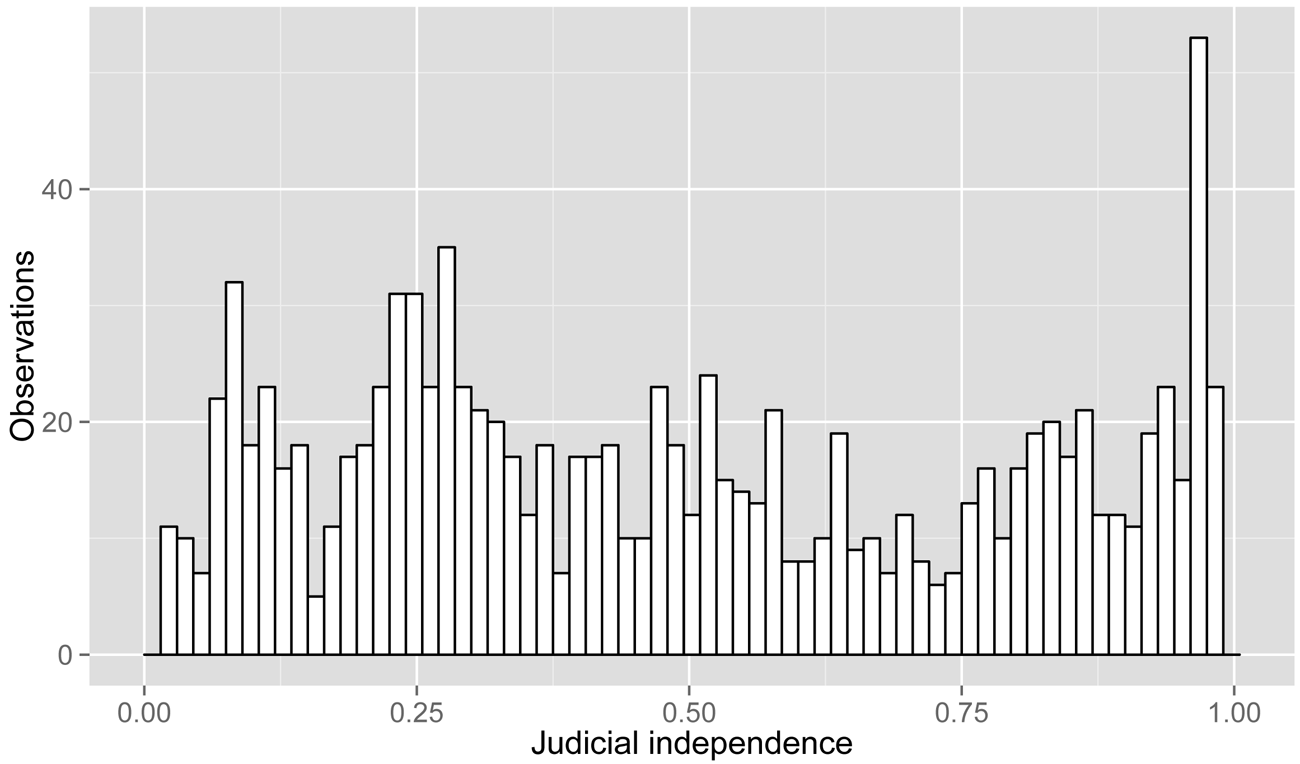
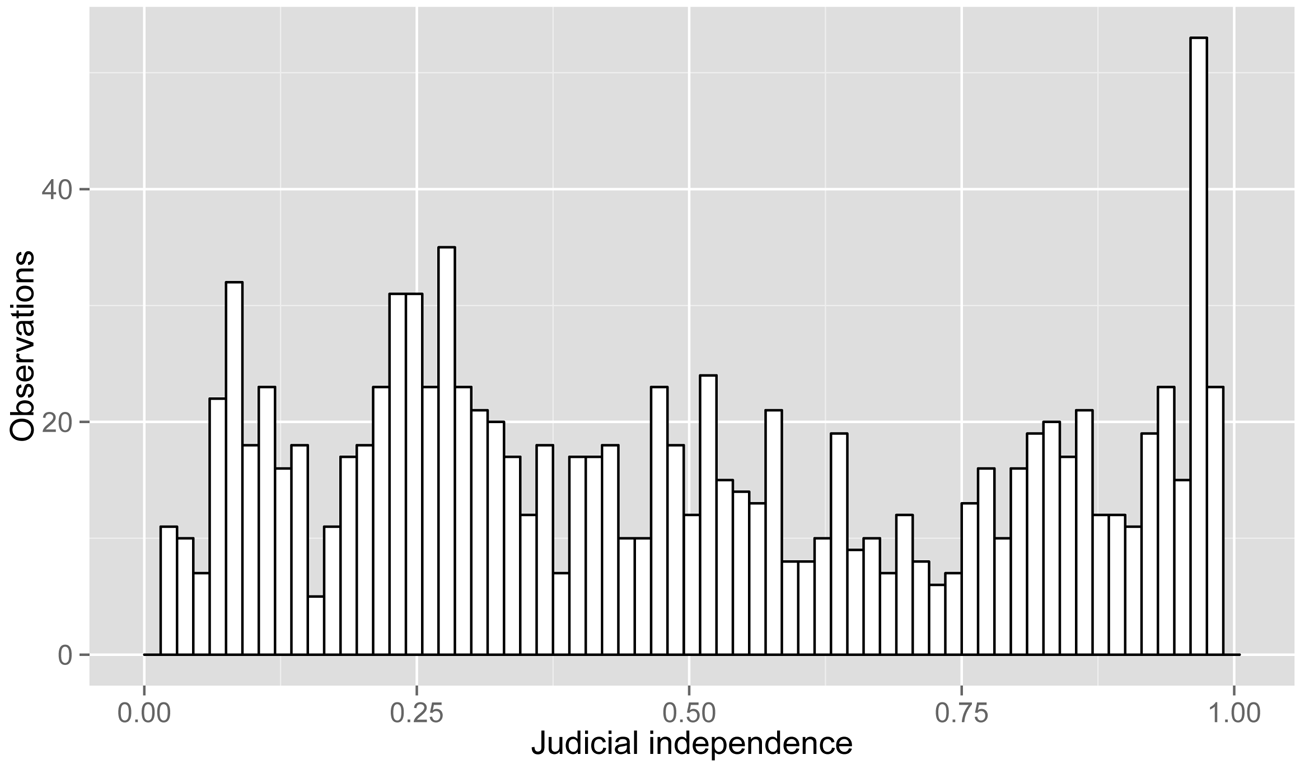
Their measure takes into account a number of concerns that scholars analyzing judicial independence must face and “makes use of the general agreement among the indicators, yet addresses concerns resulting from measurement error and missing data” (Linzer and Staton Reference Linzer and Staton2011, 13).Footnote 9 The measurement model draws on the agreement found between the varying measures in years when they overlap and uses this to better estimate the degree of de facto judicial independence in those years when coverage is only provided by measures with less content validity. Figure 2 plots a histogram of the relative frequency distribution of Linzer and Staton’s measure of de facto judicial independence. It shows that significant variation exists across the value of the measure, with significant portions of observations possessing both low and high levels of independence.
Relative frequency distribution of Linzer and Staton’s (2011) item-response-theory model measure of de facto judicial independence across 1,085 observations.
IV. Data Analysis
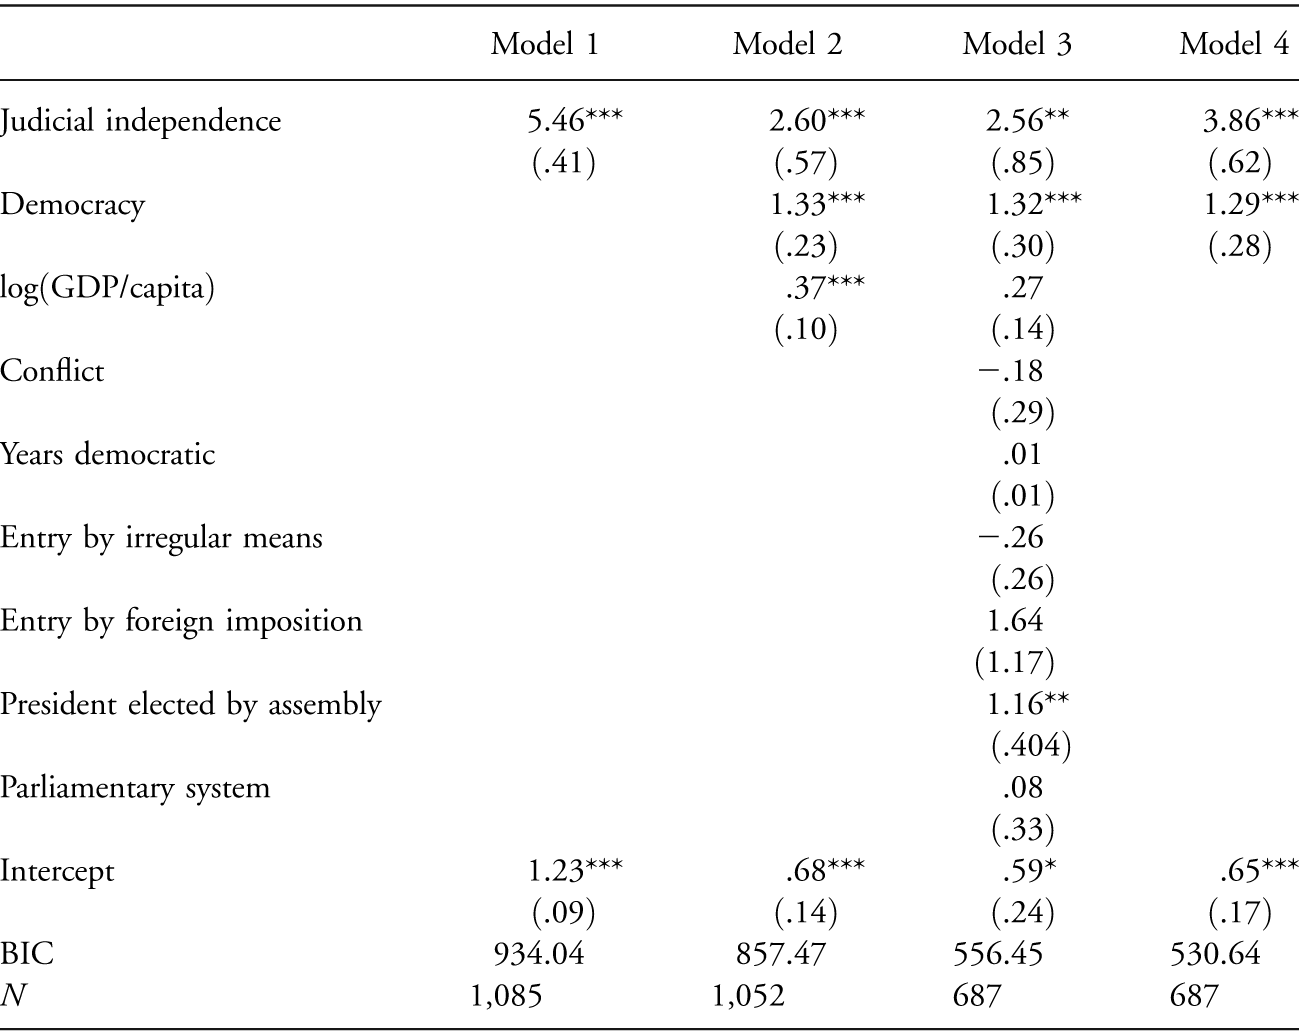
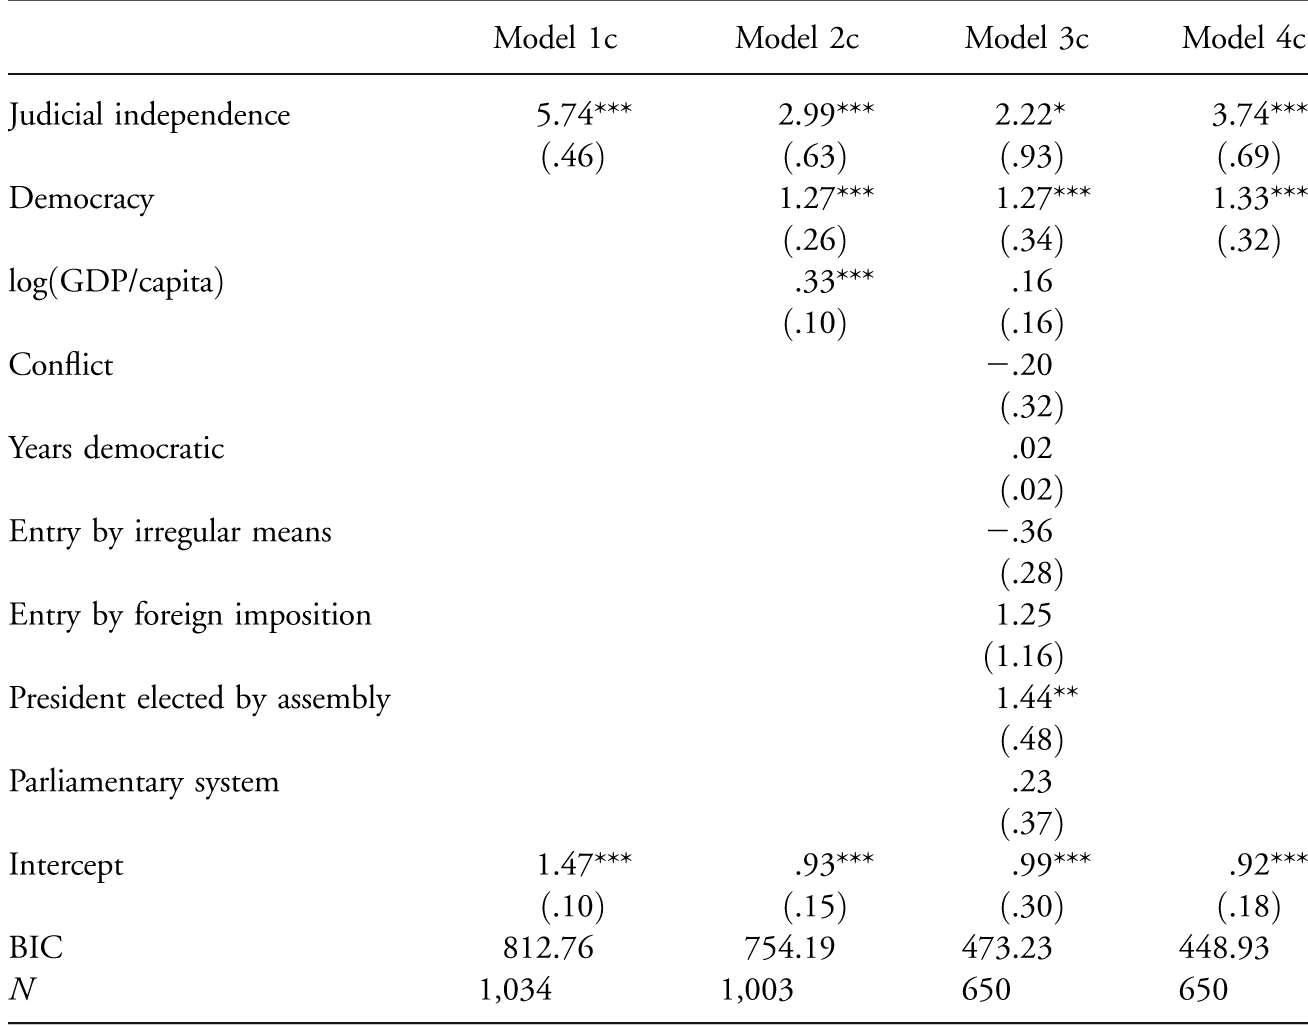
To examine the relationship between judicial independence and post-tenure fate, I collapse the categories of post-tenure punishment coded in the Archigos data set into one category. This creates a dichotomous variable, coded 0 when a leader is punished in the year after power and coded 1 when the leader is unpunished. Table 1 presents the results of four logistic regression models, and the appendix presents ordered and multinomial regressions strongly confirming the results of the dichotomous logistic models presented here.Footnote 10 Each model includes a different combination of covariates that might potentially affect a leader’s post-tenure fate.Footnote 11 Because some of these covariates have limited temporal coverage, the number of observations differs between the models.Footnote 12 Model 1 includes only the Linzer and Staton measure of judicial independence, which is highly significant and positively associated with an unpunished post-tenure fate, providing preliminary support for the hypothesis that independent judiciaries offer political insurance to departing leaders. Comparing across models 2–4 demonstrates that the association between judicial independence and post-tenure fate remains, regardless of the inclusion of other covariates and the concomitant drop in the number of observations.
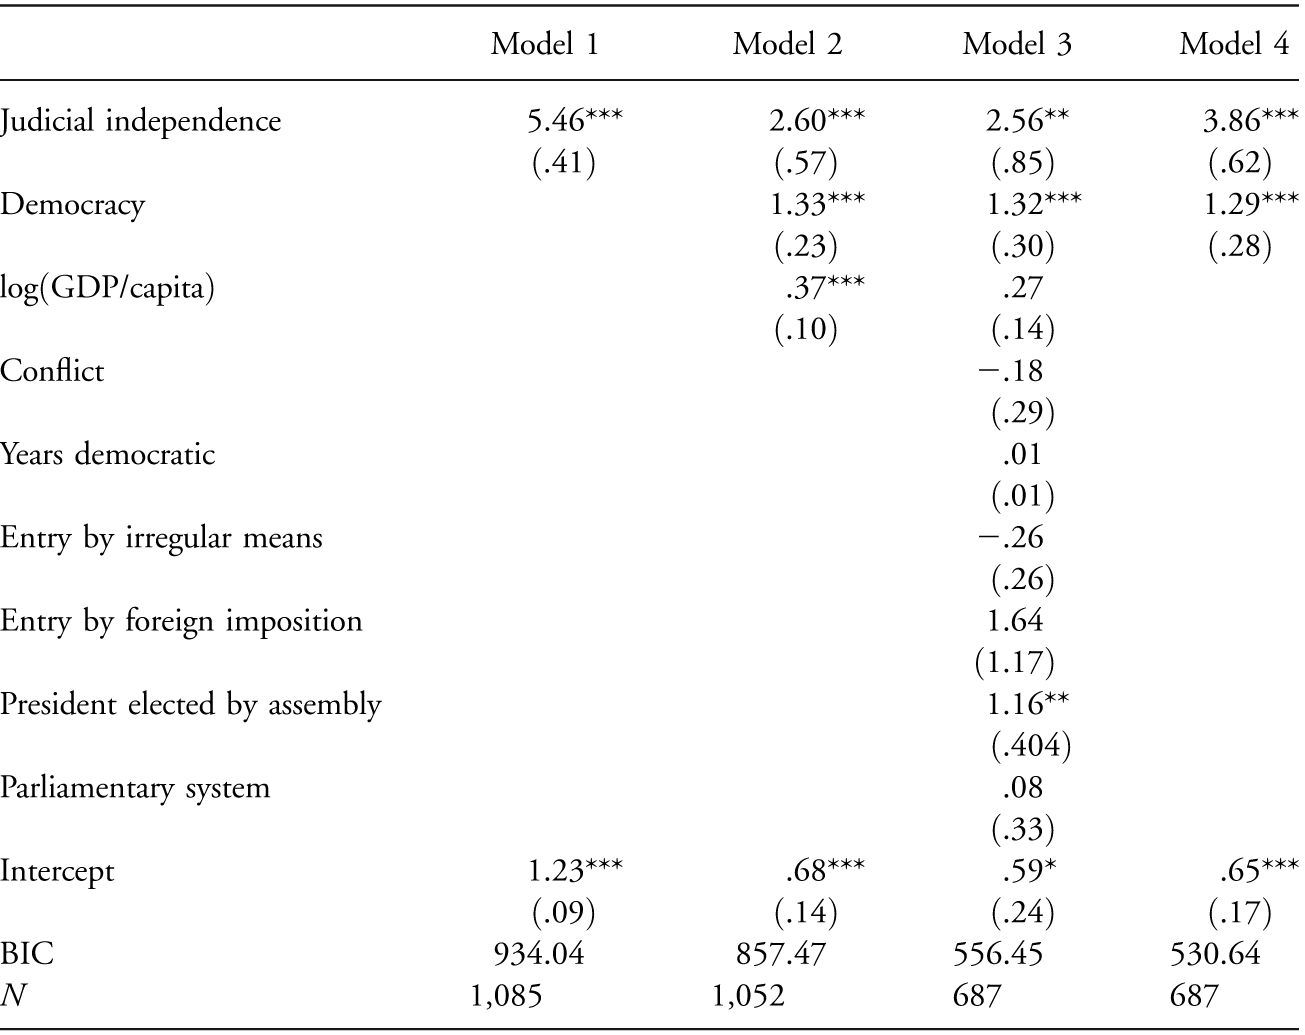
Note.—Four logistic regression models of the post-tenure fate of leaders from 1960 to 2004. Dependent variable measures whether a leader was punished (exiled, imprisoned, or killed) in the year after leaving power. Standard errors in parentheses. GDP = gross domestic product; BIC = Bayesian information criterion.
* p < .05.
** p < .01.
*** p < .001.
As it might be the case that it is not judicial independence itself that is producing the relationship observed in model 1, models 2–4 introduce covariates that might account for post-tenure fate rather than judicial independence. This is most obvious when considering the question of democracy, as it is often conflated with the rule of law and judicial independence, a conflation that many consider problematic (Levi and Epperly Reference Levi, Epperly, Heckman, Nelson and Cabatingan2010; Agrast, Botero, and Ponce Reference Agrast2011). Given that levels of judicial independence are on average higher in democratic states, it might be the case that the relationship between independence and post-tenure fate is spurious, and the results of model 1 are simply due to this omitted variable. Similarly, one might consider that judicial independence is instead just capturing the effect of the nature of the executive: presidential systems witness substantially lower levels of judicial independence than parliamentary systems, and results could thus be driven by the selection mechanism for the executive.
Model 2 thus adds covariates for whether a country is democratic, employing the measure of democracy popularized by Cheibub, Gandhi, and Vreeland (Reference Cheibub and Vreeland2009), as well as a measure of per capita GDP to ascertain whether economic development affects leader fate. The former is included for reasons discussed above and because there is reason to expect that democratic leaders are less likely to be punished than their autocratic counterparts, irrespective of levels of judicial independence, as power transitions in democracies are regularized and far less fraught with uncertainty.Footnote 13 Per capita GDP is included because it is possible that wealthier nations are more stable in general, and thus leaders of wealthy countries should be less likely to find themselves facing post-tenure punishment. Both democracy and development are highly significant and positively associated with an unpunished post-tenure fate.
Model 3 adds a number of other covariates, sharply reducing the number of observations (a result of many not being collected on countries in the 1960s). The first of these is conflict, drawn from the Uppsala/Peace Research Institute of Oslo data, and measures the incidence of major internal or interstate conflict (Gleditsch et al. 2002). Conflict is included because it is plausible that leaders who lose office during civil or international conflict are more likely to find themselves punished than those who leave power in peacetime. The years a country has been democratic, drawn from Alvarez et al. (1996), is included because the regularization of the transition of power in long-standing democracies might lead to lower levels of punishment after leaving office. Finally, two categorical variables are included: the form of leadership entry, drawn from the Archigos data, and the nature of the executive, drawn from the Database of Political Institutions (Beck et al. Reference Beck and Clarke2001). The first of these uses entry by regular means as the reference category and is included because those who enter office outside of the normal channels of assuming power might be more likely to be punished after leaving office. The reference category for the form of the executive is a popularly elected president and is included because it might be that a higher probability of being punished might be one of the many hypothesized perils of presidentialism.
The results of model 3 provide significant support for the main argument forwarded here and little else. In these truncated data, democracies continue to be associated with higher probabilities of an unpunished post-tenure fate, but economic development no longer reaches the p < .05 level of statistical significance. Of the additional covariates, only the nature of the executive attains statistical significance. Here, the only discernible difference is that presidents elected by assemblies are more likely to be unpunished after leaving office when compared to popularly elected presidents (the default category) and prime ministers in parliamentary systems. The lack of any significant difference between presidents and parliamentary executives remains, even if the two types of presidential systems are collapsed into one, and demonstrates that it is not the relationship between parliamentary systems and judicial independence that is driving the strong results seen across the models.
As such, we can conclude that the years a country has been a democracy,Footnote 14 the incidence of conflict, or the manner in which the leader in question took office are not associated with the likelihood the leader will be punished after leaving office. Model 4 uses the smaller number of observations required to estimate model 3 (due to missing data issues as the number of covariates is expanded) and presents the best-fitting model specification according to BIC scores. In this best-fitting specification, the only covariates needed are those for judicial independence and democracy.Footnote 15 These results provide further evidence for a strong relationship between judicial independence and democracy and the likelihood of post-tenure punishment.
A possible alternative explanation for the results found in table 1 could be characterized as a “bad leader/bad system” explanation. Here, in those systems in which leaders act in a lawless fashion generally, there is unlikely to be judicial independence, and because of the lawless nature of rule, they are more likely to be punished. While the models presented cannot fully adjudicate between these two explanations, the results provide more evidence for the hypothesis forwarded in the article. This is because in polities where leaders act lawlessly—and are thus more likely to be punished—judicial independence is not the only thing that should suffer: we should also see significantly lower levels of economic development, no long-standing democracy, and especially more entry into power by irregular means, and as a result these should also be strongly associated with the dependent variable. Given that these other covariates that should also capture the lawfulness or quality of a political system (for lack of a better term) fail to show any relationship with the dependent variable, support for this alternative explanation is weak.
A potential limitation of the Archigos data set for my purposes is that it assigns leaders who are executed after losing power and those who are assassinated the same fate. The logic presented here suggests that independent courts can serve as an insurance mechanism because they make politicized prosecution less likely. If such prosecutions at times lead to executions, the utility of courts according to this argument is clear. The utility of an independent court in preventing an assassination, however, is far from clear. As the data conflate execution and assassination, it is possible that this conflation affects the inferences of the models. Conducting the analysis while excluding those who were killed from the punished post-tenure fate category produces no meaningful differences, however (results are presented in the appendix): coefficients of covariates are highly similar, and in no instance does a covariate become or cease being statistically significant.
Model Visualization
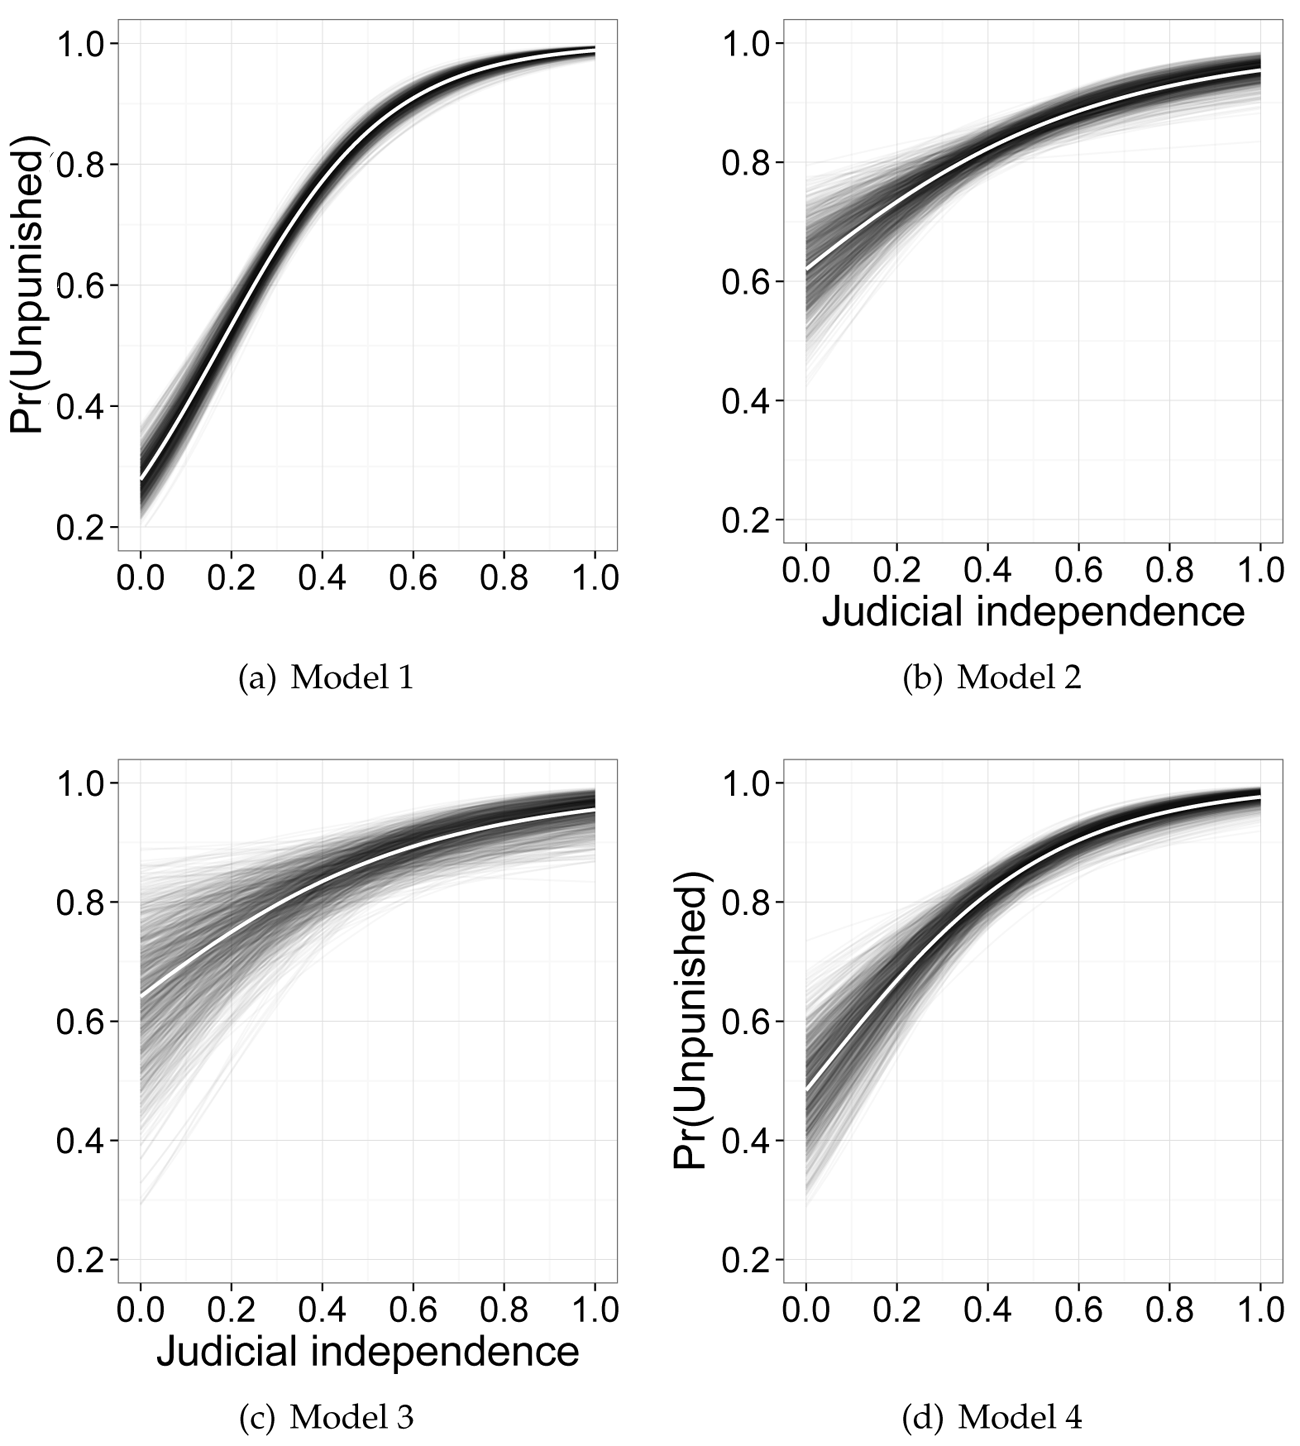
Because interpreting coefficients in nonlinear models is not straightforward, I plot the expected probability of a leader’s unpunished post-tenure fate for models 1–4 in figure 3. In each plot, the value of judicial independence is allowed to vary from its observed minimum (0.02) to its observed maximum (0.99), while all other covariates are held constant at their mean values.Footnote 16 Rather than use the conventional method, which employs confidence intervals drawn simply from the standard errors of the estimates, I plot individual model fits drawn from simulation, along with the mean of these simulations.Footnote 17
Expected probability of a leader not being punished at different levels of judicial independence when other covariates are held at their mean values for models 1–4. All simulations for each level of judicial independence are plotted with transparency, with the mean value across all simulations plotted with a white line. Where little variation exists around the mean, the plotted values appear darker; where significant variation exists, they are more spread out, appearing lighter.
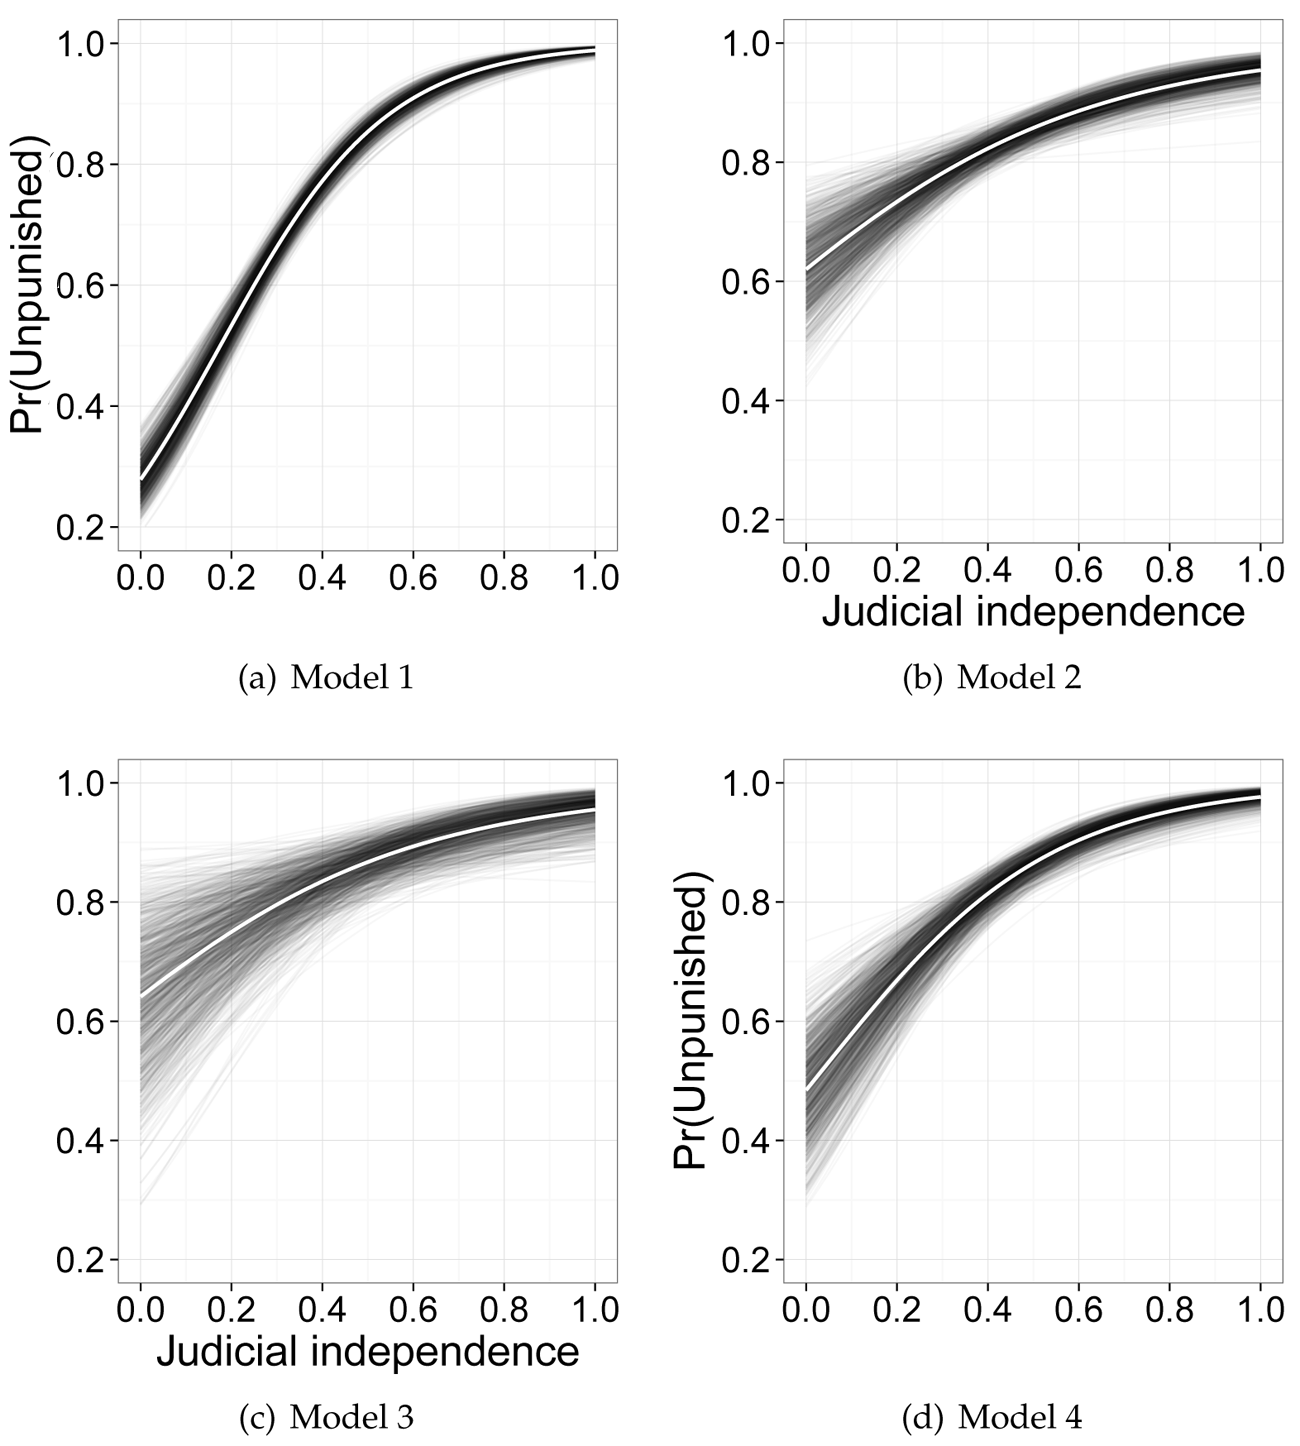
The plots in figure 3 show the expected probability of an unpunished post-tenure fate for models 1–4 when judicial independence is allowed to vary and other covariates are held constant, providing a general sense of the substantive significance of judicial independence when the model and data vary. Every simulated value is plotted in transparent gray, including those falling beyond the 95% confidence intervals. The result is shaded bands of varying intensity showing the range of implications of the model: when there is significant overlap between the simulated values, they are dark gray to black. This is most obvious at the right end of the X-axis, where the variance of simulated values is small. Because at any point along the X-axis the same amount of “ink” is being used to plot the individual simulations, the lighter gray areas are those in which the simulations show more variance; the ink is covering a larger area and is thus lighter. On top of these I plot in white the mean of the 1,000 simulated observations at each level of judicial independence as a solid white line. Comparing plot a with plot c best illustrates the variance around the mean. In plot a, the small variance in the simulations almost produces one thick black line (with a white line inside it showing the mean) all along the X-axis. In plot c, however, significant variation among the individual simulations (a function of randomly drawing parameters for nine covariates) means the band of simulations around the white line is more diffuse.
Across all the models, we see a clear trend as judicial independence increases: the probability of not being punished after leaving office increases rapidly. When judicial independence is approximately 0.6, the probability of an unpunished fate reaches 0.9, and by the time judicial independence is at its maximum, in none of the models is the probability of being unpunished less than 0.95. Similarly, at this maximum level of independence, even the lowest bounds of the plotted simulations (which are not restricted to observations falling within 95% confidence intervals) are above 0.9 in every model except the poorly fitting model 3. The results shown in table 1 and figure 3 provide strong support for the contention that judicial independence can provide effective insurance against unpleasant outcomes after leaving power, even when accounting for the level of democracy or development, conflict, the nature of the executive, or the manner in which the leader in question assumed power.
A Further Test of the Argument
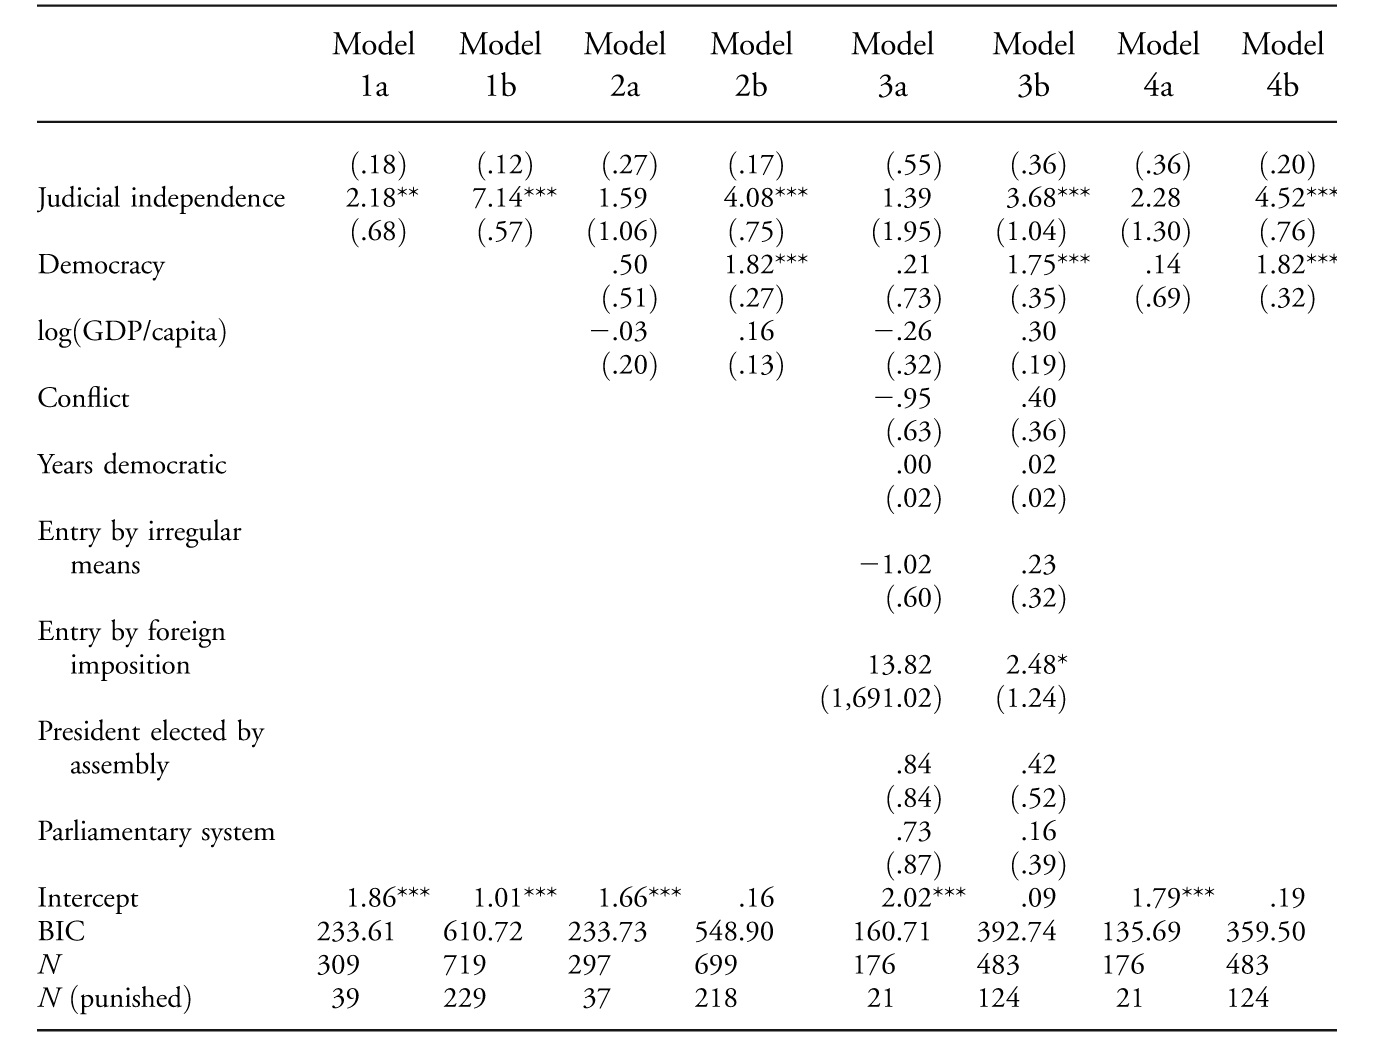
One of the further empirical implications of the argument presented is that there should be a difference between how judicial independence is associated with post-tenure fate when those replacing a former leader are from the same party. If my argument holds, we should expect that independence is more important when a leader is replaced by an opposition figure. The reason behind this is simply that when a leader is replaced my members of her own party, the need for insurance against post-tenure punishment should be much lower and, often, nonexistent. Here, a new leader of his or her own party would include new prime ministers or presidents hailing from the same party and, for nonelected leaders, those hailing from the same ruling circle, be it a family in a monarchy or a fellow junta member in a military dictatorship (presuming the leader left office regularly and was not deposed in a coup). While on occasion we might expect a leader who engaged in particularly egregious actions while in office to be punished if replaced by his own people, on balance any incentives that those in power have to punish former leaders should be less when the leader is of the same party, for both loyalty reasons and because associating the party with individuals punished for crimes in office is bad publicity. This is clearly supported by the percentages of leaders who faced post-tenure punishment in 1960–2004: only 14% of leaders replaced by their own party were punished after leaving office, while 47% of those replaced by their opponents faced post-tenure punishment.
To determine whether independent judiciaries are more strongly associated with an unpunished post-tenure fate after the opposition assumes power, table 2 reanalyzes the models presented in table 1 across two subsets of data. The first subset includes only those instances in which the leader in question was replaced by a member of her own party (denoted as models 1a–4a); and the second, only when the replacement was an opposition figure (models 1b–4b). The results are strongly consistent with the hypothesis forwarded in this article: across all models (varying covariates and thus data), judicial independence is statistically significant and positively associated with an unpunished post-tenure fate when a leader is replaced by the opposition. In fact, the magnitude of the effect in models 1b–4b is higher than in models 1–4 in table 1, as the coefficient for judicial independence is substantially larger when only analyzing the opposition subset. When opponents take power, more independent courts mean a lower probability of punishment. However, when the models are fit to data looking at the post-tenure fate of leaders replaced by their own party (models 1a–4a), the estimated coefficient of judicial independence is always less than a comparable model fit to data in which an opponent replaces a leader. In addition, in only the first of these four models does judicial independence reach conventional levels of statistical significance, likely in part because of the small number of observations in which a leader replaced by her own party is punished.
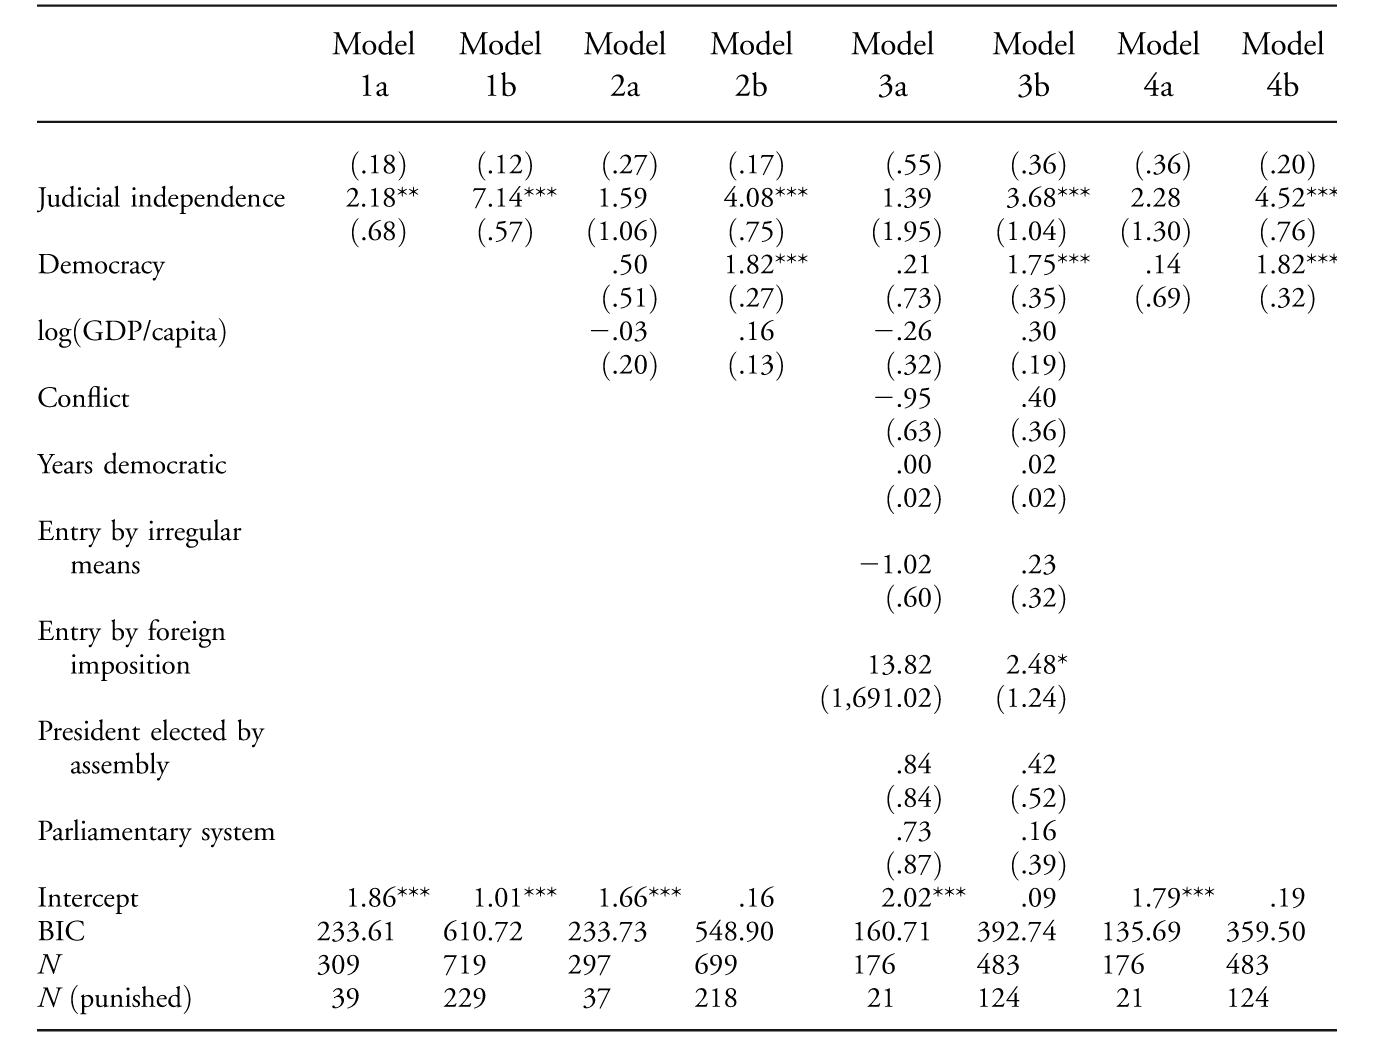
Note.—Four pairs of logistic regression models of the post-tenure fate of leaders from 1960 to 2004. Each model is comparable to the models reported in table 1, except that the data to which the model is fit are a subset consisting of cases in which the leader was replaced by either (a) a member of her party or (b) opponents. Standard errors in parentheses. GDP = gross domestic product; BIC = Bayesian information criterion.
* p < .05.
** p < .01.
*** p < .001.
In other words, although those replaced by their own party are as a whole less likely to be punished after leaving office, the role of judicial independence in insuring this is not nearly as obvious or robust as when one is replaced by an opponent. These results provide further support for the mechanism hypothesized here, that independent courts serve to minimize the success of arbitrary punishment as well as deter attempts to politicize justice.
V. Conclusion
The key finding presented here is that independent courts are strongly associated with a lower probability of a leader being punished after leaving office, providing strong support for the hypothesis that independent courts minimize the likelihood of politicized prosecutions and extrajudicial punishment of former leaders. This finding has important implications for popular strategic models of judicial independence, which assume that independent courts can provide insurance to those facing an exit from office and are thus attractive in contexts of high political competition. The descriptive accuracy of this assumption is critical to strategic models of judicial independence. If independent judiciaries do not offer leaders insurance against undesirable outcomes after losing power, there is no incentive for leaders facing significant political competition to respect judicial independence. The logic of leaders empowering minoritarian institutions capable of constraining their policies holds only when the minoritarian institutions provide benefits after leaving office. Despite this, the assumption has remained unexamined to date, even though strategic models have become the leading framework for explaining judicial independence (VonDoepp and Ellet 2011).
In this article I test my argument and the assumption of strategic models through a novel approach, employing data on leaders used primarily in international relations scholarship (Debs and Goemans Reference Debs2010). In doing so, I show that judicial independence is a strong predictor of the post-tenure fate of leaders. These results are both highly statistically and substantively significant and, furthermore, hold despite the inclusion of covariates and considerable shrinkage in sample size due to their temporal limitations (the appendix presents further evidence that these findings hold across a variety of model specifications, including ordered and multinomial logistic regression). Across models, judicial independence far surpasses the conventional 0.05 level of statistical significance, suggesting that independence is highly associated with post-tenure fate. Figure 3 illustrates the substantive importance of judicial independence. Clearly, at the highest levels of independence, the likelihood of a leader being punished after leaving office approaches zero. Comparably, the average first-difference change in the probability of an unpunished post-tenure fate across models 1–4 when judicial independence moves from 1 standard deviation below the mean to 1 above is 0.23. Given that the baseline probability of an unpunished fate (given the distribution of post-tenure fate in the data) is 0.75, such a change shows that the effects of independence are remarkable. As such, this article offers a fundamental contribution to the study of judicial independence, illustrating an additional important benefit provided by independent courts. It furthermore provides the first empirical support for one of the core theoretical assumptions of the dominant explanation—the assumption that courts do in fact provide political insurance—in the current literature on the phenomenon.
In those cases in which judicial independence is nonexistent or weak, the likelihood that a leader is punished after leaving office is significantly higher than in cases in which independence is strong, suggesting that independent courts are able to serve as an effective insurance policy. Two possible mechanisms of insurance are consistent with the findings, neither of which is exclusive of the other. First, independent courts could serve as an ex post check on politicized punishment by those who recently assumed power, by ruling against any such punishments. Alternatively, strong and independent courts might serve as an ex ante check, deterring those recently in power from attempting to punish their predecessors. Most likely, they are both important mechanisms and mutually reinforcing: successful ex post rulings checking executive power should only make ex ante deterrence all the stronger, and strong ex ante deterrence should make occasional attempts to politicize justice and punish previous officeholders all the more glaring. Although my analysis cannot determine under what conditions these two possible mechanisms of insurance might obtain or reinforce one another, an examination of such is an avenue for fruitful future research, with important implications for understanding when and how courts can serve as checks on the political branches of the state.
Appendix
Information on the goodness of fit of the models presented in table 1 and the results of ordinal and multinomial model specifications are included here.
Goodness of Fit
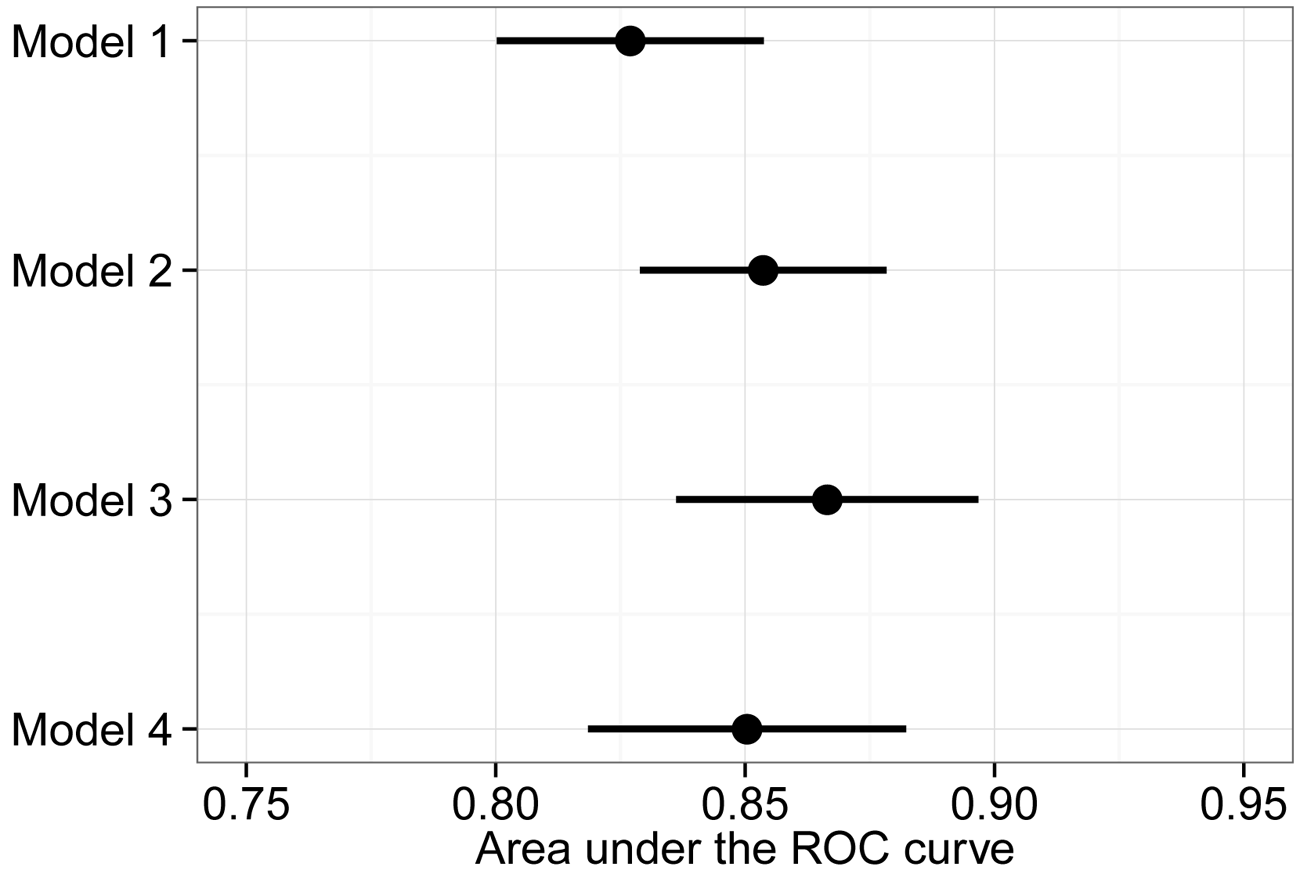
One evaluation of the goodness of fit of dichotomous models compares instances when the model predicts an outcome correctly against when it predicts an outcome incorrectly, examining true and false positives and true and false negatives. One problem in doing so, however, is deciding at what threshold of probability to classify a prediction as either false or negative. To account for this, I use the receiver operating characteristic (ROC) curve, which looks at the true positive versus false positive rate across the range of possible (0–1) thresholds. Figure A1 shows the area under the ROC curve for models 1–4 from table 1. Horizontal lines show 95% confidence intervals around the point estimates for each model (the circles).Footnote 18
Estimates and 95% confidence intervals of the area under the receiver operator characteristic (ROC) curve for models 1–4 from table 1. Area under the ROC curve is typically considered an effective means of gauging the true versus false positive (sensitivity vs. specificity) rate across different thresholds of probability.
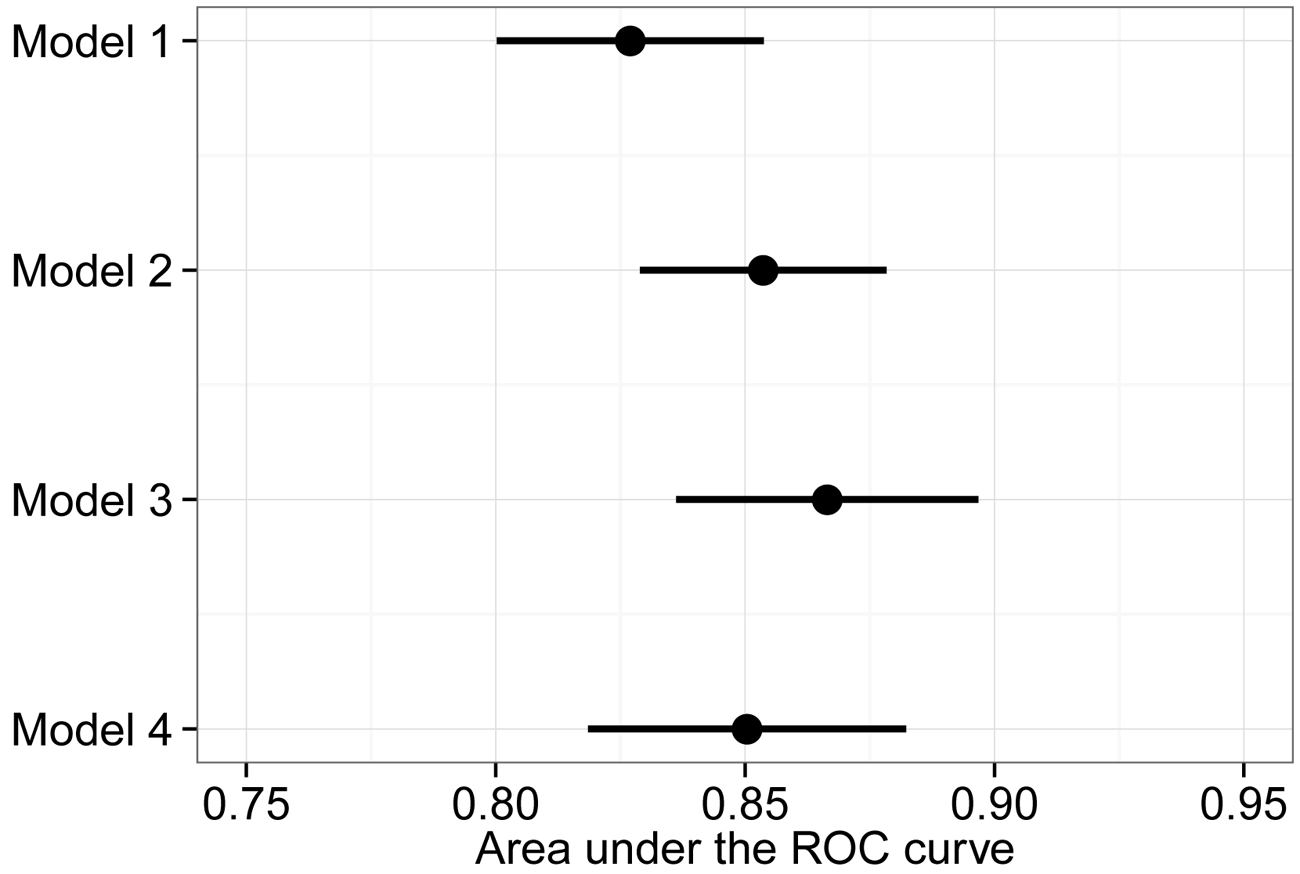
The area under the curve estimates and their confidence intervals are plotted, rather than the actual curves themselves, because of the close results across model specification (although, again, comparing directly across models is not always possible due to the different data used to fit them). An area under the curve of 0.5 is equivalent (with a large enough sample) to random guessing—half the predictions should be true positives and half false positives. Areas less than 0.5 fit worse than random chance, and those more than 0.5 fit better, with an area approaching 1 being a perfect (always true positives, never false) fit. As we can see in figure A1, the area under the curve across models is nearly identical: the point estimates are tightly packed between 0.83 and 0.87, and it is impossible to distinguish statistically between these ROC curves, as the 95% confidence intervals overlap (significantly). In other words, we can determine how well each model fits the data used to generate it by this procedure, but we are unable to use the procedure to select a best-fitting model—but again, the statistically significant BIC scores reported in Section IV do allow us to do so for those models fit on the same data.
A second way to evaluate goodness of fit is by cross-validation. Cross-validation examines model fit on the basis of out-of-sample predictive accuracy. Rather than collect new data, a researcher instead partitions data she has into two separate data sets. The first is used as a “training,” or “fit,” set. Here, a model is created in the same manner as traditional quantitative analysis. The estimates from this model are then used on the second “test” set of data. As the data in this test set were themselves not used to derive model estimates, the model is thus being tested out of sample. A researcher can then use the differences between the model fit in the training and test sets to determine the degree to which the model is capturing the underlying data-generating process (Ward, Siverson, and Cao 2007). If the model fit out of sample is comparable to the model fit in sample, evidence exists that the model fits the underlying empirical process of interest that generated the data.
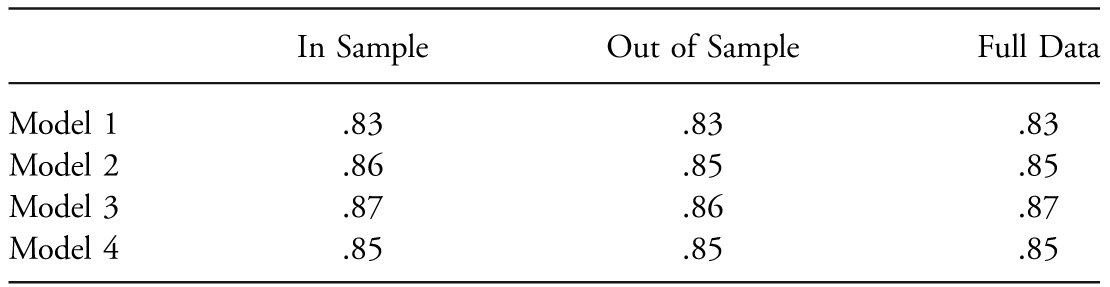
Table A1 presents the results of cross-validation of models 1–4 in table 1. Data used for each of these models were partitioned into two equal sets, and table A1 reports estimates of the area under the ROC curve for the in-sample and out-of-sample fits, as well as the full data used in the reported model. The results show that models fit as well out of sample as they do on the data used to generate them, providing evidence that the models accurately capture the underlying data-generating process.
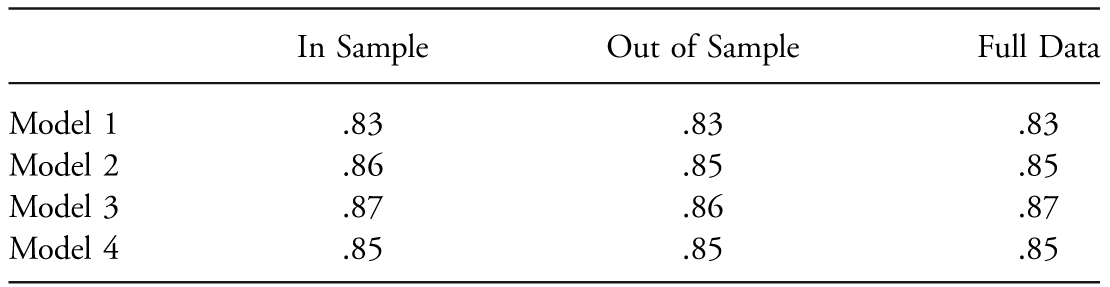
Note.—Area under the receiver operating characteristic curve results for cross-validation of models 1–4 in table 1. Data used for each model were randomly partitioned into two sets, and the estimates used in the first data set were used to fit the data in the second, allowing one to ascertain out-of-sample predictive accuracy. Full data results are presented for reference.
Excluding the Killed Category
As noted in the main article text, one potential limitation of the post-tenure fate variable in the Archigos data is that it assigns the same outcome category (killed) to those who are executed and those who are assassinated. While the importance of independent courts for preventing the former is obvious, it is far from obvious how an independent court might affect the likelihood of assassination. Because the data used in the models presented in table 1 conflate these two outcomes, I also conduct analysis on the Archigos data when removing the outcome category of killed.
The analysis presented in table A2 is restricted to comparing the probability of being unpunished with that of exile and imprisonment aggregated together. Comparing the results in table A2 to those found in table 1 suggests that including or excluding observations in which a leader was either assassinated or executed has little effect on the overall model (table A4 presents multinomial logit results that confirm this).Footnote 19 In no instance does a covariate become statistically significant or insignificant, and the coefficients of the estimates change only slightly. In addition, the difference between the BIC score of model 3a and the restricted version model 4a is again highly statistically significant, suggesting that the restricted model excluding the killed category is also the preferable model. The overwhelming similarity of the models in tables 1 and A2 provides further support for the arguments forwarded here and confirms that the results are not biased by the conflation of execution and assassination or the inclusion (or exclusion) of the killed category.
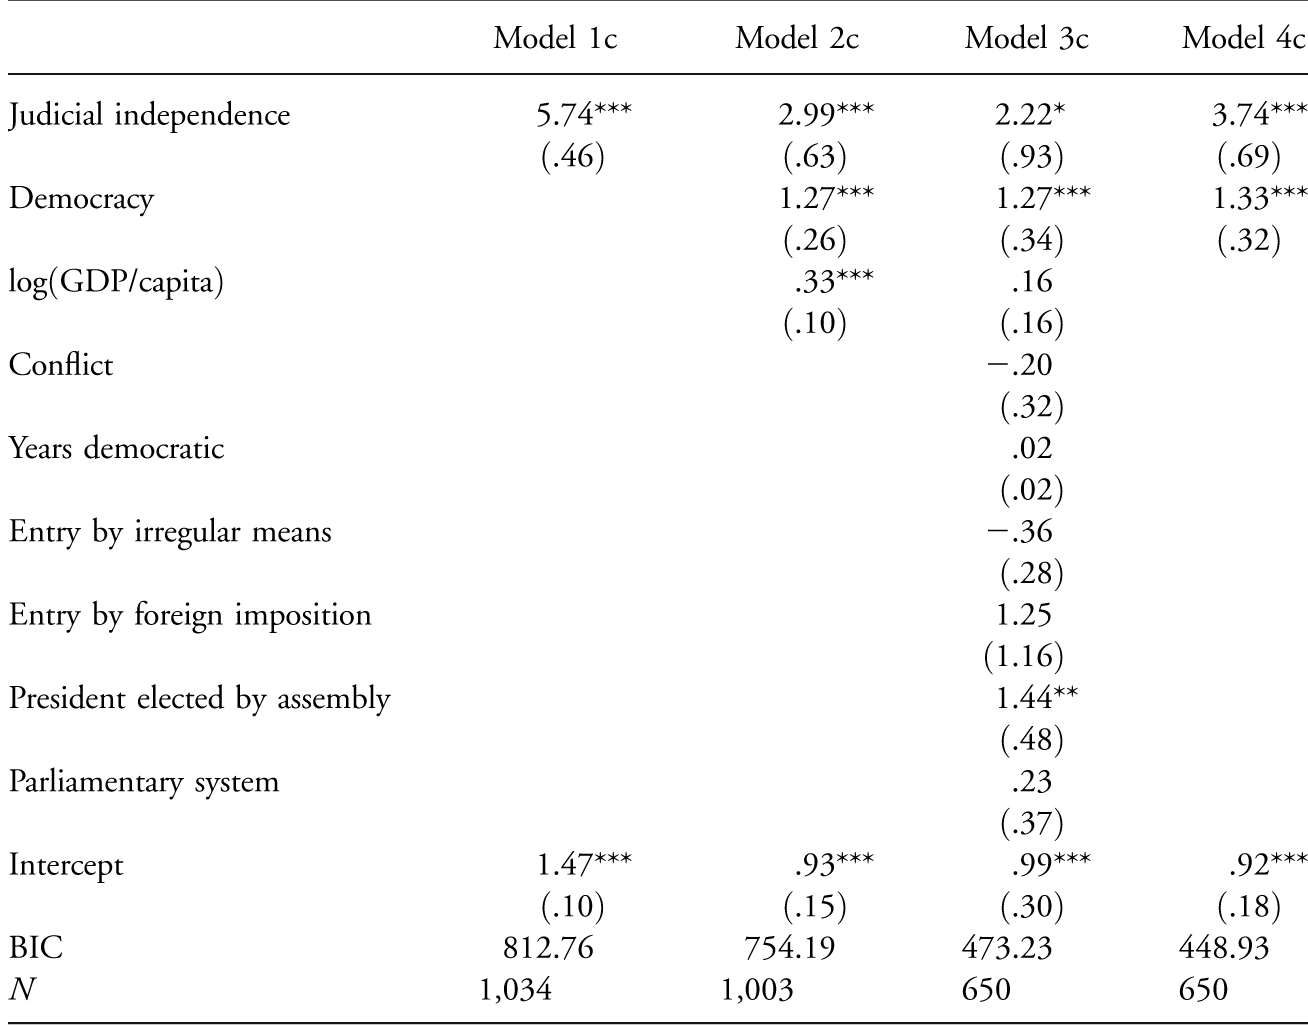
Note.—Four logistic regression models of the post-tenure fate of leaders from 1960 to 2004. Each model is comparable to the models reported in table 1, except that in each case the killed category is excluded from the analysis. Standard errors in parentheses. GDP = gross domestic product; BIC = Bayesian information criterion.
* p < .05.
** p < .01.
*** p < .001.
Ordered Logistic Regression
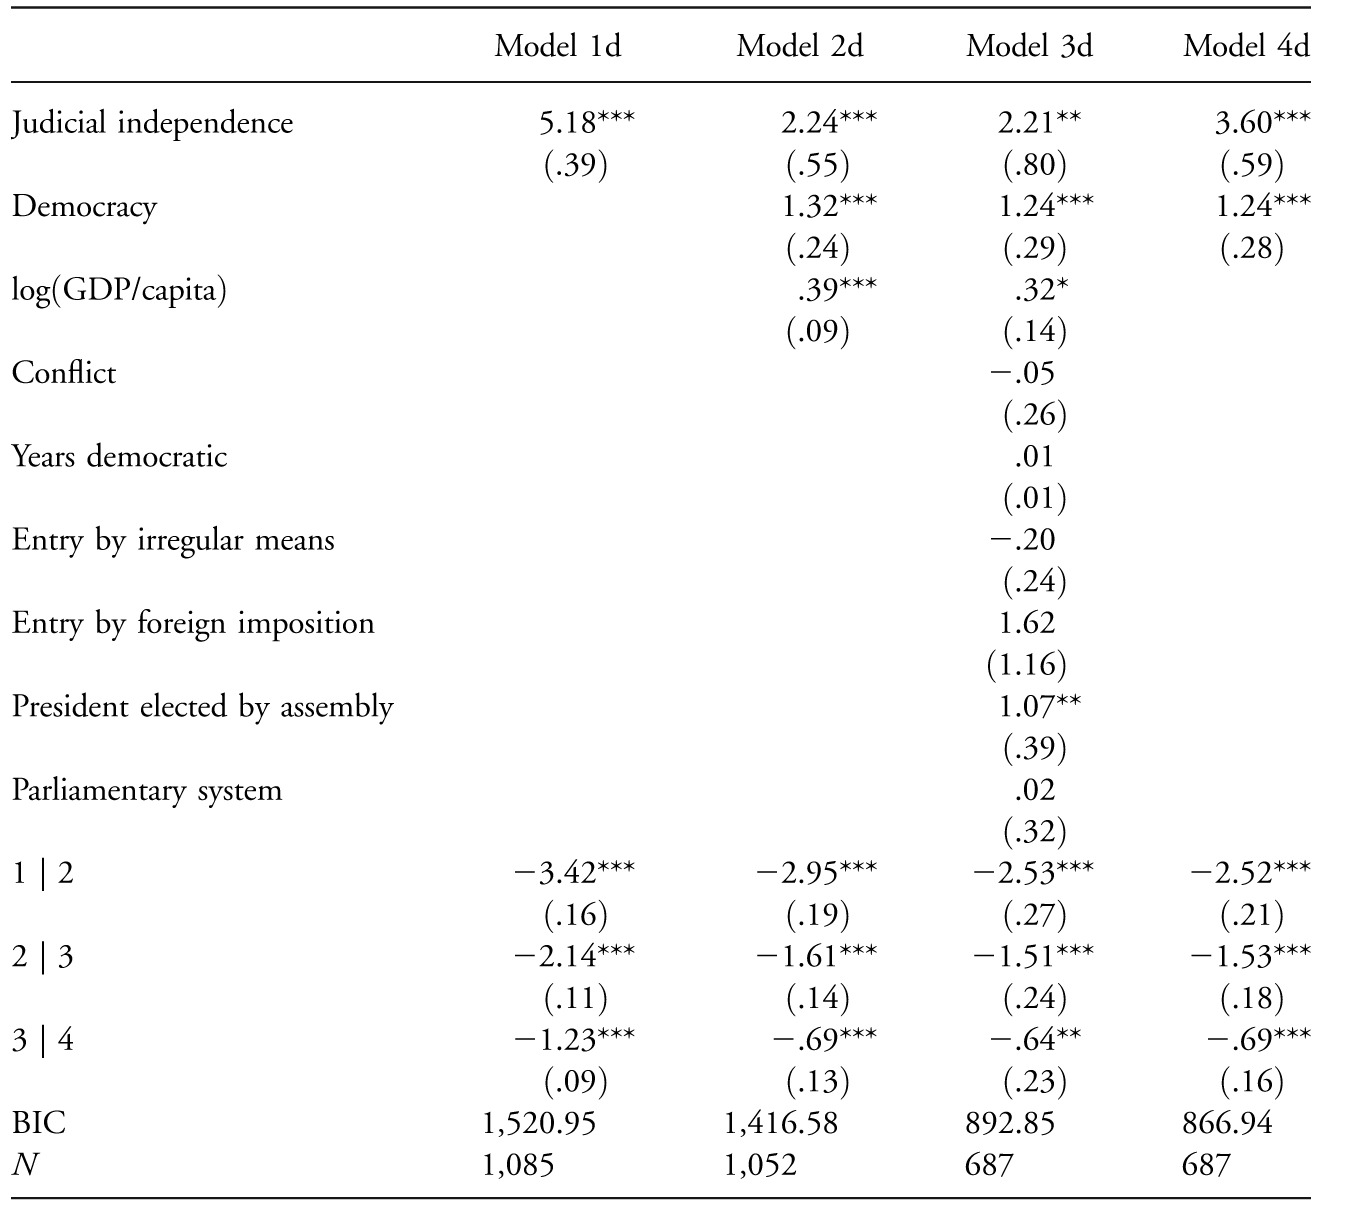
The post-tenure variable from the Archigos data is originally coded as a categorical measure, with ordered values of unpunished, exiled, imprisoned, and killed. Discerning between the differences in an ordered logistic regression model is another stringent test of the insurance hypothesis, due to the relative infrequency of leaders being imprisoned or killed after leaving power, rather than being unpunished. Table A3 shows regression output for four ordered logistic regression models of the post-tenure fate of leaders. Each is comparable to the models presented in table 1 with regard to covariates and observations, instead using an ordinal rather than dichotomous structure.Footnote 20
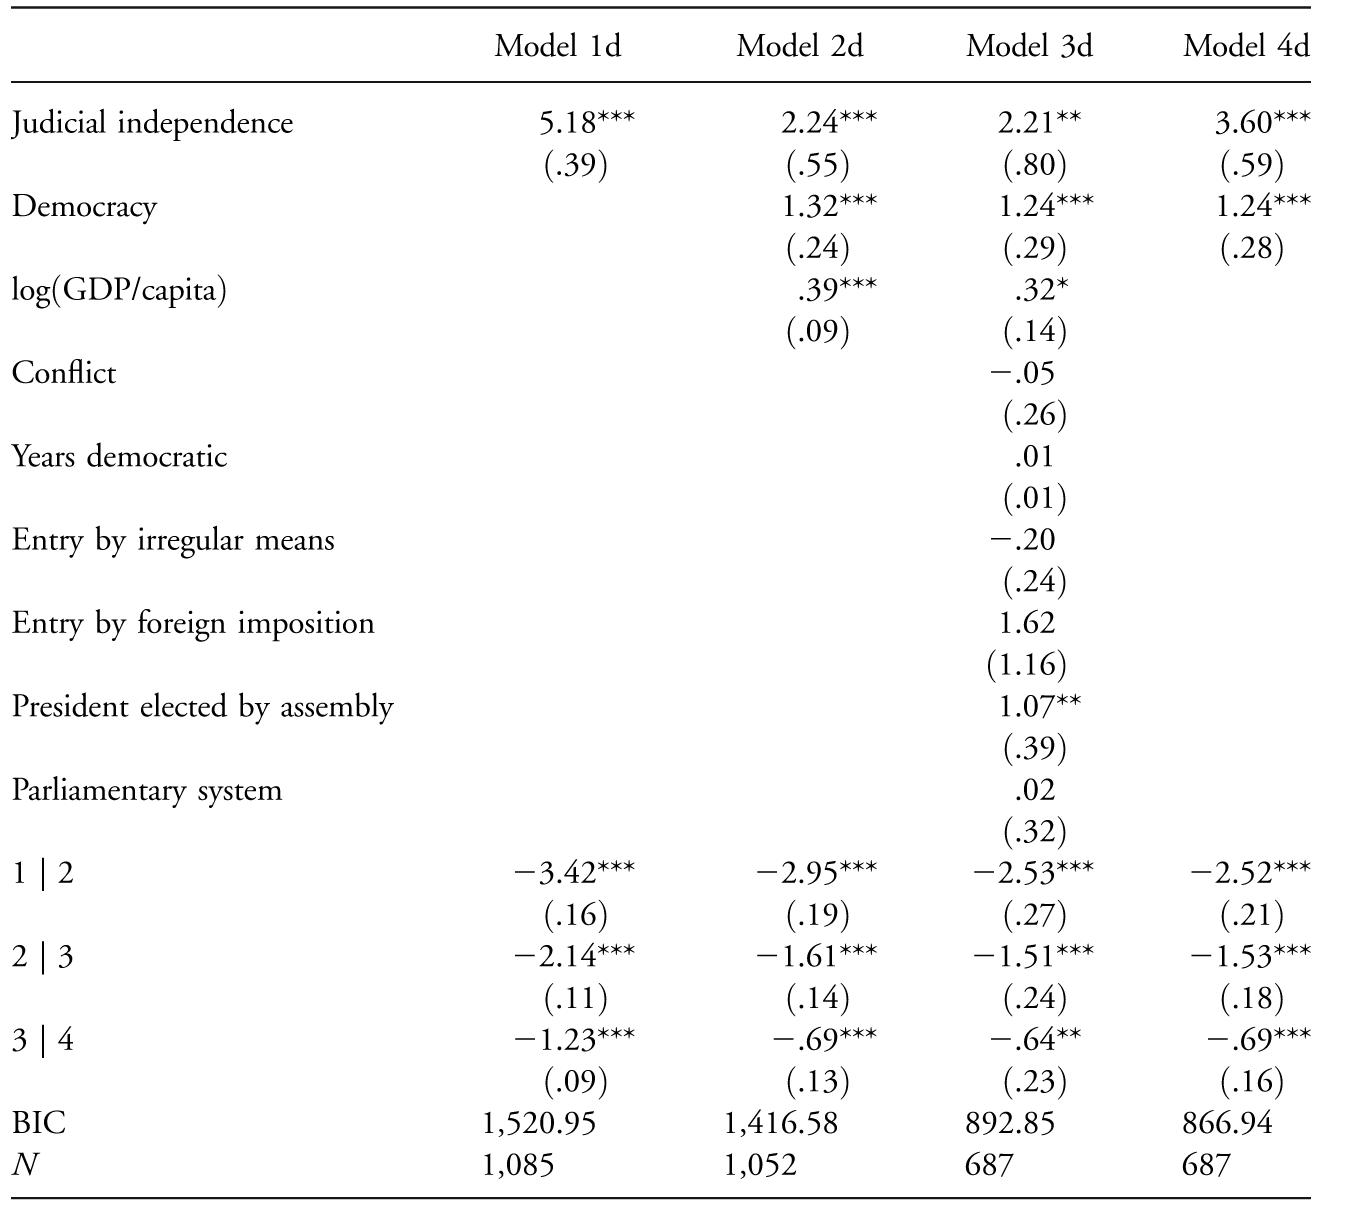
Note.—Four ordered logistic regression models of the post-tenure fate of leaders from 1960 to 2004; each model is fit on the same data and with the same covariates as the corresponding model in table 1. Standard errors in parentheses. Cut points between outcome categories are reported below covariate estimates. GDP = gross domestic product; BIC = Bayesian information criterion.
* p < .05.
** p < .01.
*** p < .001.
As can be seen, the regression output of each comparable dichotomous and ordered logit model is highly similar: judicial independence, democracy, and economic development are always highly statistically significant, and model 4d—the best-fitting restricted version of model 3d—once again uses only the first two of these three covariates. Also similar to the dichotomous models is the fact that the assembly elected president category of the nature of the executive covariate is the only other covariate to reach at least the conventional .05 level of statistical significance.
In all but one model, the estimated cut points are statistically distinguishable from one another, in that the 95% confidence intervals around each do not overlap. This means we can ascertain which category a given observation falls into; if the cut points overlapped, a given estimate could likely be within the 95% confidence interval of more than one category. Judicial independence is highly statistically significant across model specification, and the estimated coefficient is robust to the inclusion of a number of different covariates. This provides further support for the key hypothesis of the article, suggesting that independence is an important factor in predicting post-tenure fate when measured in an ordered manner (although not reported, the results of hierarchical ordered logistic regression are highly comparable to these and, like with the dichotomous logit result, show no increase in model fit).
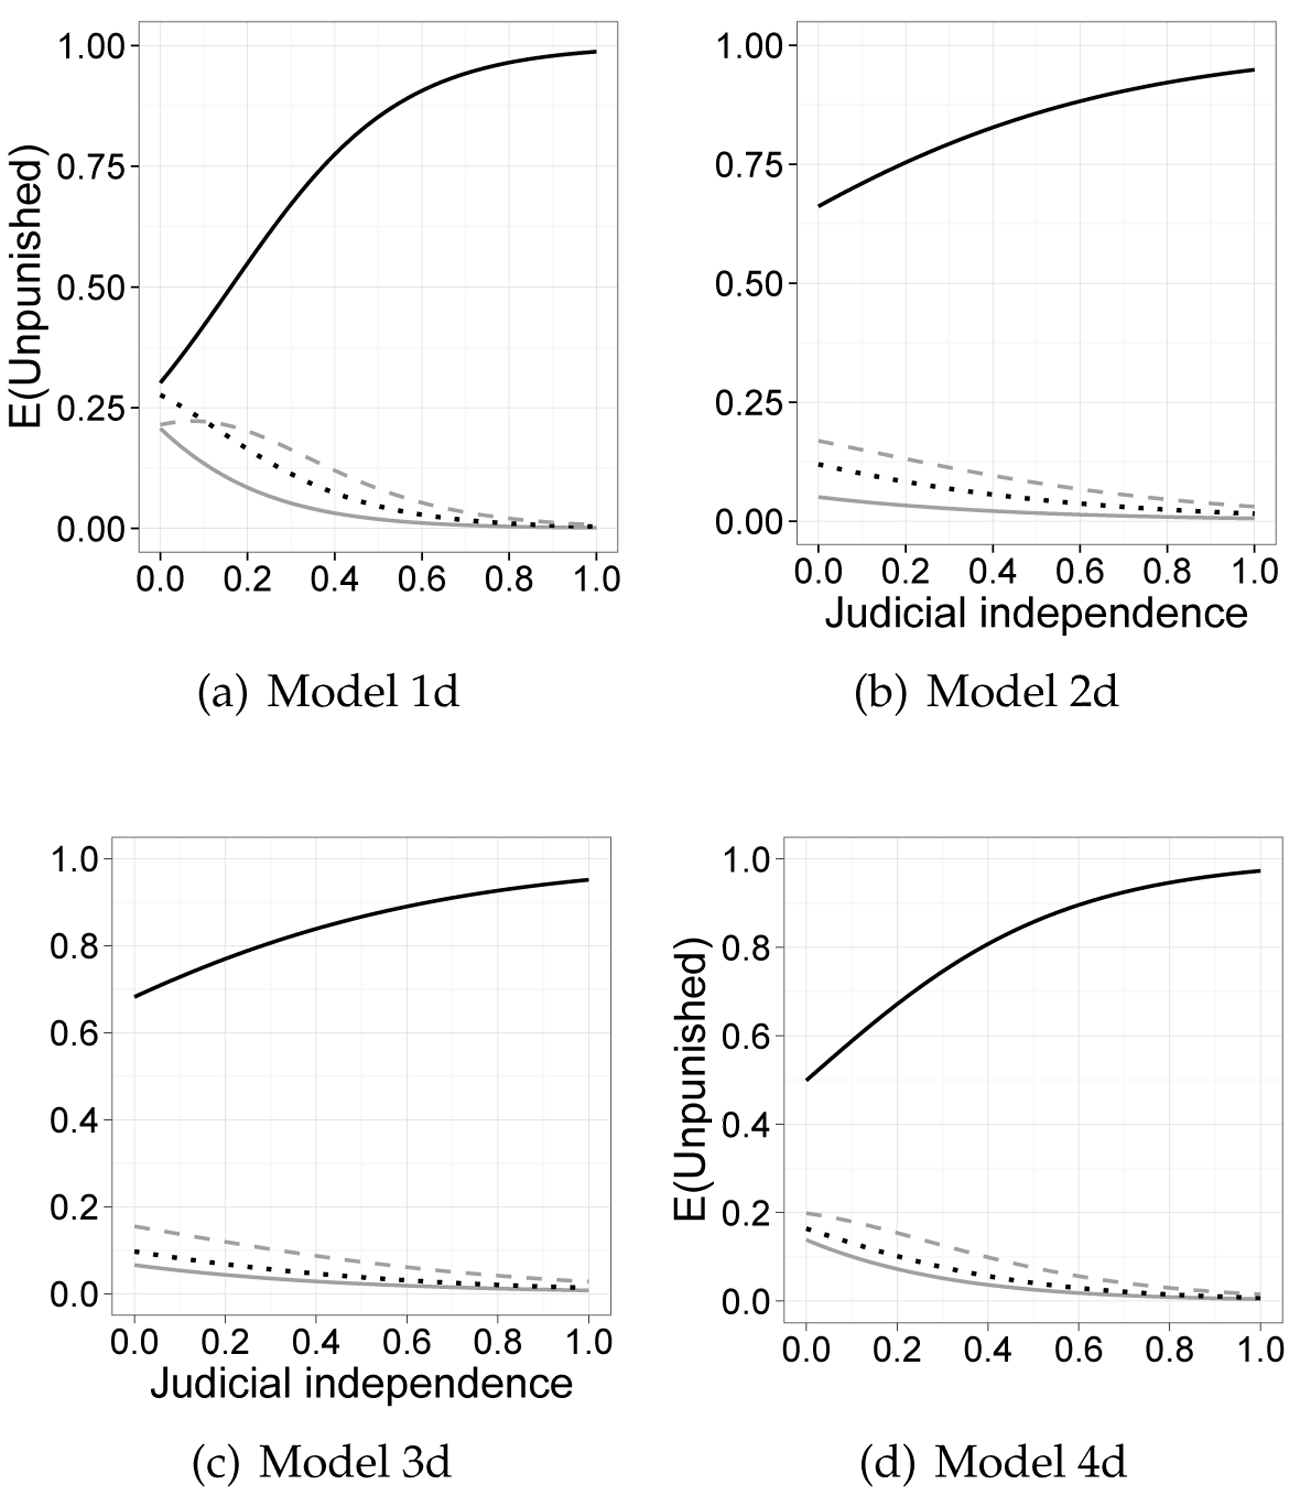
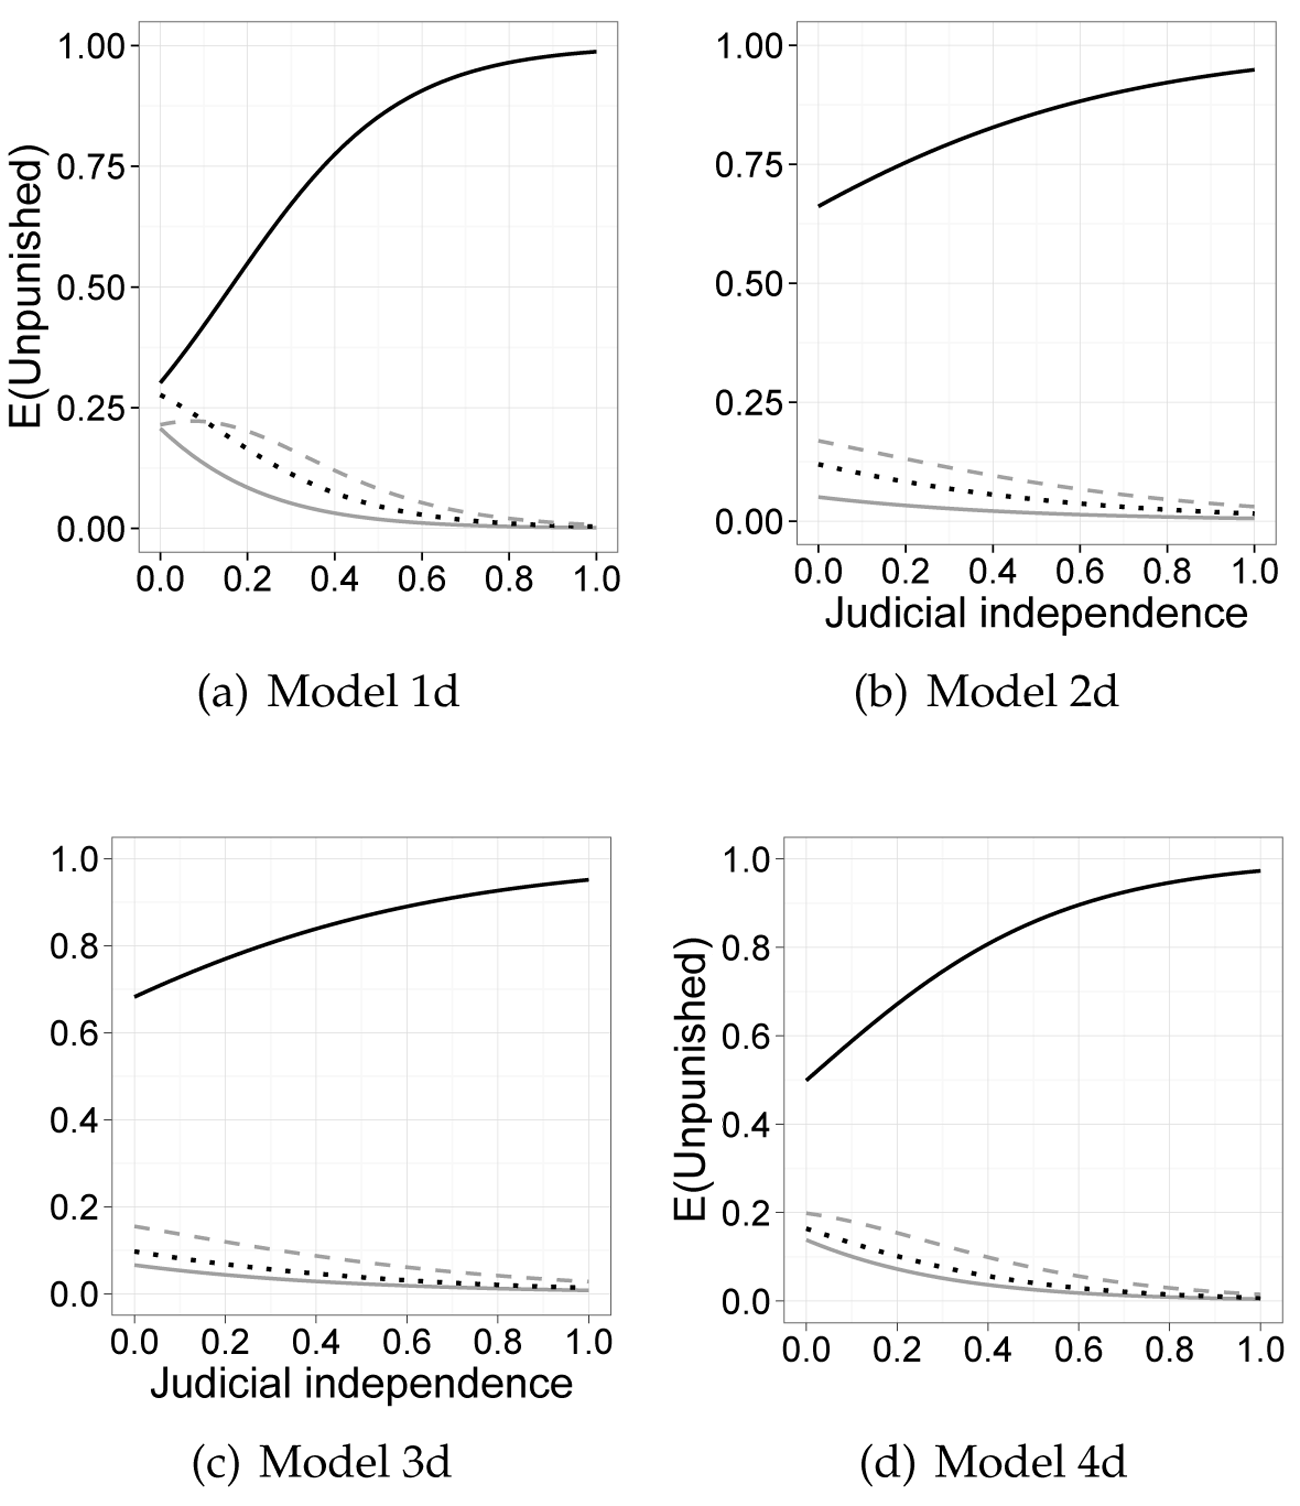
Because clear interpretation of ordered logistic regression is even more difficult than with a dichotomous outcome, figure A2 plots the predicted proportional probability of each of the four categories of post-tenure fate for the models in table A3. As before, other covariates are held at their mean values, and the trichotomous measure for electoral system is set to the value of an elected presidency. Because of the proportional nature of the predicted probabilities, at any given level of judicial independence the sum of the predicted probabilities of the four categories must be equal to one. The predicted lines for unpunished post-tenure fate (solid black) are incredibly similar to the plotted lines of the models in figure 3: as judicial independence increases, the likelihood of an unpunished post-tenure fate rises—rapidly in most of the models. The similarity of these ordered logistic results to the previous dichotomous logistic models provides further support for the argument that an independent judiciary minimizes the chances of post-tenure punishment.
Expected proportional probability of a leader being in one of the four categories of post-tenure fate from the models in table A3. Solid black lines represent an outcome of unpunished; dashed lines, exiled; dotted lines, imprisoned; and solid gray lines, killed.
Multinomial Logit Models
Although the post-tenure fate variable is by design coded as an ordinal measure, one might question whether in reality there is an ordered structure to the four categories of post-tenure fate with imprisonment always worse than exile. Despite the fact that the coding structure forces such an ordered relationship, Brant tests of the models suggest that the parallel regressions assumption of ordered logistic regression is violated for a number of covariates. Because of this, and to provide yet another test of the insurance hypothesis, I conduct multinomial logistic regression, which assumes that there is no necessary order to the dependent variable, instead treating its categories as nominal.
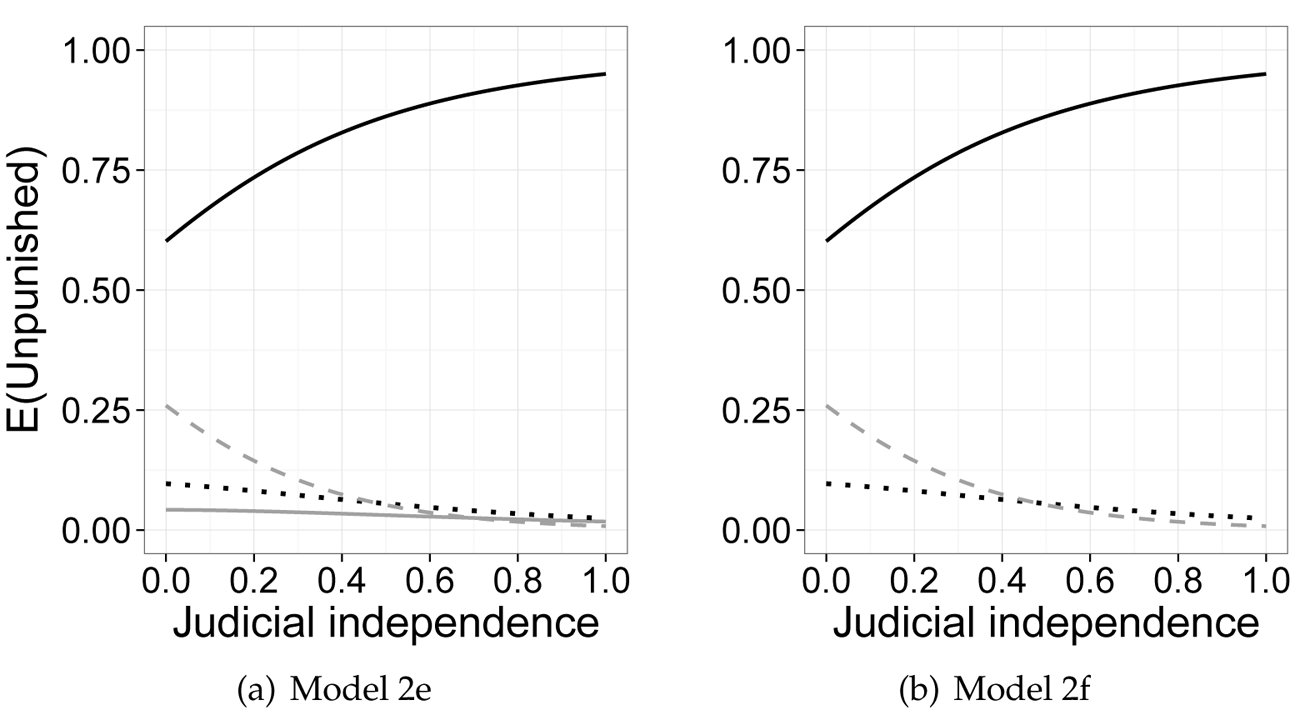
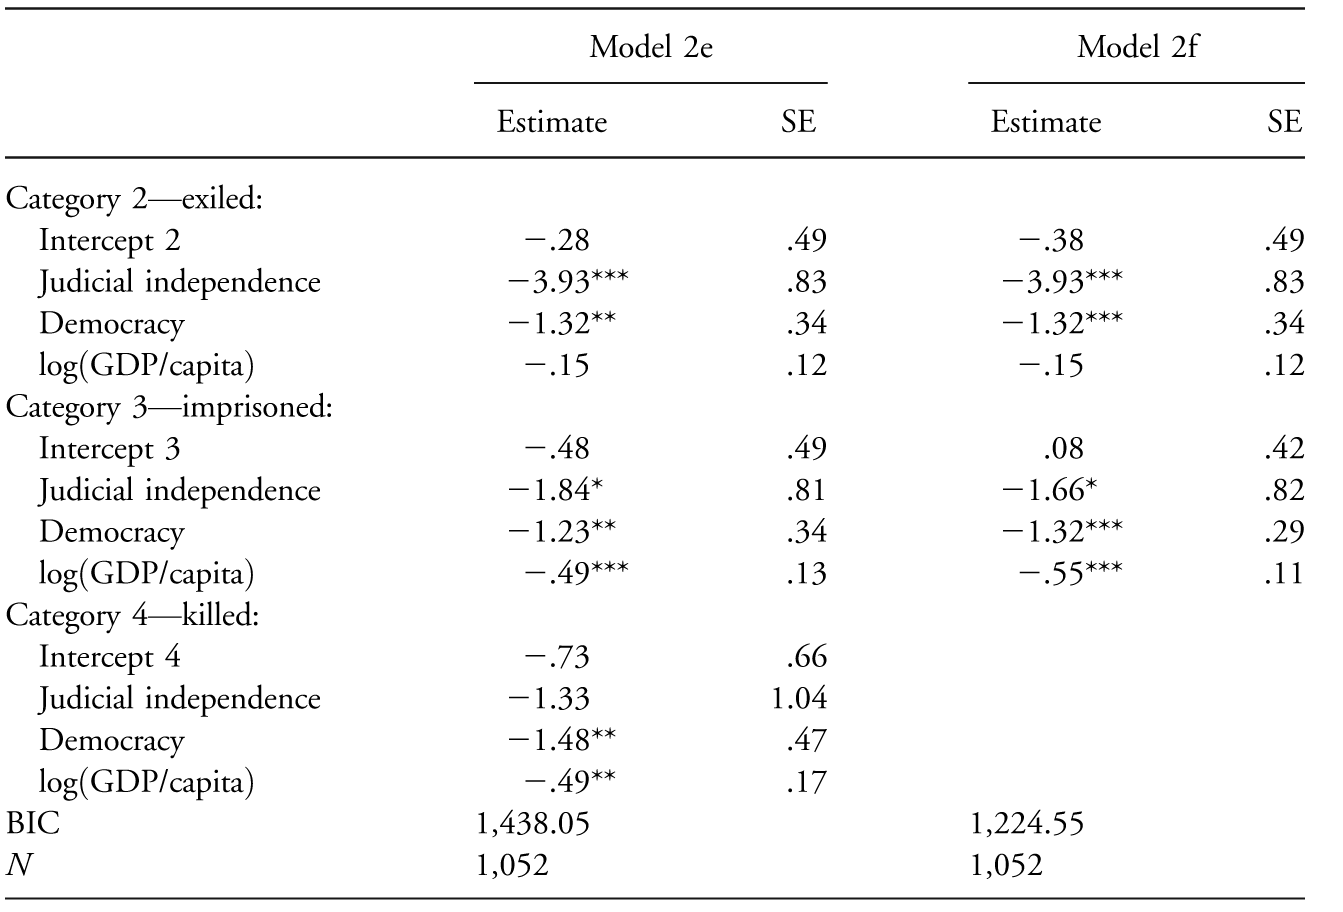
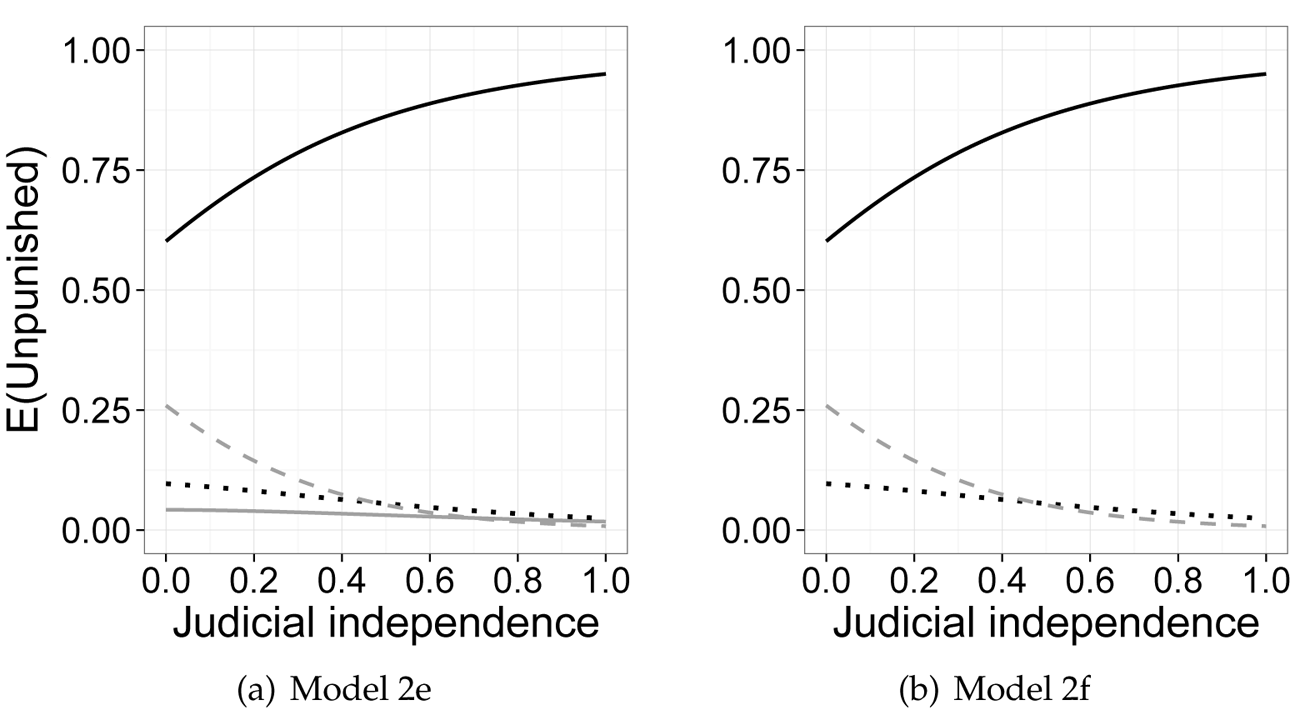
Table A4 shows results of two multinomial logistic models, with the unpunished category set to the reference/baseline category (all four models were not reported for reasons of space, due to the extensive regression output of multinomial models). Model 2e uses all four outcome categories, while model 2f collapses the imprisoned and killed categories, as suggested by Wald tests. The estimates of the covariates for each of the three levels (exiled, imprisoned, killed) report how that variable changes the predicted probability of being in that category as compared to the baseline category of being unpunished.
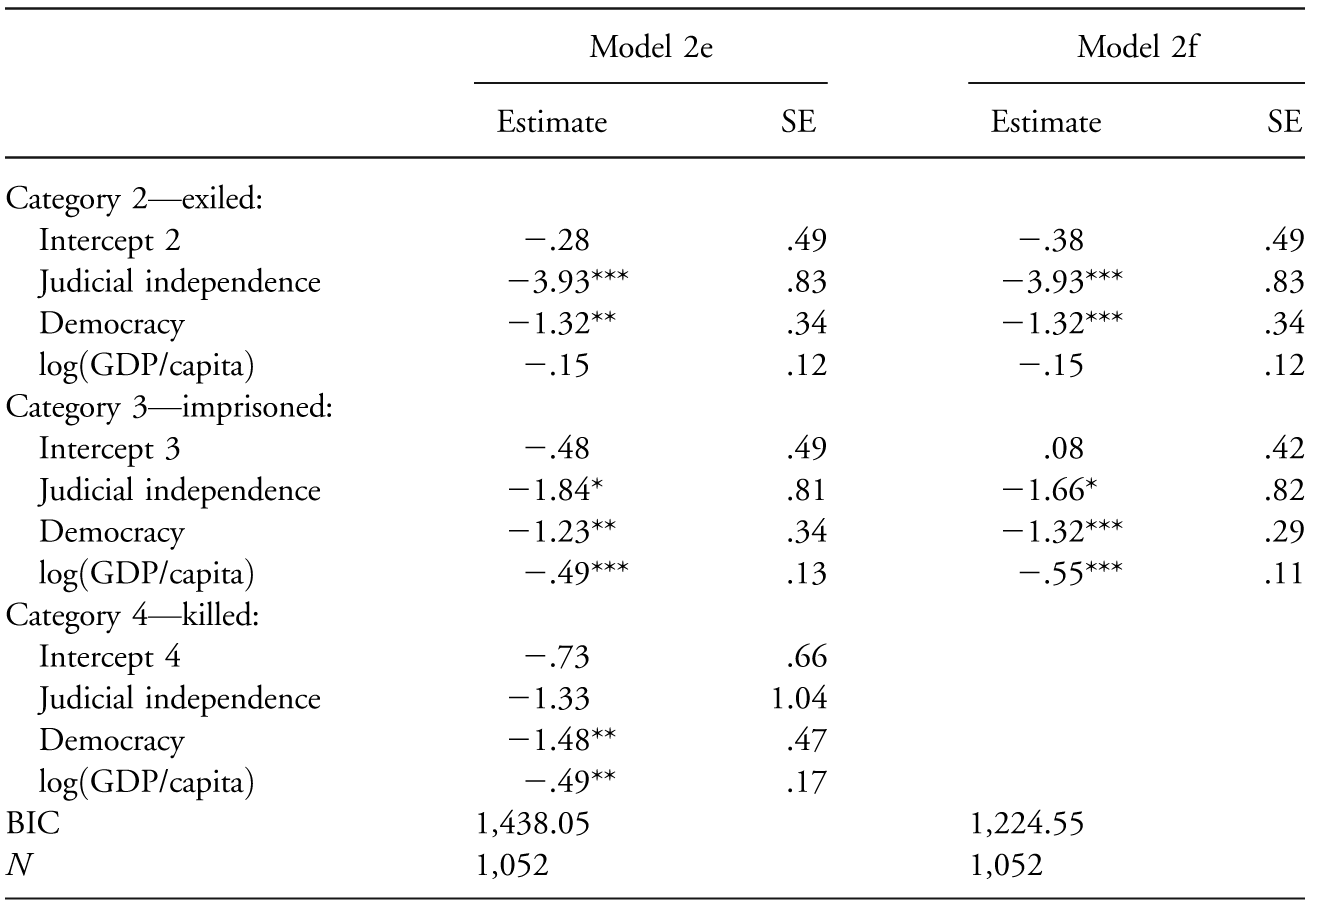
Note.—Two multinomial (polytomous) logistic regression models of post-tenure fate from 1960 to 2004, with a baseline category of unpunished. Model 2e uses all four outcome categories, while model 2f collapses the imprisoned and killed categories, as suggested by Wald tests. GDP = gross domestic product; BIC = Bayesian information criterion.
* p < .05.
** p < .01.
*** p < .001.
In model 2e, the estimate for judicial independence is not statistically significant for the fourth category, killed. This is unsurprising due to the comparably small number of observations in this category (49 leader-years in the data for model 2e) and the fact that, in effect, a separate regression is being fit comparing each category to the baseline category of unpunished. Statistical tests confirm this: a Wald test to determine whether it is appropriate to collapse pairs of outcome categories strongly confirms the differences between all category pairs (in each case
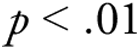 ), except for the imprisoned/killed combination (here
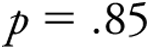 ). In each case the three-category multinomial logit model fits vastly better than the four-category version, according to the BIC scores. What is noteworthy in the models reported in table A4 is the significant difference between independence’s predicted effect between the baseline category and the second category of exiled in both models and the difference between being unpunished and being imprisoned. This is the most common category after unpunished, and the results in table A4 suggest that even with a more complicated modeling structure, and the rather low number of observations, we can still discern a statistically and substantively significant effect of judicial independence.
As clearly interpreting the results of multinomial logit models via regression output is effectively impossible, figure A3 plots the probabilities for each category in the two models in table A4. The procedure is the same as that in figure A2 and shows the same general relationship between judicial independence and post-tenure fate in figures A2 and 3. Plot a in figure A3 shows the predicted probability of post-tenure fate for model 2e in which all four outcomes categories are possible, while plot b shows the predicted probabilities for model 2f in which the categorical outcomes of imprisoned and killed are collapsed into one category. Both of these plots provide further support for the general relationship between judicial independence and post-tenure fate forwarded in the article. The relationship between independence and post-tenure fate is incredibly similar, regardless of the covariates included (which further attenuates the number of observations), the specific form of model used (standard/hierarchical binary logit, standard/hierarchical ordered logit, multinomial logit), or collapsing the dependent variable into three rather than four categories.
Expected proportional probability of a leader being in each category of post-tenure fate from the models in table A4. In plot a, the solid black line represents an outcome of unpunished; dashed line, exiled; dotted line, imprisoned, and solid gray line, killed. In plot b, the categories of imprisoned and killed are collapsed into one category, represented by the dotted line.