Aims and significance
Introduction and related terminologies
In the context of this work, a floor plan is a polygon, the plan boundary, divided by straight lines into component polygons called rooms. The edges forming the perimeter of each room are termed walls. The region not enclosed by the boundary is called the exterior.
The topological constraints are usually given in terms of adjacencies between rooms. Two rooms in the floor plan are adjacent if they share a wall or a section of wall. It is not sufficient for them to touch at a point only. Interconnections between rooms and with the exterior, and natural lighting or ventilation into the rooms are often reasons for such constraints. The dimensional constraints involve the shapes and sizes of each room and the actual floor plan.
A rectangular floor plan is a floor plan in which the plan's boundary and each room are rectangles. From Steadman (Reference Steadman2006), we know that rectangular packings offer the best flexibility of dimensioning (flexibility allows for any configurations of rectangles irrespective of their sizes; further it allows for the assignment of different dimensions to those configurations while preserving their rectangularity). Hence, this work is concerned with rectangular floor plans only.
It has been seen that for the enumeration of rectangular floor plans, it is possible first to satisfy topological constraints and then dimensional constraints can be worked out (Baybars & Eastman, Reference Baybars and Eastman1980). It is also possible to proceed by satisfying both topological and dimensional constraints at each step (Roth et al., Reference Roth, Hashimshony and Wachman1982), but separating them helps to exhaust the study of each constraint and its impact on the design. Therefore, in this work, we take the first approach and deal with dimensionless rectangular floor plans. In future work, we will consider the dimensional constraints. From here on, a dimensionless rectangular floor plan with n rooms is denoted by R F (n).
The graph theoretical terminologies that are frequently used in this paper are as follows:
An unlabeled graph is a graph in which individual nodes have no distinct identifications except through their interconnectivity; graphs in which labels are assigned to nodes are called labeled graphs. A sub-graph, H, of a graph, G, is a graph whose vertices are a subset of the vertex set of G, and whose edges are a subset of the edge set of G. In reverse, a super-graph of a graph G is a graph of which G is a sub-graph. A complete graph K n is a graph in which every pair of distinct vertices is connected by a unique edge. Corresponding to K n, we have the following result:
 $$m = \displaystyle{{n(n - 1)} \over 2}$$
Here, n and m stand for the number of vertices and the number of edges in a graph and graph shall mean a connected simple graph, that is, no loops and no multiple edges or directionality.
From Euler's formula we know that a planar graph has 3n − 6 edges only if all the faces are triangles but for any dual graph  $G_n^D $, all faces cannot be triangles. And, the
 $G_n^D $ where all faces are triangle except outer face, which is a quadrangle, has 3n − 7 edges. This discussion leads us to the following inequality corresponding to a dual graph
 $G_n^D $, provided that n > 3.
 $$m \le 3n - 7$$
Definition 1. A n −vertex graph G n is maximal if:
(i) there exists a rectangular floor plan
 $R_n^F $ corresponding to it, and
(ii) there does not exist a supergraph of G n for which a
$R_n^F $ exist.


Definition 2. A rectangular floor plan corresponding to a maximal graph G n is called a maximal rectangular floor plan denoted by  $R_n^M $.
Definition 3. Generic graphs corresponding to n vertices is represented by a set formed by all n −vertex maximal graphs.
Clearly, any graph G n for which a rectangular floor plan exists should be the sub-graph of at least one of the maximal graphs that form the generic graphs.
Definition 4. Generic rectangular floor plans with n rooms, denoted by  $R_n^G $, is a minimal set of maximal rectangular floor plans such that for every rectangular floor plan of a graph G n, there is a maximal rectangular floor plan in the set whose dual graph is a supergraph of the G n.
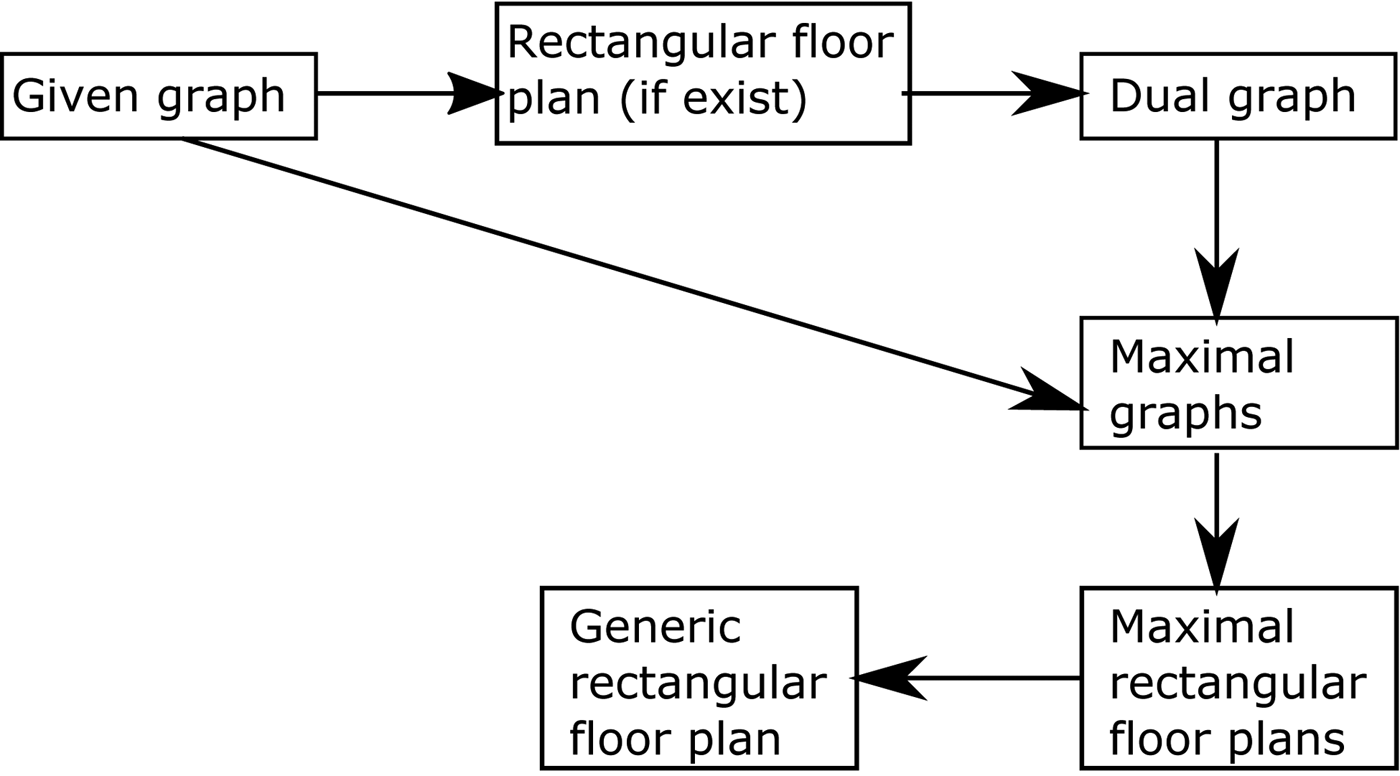
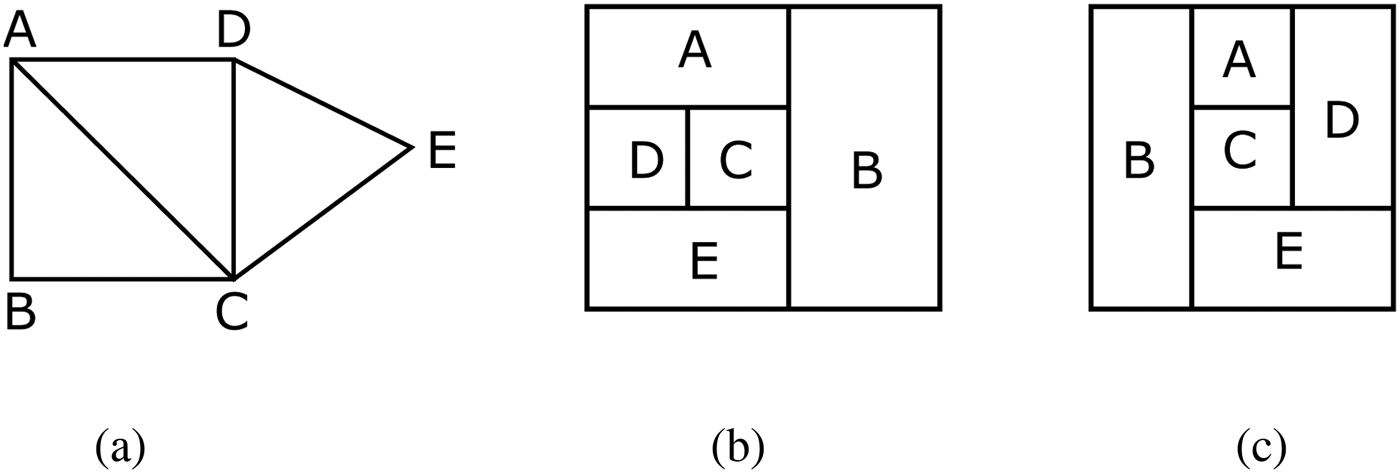
The notion of maximal and generic rectangular floor plans is illustrated in Figure 1. It should be noted that a maximal rectangular floor plan may have some extra connections that are not asked by the given adjacency graph. For better understanding, refer to Figure 2 where the rectangular floor plan in Figure 2b is maximal corresponding to the graph in Figure 2a with an extra connection between rooms B and E (for a proof, refer to Proposition 3).
The notion of maximal and generic rectangular floor plans

A given graph and corresponding maximal rectangular floor plans

For a large number of rooms, mathematically, it is not easy to:
(i) check the existence of a rectangular floor plan corresponding to a given graph (corresponding to a given graph, there may be several plans or else possibly no plans),
(ii) construct the rectangular floor plan corresponding to a given graph.
Therefore, in this paper, we describe universal (or generic) rectangular floor plans that topologically contain all rectangular floor plans.
Remark 1. It is interesting to note that maximal graphs are unique but corresponding floor plans are not unique, that is, there may exist more than one maximal floor plans for the same adjacency graph. In other words, a rectangular floor plan has only one topological graph, but for any topological graph, we can have many rectangular floor plans. As an example, in Figure 2, two topologically different maximal floor plans are illustrated for the given graph.
Literature review and work done
For a given (adjacency) graph, the problem is to construct the corresponding rectangular floor plan(s), if exists. In the past, many researchers have presented graph theoretical techniques for the generation of rectangular floor plans while satisfying given topological requirements. A brief literature review is as follows:
This approach was first presented by Levin (Reference Levin1964) in 1964 where a method was proposed for converting the graph into a spatial layout. Then in 1970, Cousin (Reference Cousin1970) talked about the construction of a rectangular dual (adimensional rectangular floor plan) of a given graph. In both approaches, the problem of realizing the adjacency structure as a floor plan was not presented very clearly. In the same year, Grason (Reference Grason and Moore1970) proposed a dual graph representation of a planar graph for generating a rectangular floor plan where a floor plan is obtained from its dual graphFootnote 1 by representing each region by a vertex and drawing an edge between two adjacent regions. In this direction, Steadman (Reference Steadman1973, Reference Steadman1983) exhaustively generates all topologically distinct rectangular arrangements (illustrating all possibilities up to six component rectangles). In this way, the problem of producing a plan to given specifications of adjacency becomes simply one of selection, rather than one of construction as in the approach of previous workers. These packings were produced by hand. In 1975, Sauda (Reference Sauda1975) designed a computer algorithm for generating packings automatically, with which all possibilities up to eight rectangles can be produced. To systematically arrange these packings throughout a solution space, Combes (Reference Combes1976) presented mathematical covariants and their relationships, used to define and categorize different kinds of packings. In 1977, March and Earl (Reference March and Earl1977) established the one-to-one correspondence between trivalent 3-polytopesFootnote 2 and fundamental architectural schemes. In 1979, Earl and March (Reference Earl, March, Wilson and Beineke1979) investigated the possible realizations of floor plan arrangements representation by the non-separable trivalent plane mapsFootnote 3. Then in 1980, Baybars and Eastman (Reference Baybars and Eastman1980) demonstrated a systematic procedure for obtaining an architectural arrangement (not necessarily rectangular) from a given underlying maximal planar graph. It has been shown that a given maximal planar graphFootnote 4 G with p vertices could be embedded in the plane in 2p − 4 different ways. In 1982, Roth et al. (Reference Roth, Hashimshony and Wachman1982) presented a method for constructing a dimensioned plan from a given graph. In this method, the given graph is first split into two sub-graphs by a coluring technique (Roth & Wachman, Reference Roth and Wachman1978); each of these graphs is then converted into a dimensioned graph; the final product of the model is a set of alternative plans where the determination of the envelope's overall size is done by using the Program Evaluation and Review Technique algorithm (Radcliffe et al., Reference Radcliffe, Kawal and Stephenson1967). In 1985, Robinson and Janjic (Reference Robinson and Janjic1985) showed that, if areas are specified for rooms with a given maximal outer-planar graph, then any convex polygon with the correct area can be divided into convex rooms to satisfy both area and adjacency requirements. In 1987, Rinsma (Reference Rinsma1987) showed that, for any given maximal outerplanar graph with at most four vertices of degree 2, it is not always possible to find a rectangular floorplan satisfying adjacency and area conditions. In the same year, Rinsma (Reference Rinsma1988) provided conditions for the existence of rectangular and orthogonal floorplans for a given treeFootnote 5, representing the required adjacencies between rooms and areas for each room. In 1994, Schwarz et al. (Reference Schwarz, Berry and Shaviv1994) presented a graph-theoretical model for automated building design. Here, the proposed solutions are not restricted in any shape, that is, on the basis of given constraints, the shape of layout gets evolved. In 2000, Recuero et al. (Reference Recuero, Rio and Alvarez2000) presented a heuristic method using the concepts of graph theory for mapping a graph into rectangles so that they cover a rectangular plan.
As a recent work, in 2007, Del Rio-Cidoncha et al. (Reference Del Rio-Cidoncha, Martinez-Palacios and Iglesias2007) develop a method for solving floorplan design problem which involves three main steps. In the first one, the relationships between different modules, their distribution or location, are established using slicing trees. In the second step, the corridors are found. In the last step, the spaces are geographically oriented. In 2010, Marson and Musse (Reference Marson and Musse2010) proposed a technique for the generation of floor plans based on the squarified treemaps algorithm. Treemaps subdivide an area into small pieces to represent the importance of each part in the hierarchy whereas squarified treemaps are treemaps that are used to generate rooms with aspect ratios close to one. In 2011, Jokar and Sangchooli (Reference Jokar and Sangchooli2011) introduced face area as a new concept for constructing a rectangular floor plan with some non-rectangular rooms corresponding to a particular class of MPG. In 2014, Shekhawat (Reference Shekhawat2014) proposed the enumeration of a particular class of best connected rectangular floor plans, that is, the floor plans having 3n − 7 edges in their dual graphs. In 2017, Ham and Lee (Reference Ham and Lee2017) presented an algorithmic approach for quantitatively evaluating structural similarities between architectural plans and creating a phylogenetic tree of the analyzed architectural plans.
Mathematically, the problem of construction of a rectangular floor plan corresponding to a given graph is known as rectangular dualization problem which was first studied by (Bhasker & Sahni, Reference Bhasker and Sahni1987, and Koźmiński & Kinnen, Reference Koźmiński and Kinnen1985). The following theorem was proved in (Koźmiński & Kinnen, Reference Koźmiński and Kinnen1985):
Theorem 1. A planar graph G has a rectangular dual R with four rectangles on the boundary of R if and only if
(i) every interior face is a triangle and the exterior face is a quadrangle, and
(ii) G has no separating triangles, where a separating triangle is a triangle whose removal separates the graph.
It can be seen that most of the work done related to the existence and construction of a rectangular floor plan falls into any of these categories:
(i) Construction of a rectangular floor plan corresponding to:
(a) properly triangulated planar (PTP) graphsFootnote 6 (Shekhawat, Reference Shekhawat2014; Bhasker & Sahni, Reference Bhasker and Sahni1987),
(b) maximal outer planar (MOP) graphsFootnote 7 (Robinson & Janjic, Reference Robinson and Janjic1985),
(c) maximal planar graphs (MPG) (Jokar & Sangchooli, Reference Jokar and Sangchooli2011),
(ii) Transform a given graph into a MPG (Baybars & Eastman, Reference Baybars and Eastman1980; Rinsma, Reference Rinsma1988) or PTP (Roth et al., Reference Roth, Hashimshony and Wachman1982) and then construct a rectangular floor plan corresponding to it (in case of a MPG, the rectangular floor plans may have some non-rectangular rooms)
In all the above cases, first we need to check that there exists a rectangular floor plan, corresponding to the given graph or to the transformed graph, and then we need to construct it if it exists.
In this paper, we only need to check that the given graph G is a sub-graph of any of the maximal graphs or not. If G is a sub-graph of a maximal graph, then we consider the corresponding maximal rectangular floor plan. If G is not a sub-graph of any of the maximal graphs, it implies that there does not exist a rectangular floor plan corresponding to G (refer to Proposition 10). Clearly, considering a maximal rectangular floor plan, instead of a rectangular floor plan, corresponding to a given graph, assures that the topological constraints set by the architect are satisfied. Also, this idea reduces the amount of computation involved in producing a rectangular floor plan, that is, each time, we do not need to transform the given graph into a MPG or a PTP and we do not need to check that there exists a rectangular floor plan corresponding to the given graph or transformed graph.
Hence, our goal is to describe and enumerate generic rectangular floor plans that topologically contain all rectangular floor plans. Evidently, the concept of generic rectangular floor plans would make the process of construction of rectangular floor plan independent of topological constraints.
Architecturally, the concept of generic rectangular floor plans can serve as a very important tool for the designing of rectangular floor plans because of the following reasons:
Sometimes it may happen that the adjacency graph given by the architects is over constrained, that is, there does not exist a rectangular floor plan for the given adjacency graph because of some extra connections. Also, for a given n, there exists a large number of graphs and it is not always easy to construct a rectangular floor plan individually corresponding to a given graph. Considering generic rectangular floor plans directly implies that the topological constraints set by the architects are satisfied.
In this paper, answers will be given to the following questions when 4 < n < 10:
(i) What is the necessary condition for the existence of a rectangular floor plan for the given graph G n (refer to Proposition 10).
(ii) What is the necessary and sufficient condition for the existence of a maximal rectangular floor plan (refer to Proposition 9).
(iii) How to construct a maximal rectangular floor plan (refer to the section “Methodology”, where maximal rectangular floor plans with less than eight rooms are constructed, and refer to the section “Maximal rectangular floor plan with eight and nine rooms”, where maximal rectangular floor plans with eight and nine rooms are constructed) and how to transform the maximal floor plan into a floor plan corresponding to the given graph (refer to the section “Discussion and future work” and Fig. 21).
The flow of the paper is as follows:
In the section “Methodology”, first we will prove that the maximal graphs only belong to any one of the groups:
(i) graph with 3n − 7 edges for which a rectangular floor plan exists,
(ii) graph with degree sequence
$\{ n - 1\comma \,\underbrace {3\comma \, \ldots\comma \, 3}_{n - 1\;{\rm times}}\} $.
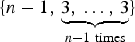
Then it would be demonstrated that there exists only one graph with degree sequence 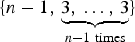 $\{ n - 1\comma \,\underbrace {3\comma \, \ldots\comma \, 3}_{n - 1\;{\rm times}}\} $ but there may exists more than one distinct graphs with 3n − 7 edges. To derive maximal graphs with 3n − 7 edges for n = 5, 6, 7, we present the following method.
(i) derive all distinct graphs with 3n − 7 edges,
(ii) Among all these graphs, pick those graphs for which a rectangular floor plan exists.
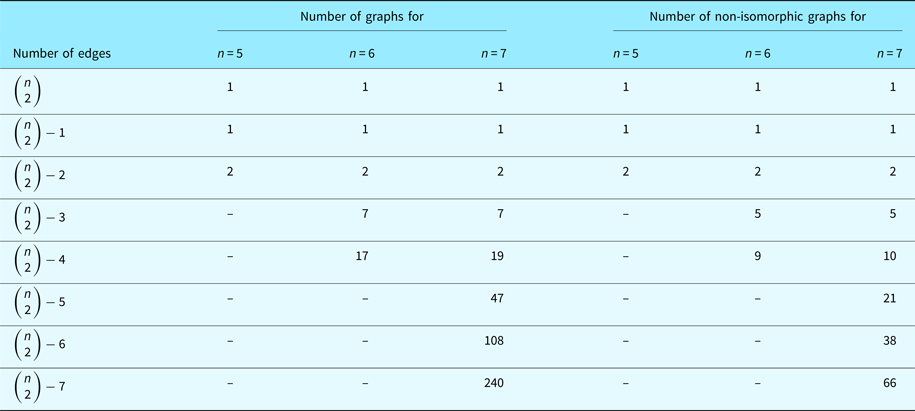
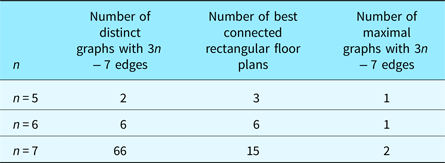
But from Table 2, we can see that, for n = 7, there are 66 distinct graphs with 3n − 7 edges out of which there are only two graphs for which a rectangular floor plan exists. To reduce the amount of computation involved in the section “Methodology”, we move to a new method in the section “Best connected rectangular floor plans” for deriving the maximal graphs with 3n − 7 edges for n = 8, 9, whose steps are as follows:
(i) Construct all possible topologically distinct rectangular floor plans whose dual graph has 3n − 7 edges,
(ii) Compute dual graphs of each of the rectangular floor plans,
(iii) Look for the distinct graphs among the obtained dual graphs.
For smooth reading of the remaining text, here is the list of notations that are frequently used in the paper:
R nF: a (dimensionless) rectangular floor plan with n rooms,
G nD: a dual graph of the R nF,
R nM: a (dimensionless) maximal rectangular floor plan with n rooms,
R nG: (dimensionless) generic rectangular floor plans with n rooms,
G n: n-vertex simple connected graph,
n: the number of rooms in a R nF as well as the number of vertices in a G n,
K n: a complete graph with n vertices,
m: the number of edges in a G n,
G nM: a maximal graph with n vertices.
Methodology
In this section, we are going to show that the maximal graphs only belong to any one of the groups:
• graph with 3n - 7 edges for which a rectangular floor plan exists,
• graph with degree sequence
$\{ n - 1\comma \,\underbrace {3\comma \, \ldots\comma \, 3}_{n - 1\,{\rm times}}\} $.

Maximal rectangular floor plans with four rooms
Given an undirected graph, a degree sequence is a monotonic non-increasing sequence of the vertex degrees (valencies) of its graph vertices.
Definition 5. A degree sequence {a 1, a 2, …, a n} is less than a degree sequence {b 1, b 2, …, b n} if and only if a i ≤ b i ∀ i = 1, 2, …, n.
For example, the degree sequence of G 5 in Figure 2a is less than the degree sequence of G 5 in Figure 4c.
Proposition 1. There exists only one maximal graph for n = 4, that is,  $G_4^M $.
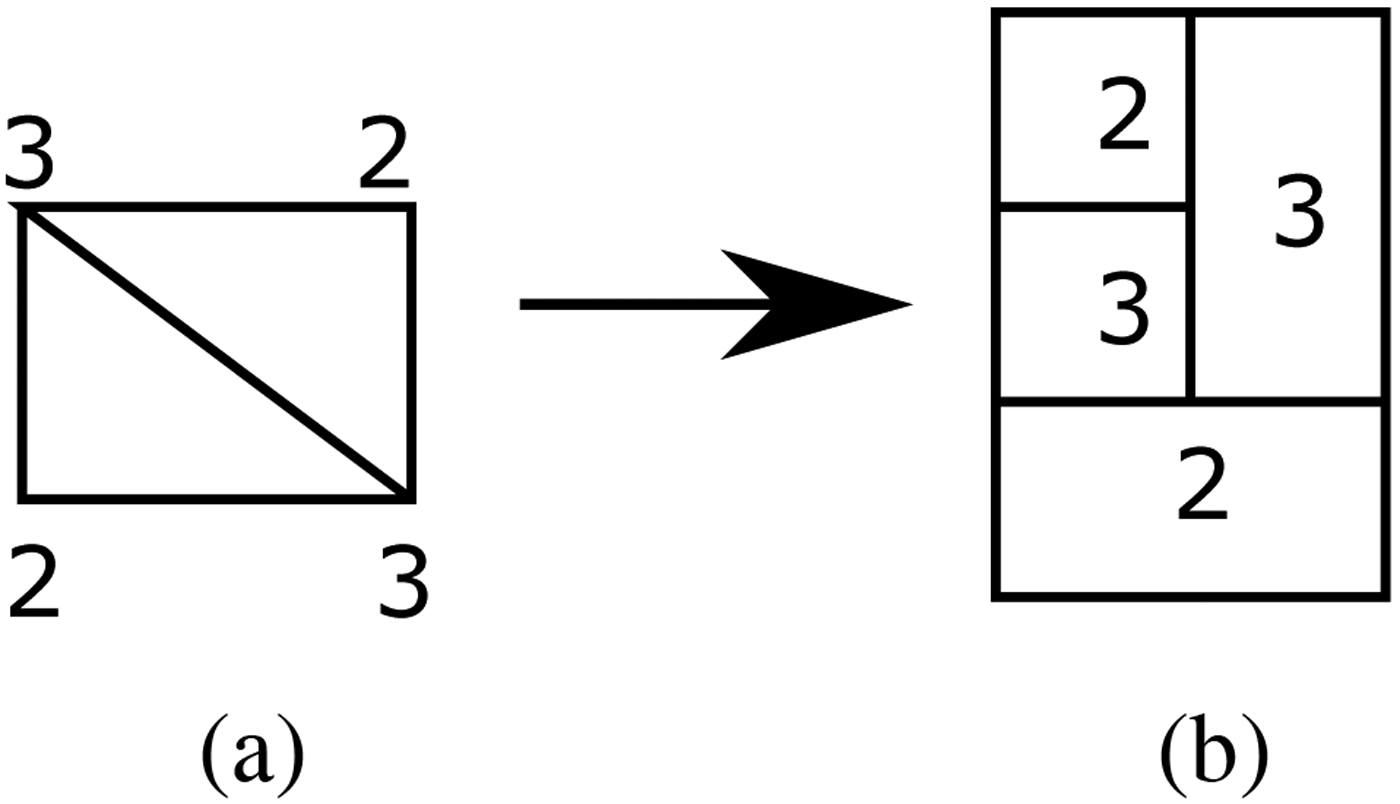
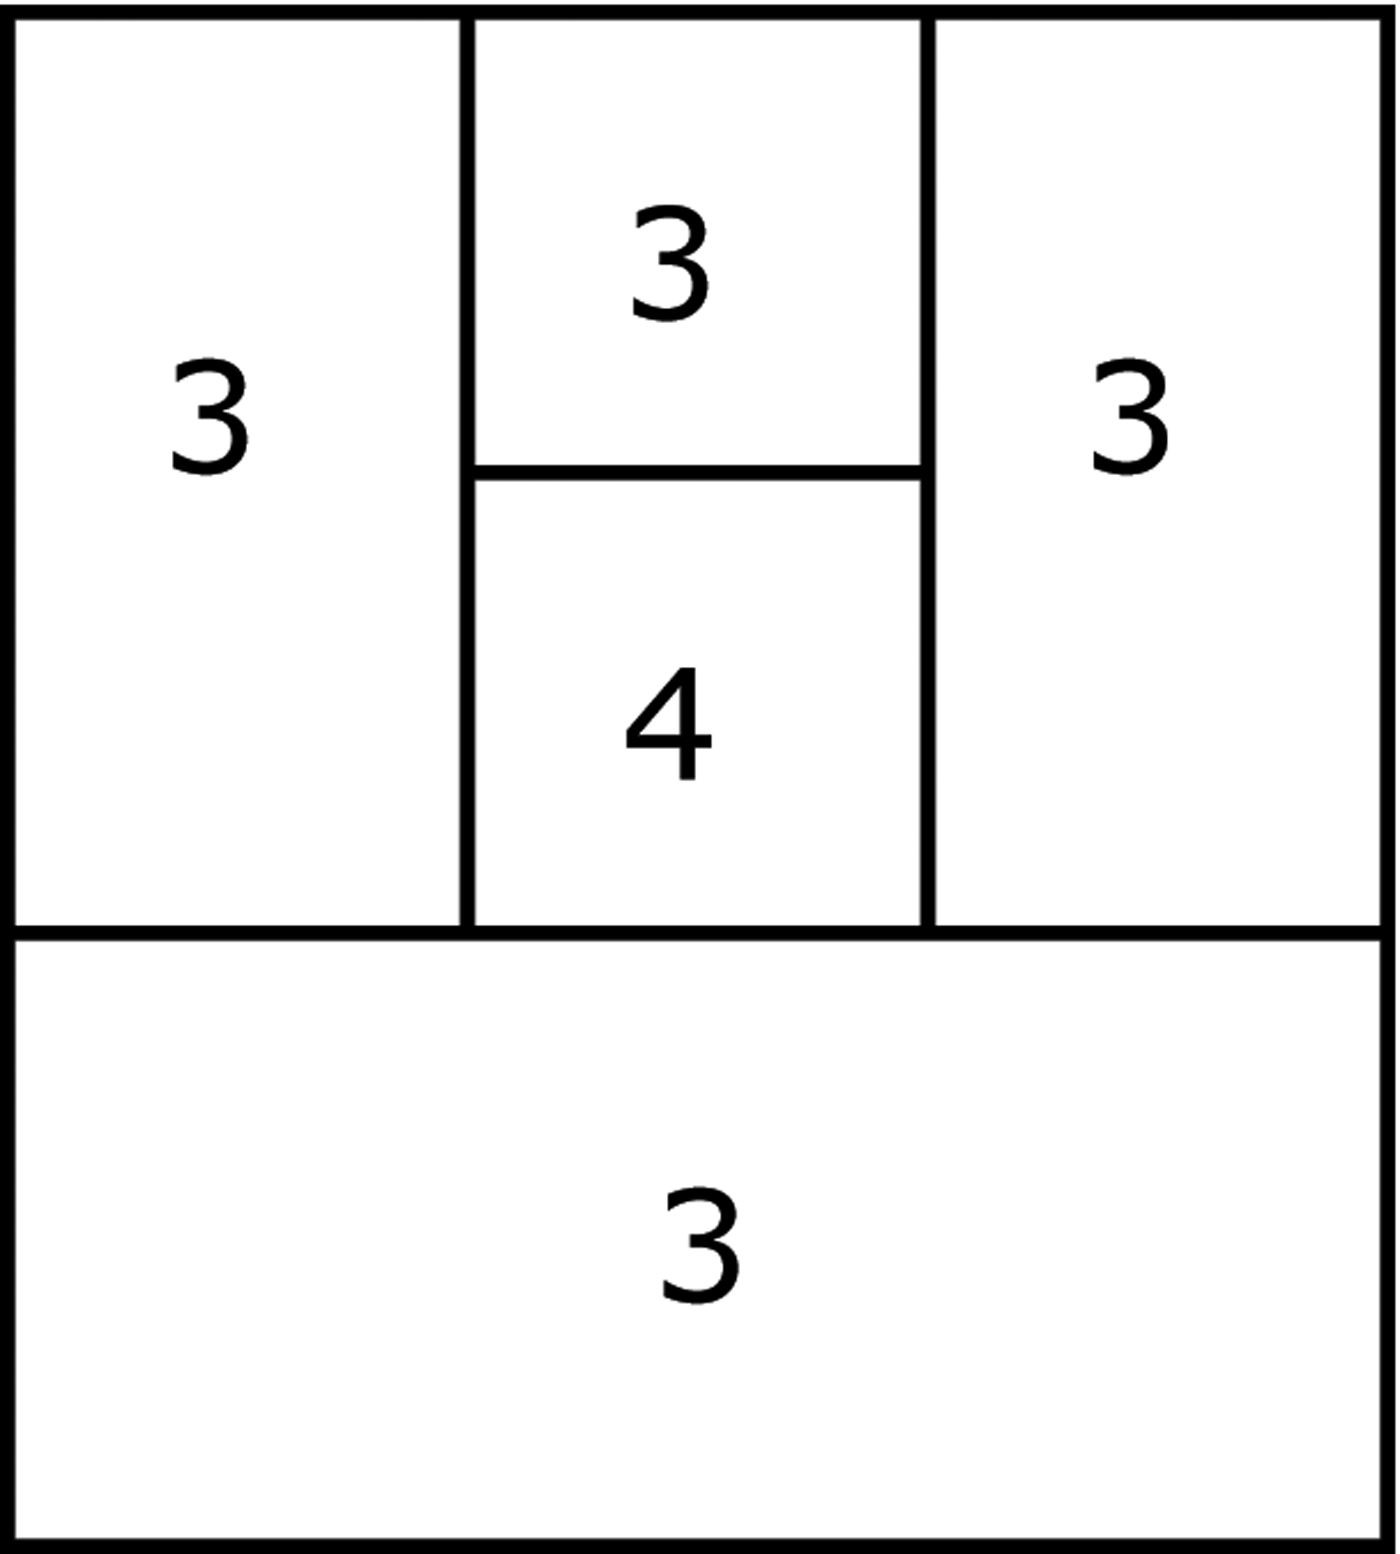
Proof. From Equation 1, for the complete graph K 4, m = 4 × 3/2 = 6 and from Equation 2, for a  $G_4^D $, we have m ≤ 3 × 4 − 7 = 5. Clearly, there exists only one graph G 4 with m = 5 that can be derived from K 4 by deleting any one of its edges. A G 4 with m = 5 and corresponding
 $R_4^F $ are illustrated in Figure 3. Hence, this graph is a maximal graph denoted by
 $G_4^M $.
A graph G 4 with 5 edges and corresponding rectangular floor plan (the number next to each vertex represents its degree and the number mentioned inside a room is its degree)

It is obvious to verify that the degree sequence of a graph G 1 is less than the degree sequence of a graph G 2 if G 1 is a spanning sub-graph G 2 (the converse is not always true). Now, for n = 4, the maximum degree of any vertex is three and the maximum degree of G 4 in Figure 3 is also three and it has m = 3 × 4 − 7 = 5. Hence, there does not exist any graph with four vertices for which a rectangular floor plan exists and whose degree sequence is not less than the degree sequence of  $G_4^M $. Hence,
 $G_4^M $ is the only maximal graph for n = 4. □
Maximal rectangular floor plan with five rooms
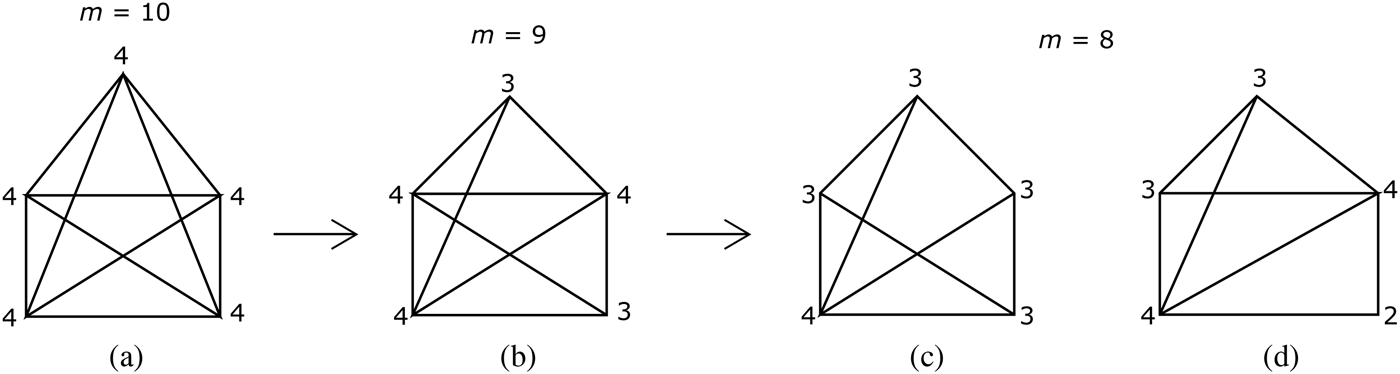
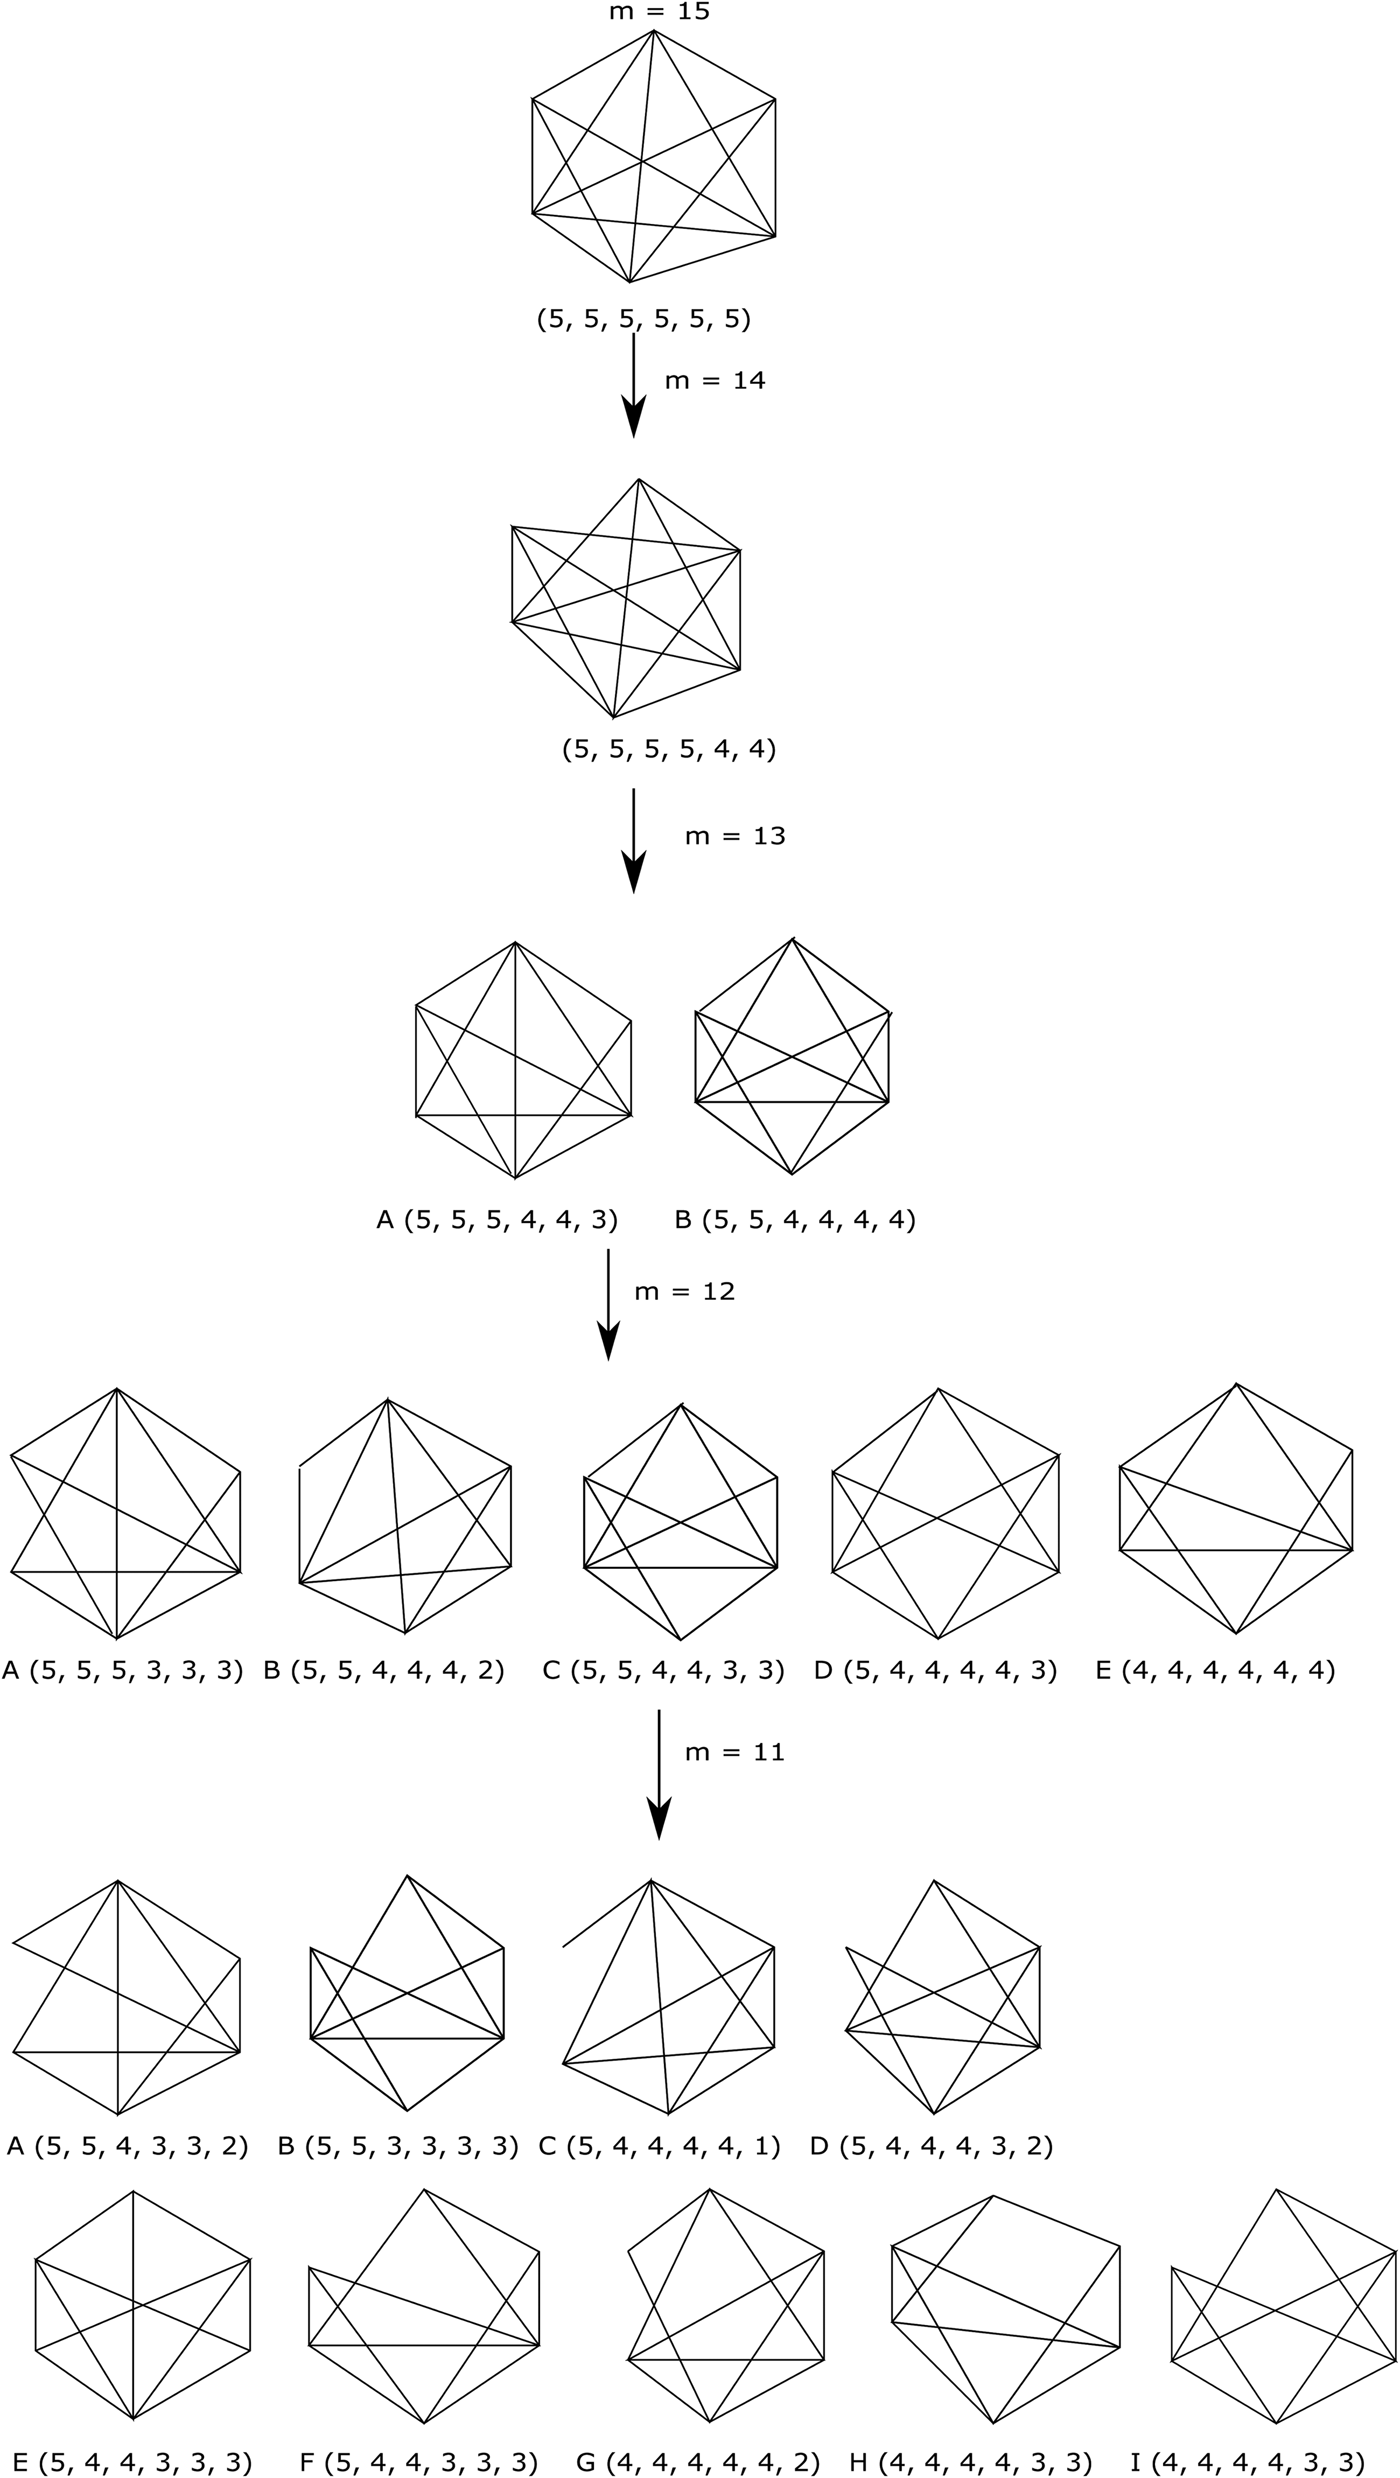
From Equation 1, for the complete graph K 5, m = 5 × 4/2 = 10 and from Equation 2, for a  $G_5^D $, we have m ≤ 3 × 5 − 7 = 8. Clearly, all possible graphs with n = 5, m = 8 can be derived from the complete graph K 5 by deleting two of its edges, as shown in Figure 4 where the numbers next to each vertex represent its degree.
Reduction of complete graph K 5 to graphs with n = 5 and m = 8, where the number next to each vertex represents its degree (to move from m = 10 to m = 9, any one of the edges can be deleted because the degree of each vertex in Figure A is same; but to move from m = 9 to m = 8, there are two options for deletion of an edge, that is, delete an edge joining the vertices with degree 4, see Fig. c, or delete an edge joining the vertices with degree 3 and degree 4, see Fig. d)

It can be seen from Figure 4 that there exist only two distinct unlabeled graphs with 3n − 7 = 3 × 5 − 7 = 8 edges and for both graphs, there does not exist a super-graph for which a rectangular floor plan exists because they are the only graphs with 3n − 7 = 3 × 5 − 7 = 8 edges. A rectangular floor plan  $R_5^F $ corresponding to the graph G 5 in Figure 4c is illustrated in Figure 5 but there does not exist a rectangular floor plan corresponding to the graph G 5 in Figure 4d (because of the presence of K 4, refer to Proposition 2). This suggests that the graph G 5 in Figure 4c is maximal while the graph G 5 in Figure 4d is not.
A rectangular floor plan corresponding to the graph in Figure 4c with degree sequence {4,3,3,3,3}

Proposition 2. There does not exist a rectangular floor plan corresponding to a graph containing the complete graph K 4.
Proof. From Theorem 1, we can easily conclude that there does not exist a rectangular floor plan corresponding to the complete graph K 4 because its outer face is not quadrangle. This implies that there does not exist a rectangular floor plan corresponding to a graph containing K 4. □
Let the maximal G 5 in Figure 4c be denoted by  $G_5^M $.
Proposition 3. There exists only one maximal graph for n = 5, that is,  $G_5^M $.
Proof. For n = 5 there exists only one graph with degree sequence {4, 4, 3, 3, 2} (see Fig. 4d) whose degree sequence is not less than the degree sequence of  $G_5^M $ but from Proposition 2, there does not exist a rectangular floor plan corresponding to Figure 4d. Hence,
 $G_5^M $ is the only maximal graph for n = 5. □
Maximal rectangular floor plans with six rooms
From Equation 1, for a complete graph K 6, m = 6 × 5/2 = 15 and from Equation 2, for a dual graph of any rectangular floor plan  $R_6^F $, we have m ≤ 3 × 6 − 7 = 11. To proceed further, all possible graphs with n = 6, m = 11 are derived from the complete graph K 6 in Figure 6. Now, we will show that there is only one maximal graph among the nine graphs with m = 11 as illustrated in Figure 6i (see Proposition 4).
Deriving all possible unlabeled graphs with six vertices and 3n − 7 = 11 edges from the complete graph K 6

Proposition 4. The graph G 6 in Figure 6i is a maximal G 6.
Proof. Using Theorem 2Footnote 8, it can be easily verified that the following graphs in Figure 6 are non-planar:
• Figure 6c (because of the presence of K 5)
• Figure 6g (because of the presence of a subdivision of K 5)
• Figures 6e and h (because of the presence of K 3,3)
From Proposition 2, there does not exist a rectangular floor plan corresponding to the graphs in Figures 6a, b, d and f because of the presence of K 4.
From the above discussion, there exists only one graph, that is, Figure 6i with 6 vertices and 11 edges for which a rectangular floor plan exists (see Fig. 7a). This concludes the proof.
All distinct maximal rectangular floor plans and their dual graphs when n = 6

Above, we have seen that there exists only one maximal graph with 6 vertices and 11 edges but it is interesting to note that, for n = 6, the degree sequence of a graph having at least one vertex of degree 5 cannot be less than the degree sequence {4,4,4,4,3,3}. To look for a maximal graph G 6 having at least one vertex of degree 5, let us consider the following results.
Proposition 5. If any room in a rectangular floor plan  $R_n^F $, n > 5, has degree n − 1, then there does not exist any other room with degree >3.
Proof. Let R A be a room with degree n − 1 in a rectangular floor plan  $R_n^F $ and R B be another room that is adjacent to R A. Now, it is easy to verify that it is not possible to draw three rooms (other than R A and R B) that are adjacent to both R A and R B or if all the three rooms are adjacent to R A, then at most two of the rooms can be adjacent to R B. This implies that if degree of R A is n − 1 then the degree of any other room cannot be >3.
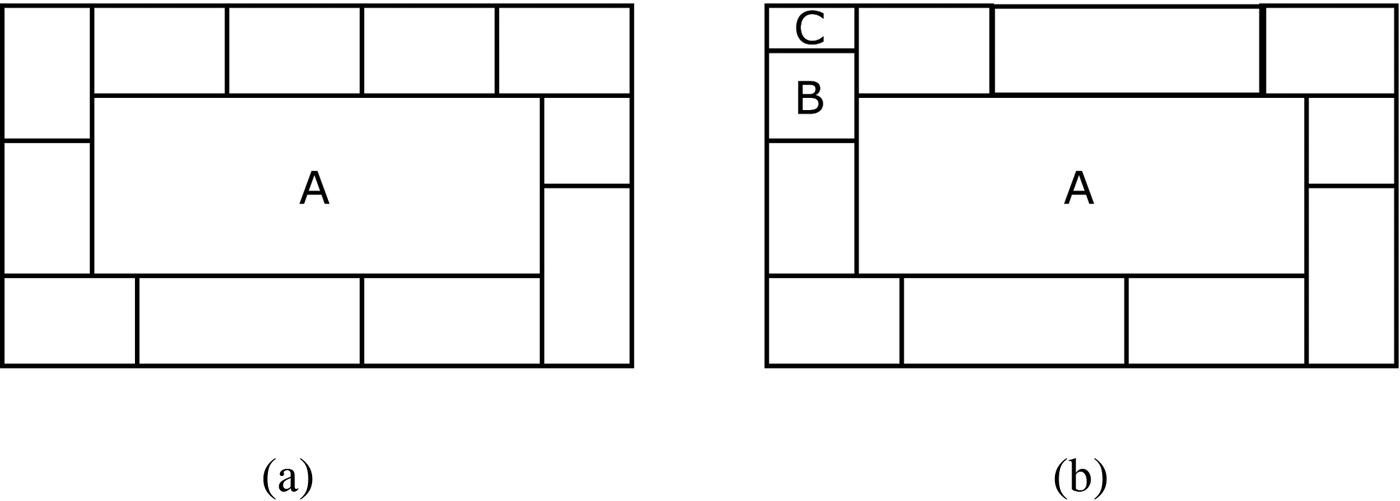
For further explanation of result of Proposition 5, consider Figure 8a with 12 rooms where room A is adjacent to all other 11 rooms and each of the 11 rooms has degree 3. Now, we can verify manually that it is not possible to increase the degree of any of the 11 rooms while keeping the degree of room A equal to 11. For example, in Figure 8b, the degree of room B is increased from 3 to 4 but then room C is not adjacent to room A.
Example showing that the dual graph of a rectangular floor plan with degree sequence {11,3,3,3,3,3,3,3,3,3,3,3} is a maximal graph

Proposition 6. It is always possible to construct a rectangular floor plan  $R_n^F $, n > 5, with degree sequence
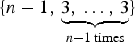 $\{ n - 1\comma \,\underbrace {3\comma \, \ldots\comma \, 3}_{n - 1\,{\rm times}}\} $.
Proof. It can be verified by drawing a rectangular floor plan with a room, say R A, in the center and n − 1 rooms adjacent to R A such that there should be at least one room adjacent to each wall of R A. As an example, a  $R_6^F $ with degree sequence {5,3,3,3,3,3} and the corresponding dual graph are illustrated in Figures 7c and d respectively.
Proposition 7. For n > 4, the graph with degree sequence  $\{ n - 1\comma \,\underbrace {3\comma \, \ldots\comma \, 3}_{n - 1\,times}\} $ is a maximal G n.
Proof. The graph with degree sequence 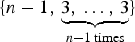 $\{ n - 1\comma \,\underbrace {3\comma \, \ldots\comma \, 3}_{n - 1\,{\rm times}}\} $ is a wheel graph, denoted by W n, formed by connecting a single vertex to all vertices of a cycle. Clearly, there does not exist a super-graph of a wheel graph with a same number of vertices for which a rectangular floor plan exists and from Proposition 6 there exists a rectangular floor plan corresponding to each wheel graph, hence, it is a maximal graph. □
Maximal rectangular floor plan with seven rooms
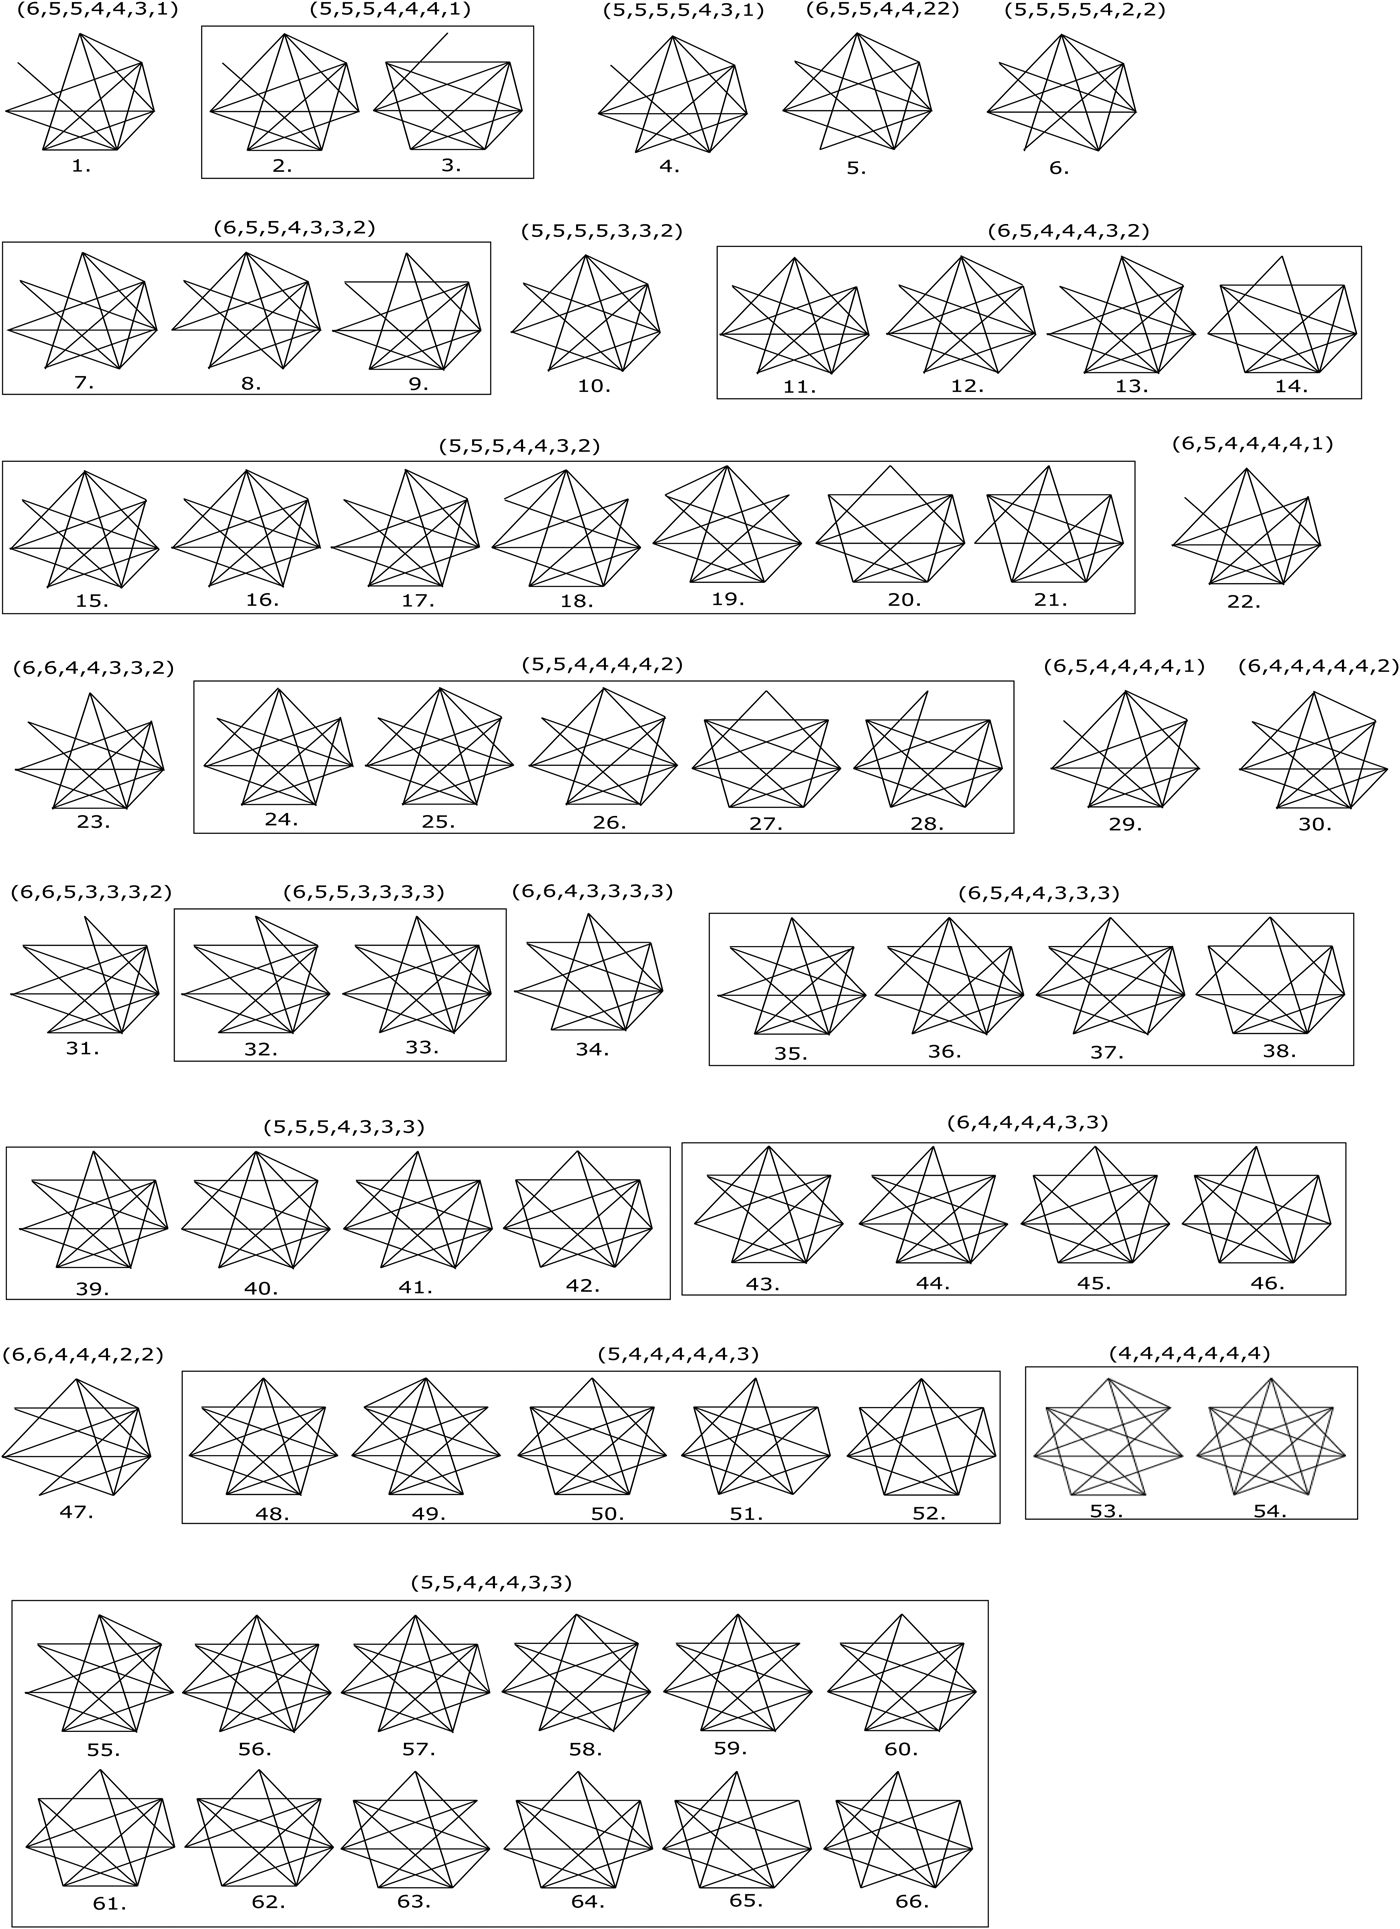
By using the procedure adopted in the section “Maximal rectangular floor plans with six rooms”, we found that there exist 66 distinct graphs with 7 vertices and 3n − 7 = 14 edges, as illustrated in Figure 9. Among these 66 graphs, 49 graphs are non-planar and 17 graphs are planar. Using Theorem 2, the non-planar graphs in Figure 9 are as follows:
(i) 1, 3, 4, 5, 6, 14, 21, 47 (because of the presence of K 5)
(ii) 28, 62, 64, 65 (because of the presence of a subdivision of K 5)
(iii) 2, 8, 13, 15, 17, 18, 19, 22, 27, 29, 30, 31, 32, 35, 39, 41, 44, 48, 49, 50, 53, 55, 59, 60, 63 (because of the presence of K 3,3)
(iv) 11, 16, 24, 25, 33, 43, 46, 51, 54, 56, 57, 66 (because of the presence of a subdivision of K 3,3)
All possible unlabeled graphs with seven vertices and 3n − 7 = 14 edges (the sequence shown above a graph or a group of graphs is its degree sequence)

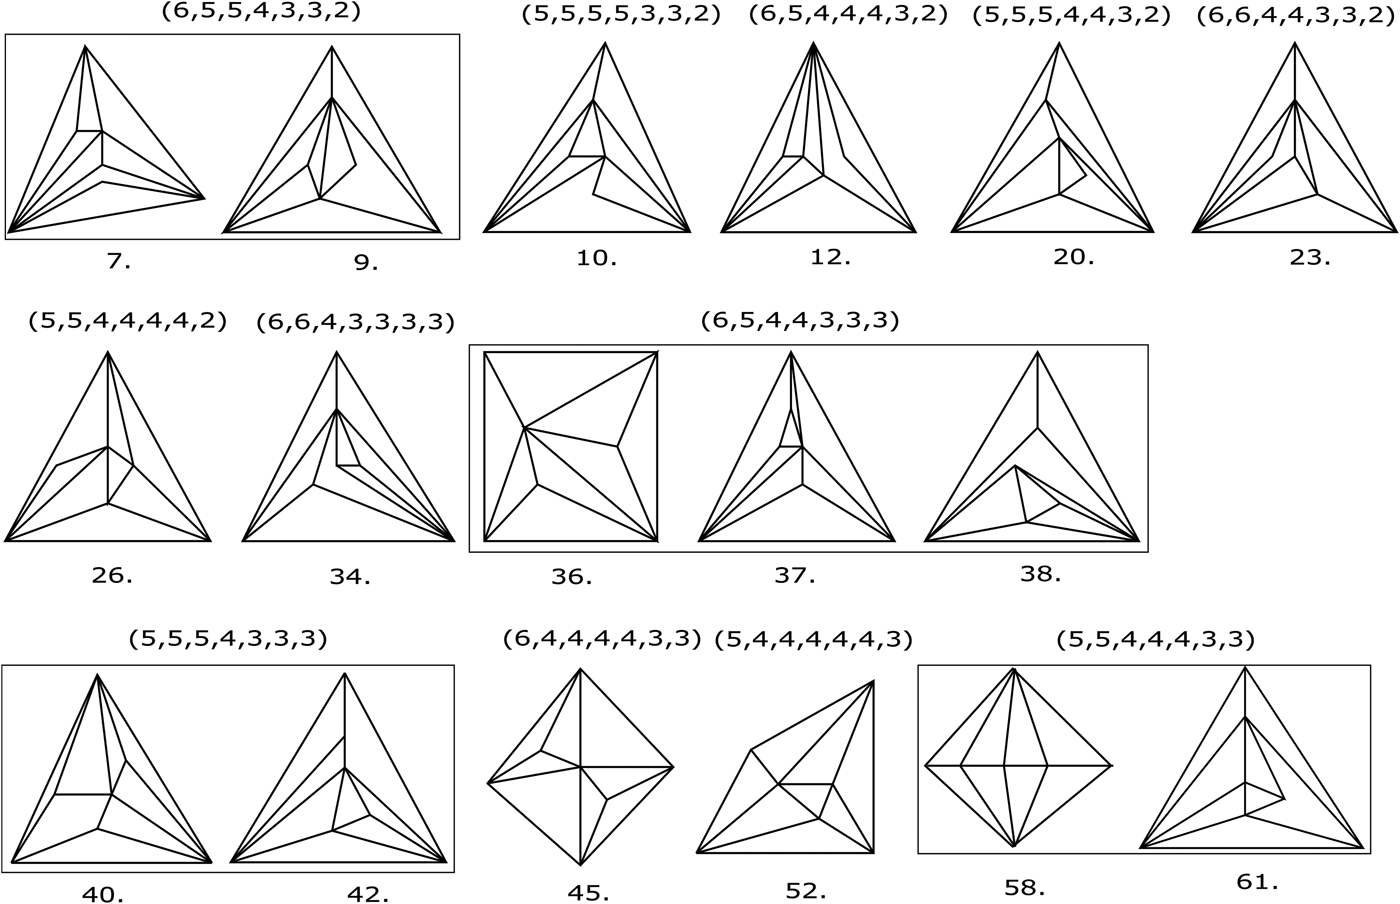
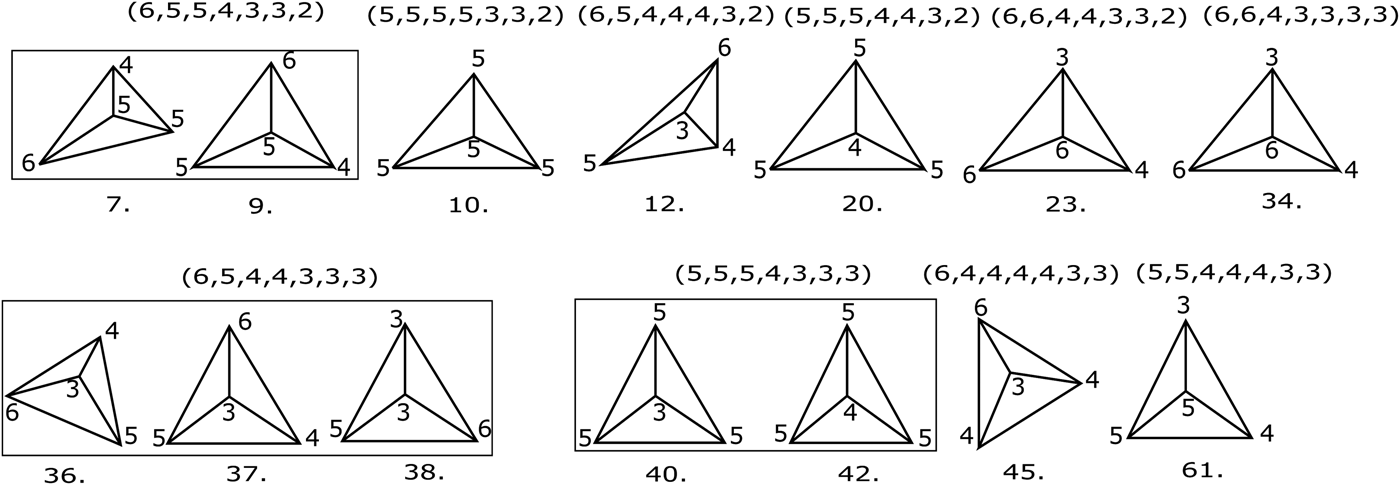
The planar drawings of remaining 17 graphs in Figure 9 are illustrated in Figure 10. In Figure 10, there are 14 graphs containing K 4 as illustrated in Figure 11, where a number close to a vertex represents its degree.
All possible planar graphs with seven vertices and 3n − 7 = 14 edges (the numbering used for the graphs is taken from Fig. 9)

Graph K 4 that is present in the planar graphs shown in Figure 10 (the numbers associated with each vertex is its degree)

Now, there remain three graphs, that is, the graphs numbered 26, 52, and 58 in Figure 9, for which we need to check the existence of rectangular floor plans. For graph 26, after deletion of the vertex with degree 2, remaining graph has 6 vertices and 13 > (3n − 7 = 11) edges. Hence, there does exist a rectangular floor plan corresponding to the graph 26 in Figure 9. The rectangular floor plans corresponding to the graphs 52 and 58 in Figure 9 are illustrated in Figures 12b and d. This implies that there exist two maximal graphs corresponding to n = 7.
All distinct maximal graphs and corresponding rectangular floor plans when n = 7 (the number present in each room is its degree, from which the degree sequence of corresponding floor plan can be derived)

Proposition 8. For n > 3, the maximal graphs only belong to any one of the groups:
(i) graph with 3n − 7 edges for which a rectangular floor plan exists,
(ii) graph with degree sequence
$\{ n - 1\comma \,\underbrace {3\comma \, \ldots\comma \, 3}_{n - 1\,times}\} $ (W n).
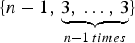
Proof. From the sections “Maximal rectangular floor plans with six rooms” and “Maximal rectangular floor plan with seven rooms”, for n > 4, we can conclude the following:
(i) it is always possible to construct a rectangular floor plan with 3n − 7 edges in its dual graph (starting with Fig. 12b, keep adding a room in a clockwise direction such that the room must be adjacent to three existing rooms; for further details refer to (Shekhawat, Reference Shekhawat2014)) where the maximum degree of any room can be at most n − 2,
(ii) it is not possible to construct a rectangular floor plan with 3n − 7 edges in its dual graph if the maximum degree of at least one room is n − 1 (refer to Proposition 5),
(iii) it is always possible to construct a rectangular floor plan whose dual graph has degree sequence
$\{ n - 1\comma \,\underbrace {3\comma \, \ldots\comma \, 3}_{n - 1\,{\rm times}}\} $ (refer to Proposition 6).

The above three points imply that the degree sequence of any graph G n for which a rectangular floor plan exists is always less than the degree sequence of one of the maximal graphs with 3n − 7 edges or the maximal graph with degree sequence 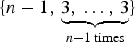 $\{ n - 1\comma \,\underbrace {3\comma \, \ldots\comma \, 3}_{n - 1\,{\rm times}}\} $. □
Best Connected Rectangular Floor Plans
Definition 6. A rectangular floor plan R F (n), represented by  $R_{BC}^F (n)$, is called best connected if its dual graph has 3n − 7 edges.
From Proposition 8 we can see that to have generic rectangular floor plans for given number of rooms, we must compute all maximal graphs with 3n − 7 edges (the maximal graph with degree sequence 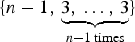 $\{ n - 1\comma \,\underbrace {3\comma \, \ldots\comma \, 3}_{n - 1\,{\rm times}}\} $ is a well-known wheal graph). But the procedure used in the section “Methodology” to compute maximal graphs with 3n − 7 edges involves a lot of computation (refer to Table 1) and there may be a chance of an error. To cross-check the results presented in the section “Methodology”, and to derive generic rectangular floor plans with eight and nine rooms, we introduce a new methodology in this section as follows:
Total number of possible unlabeled graphs, derived from K n, with less than or equal to 3n − 7 edges when n = 5, 6, 7 respectively (here,  $\left( {\matrix{ n \cr k \cr}} \right) = \displaystyle{{n!} \over {k!(n - k)!}}$)

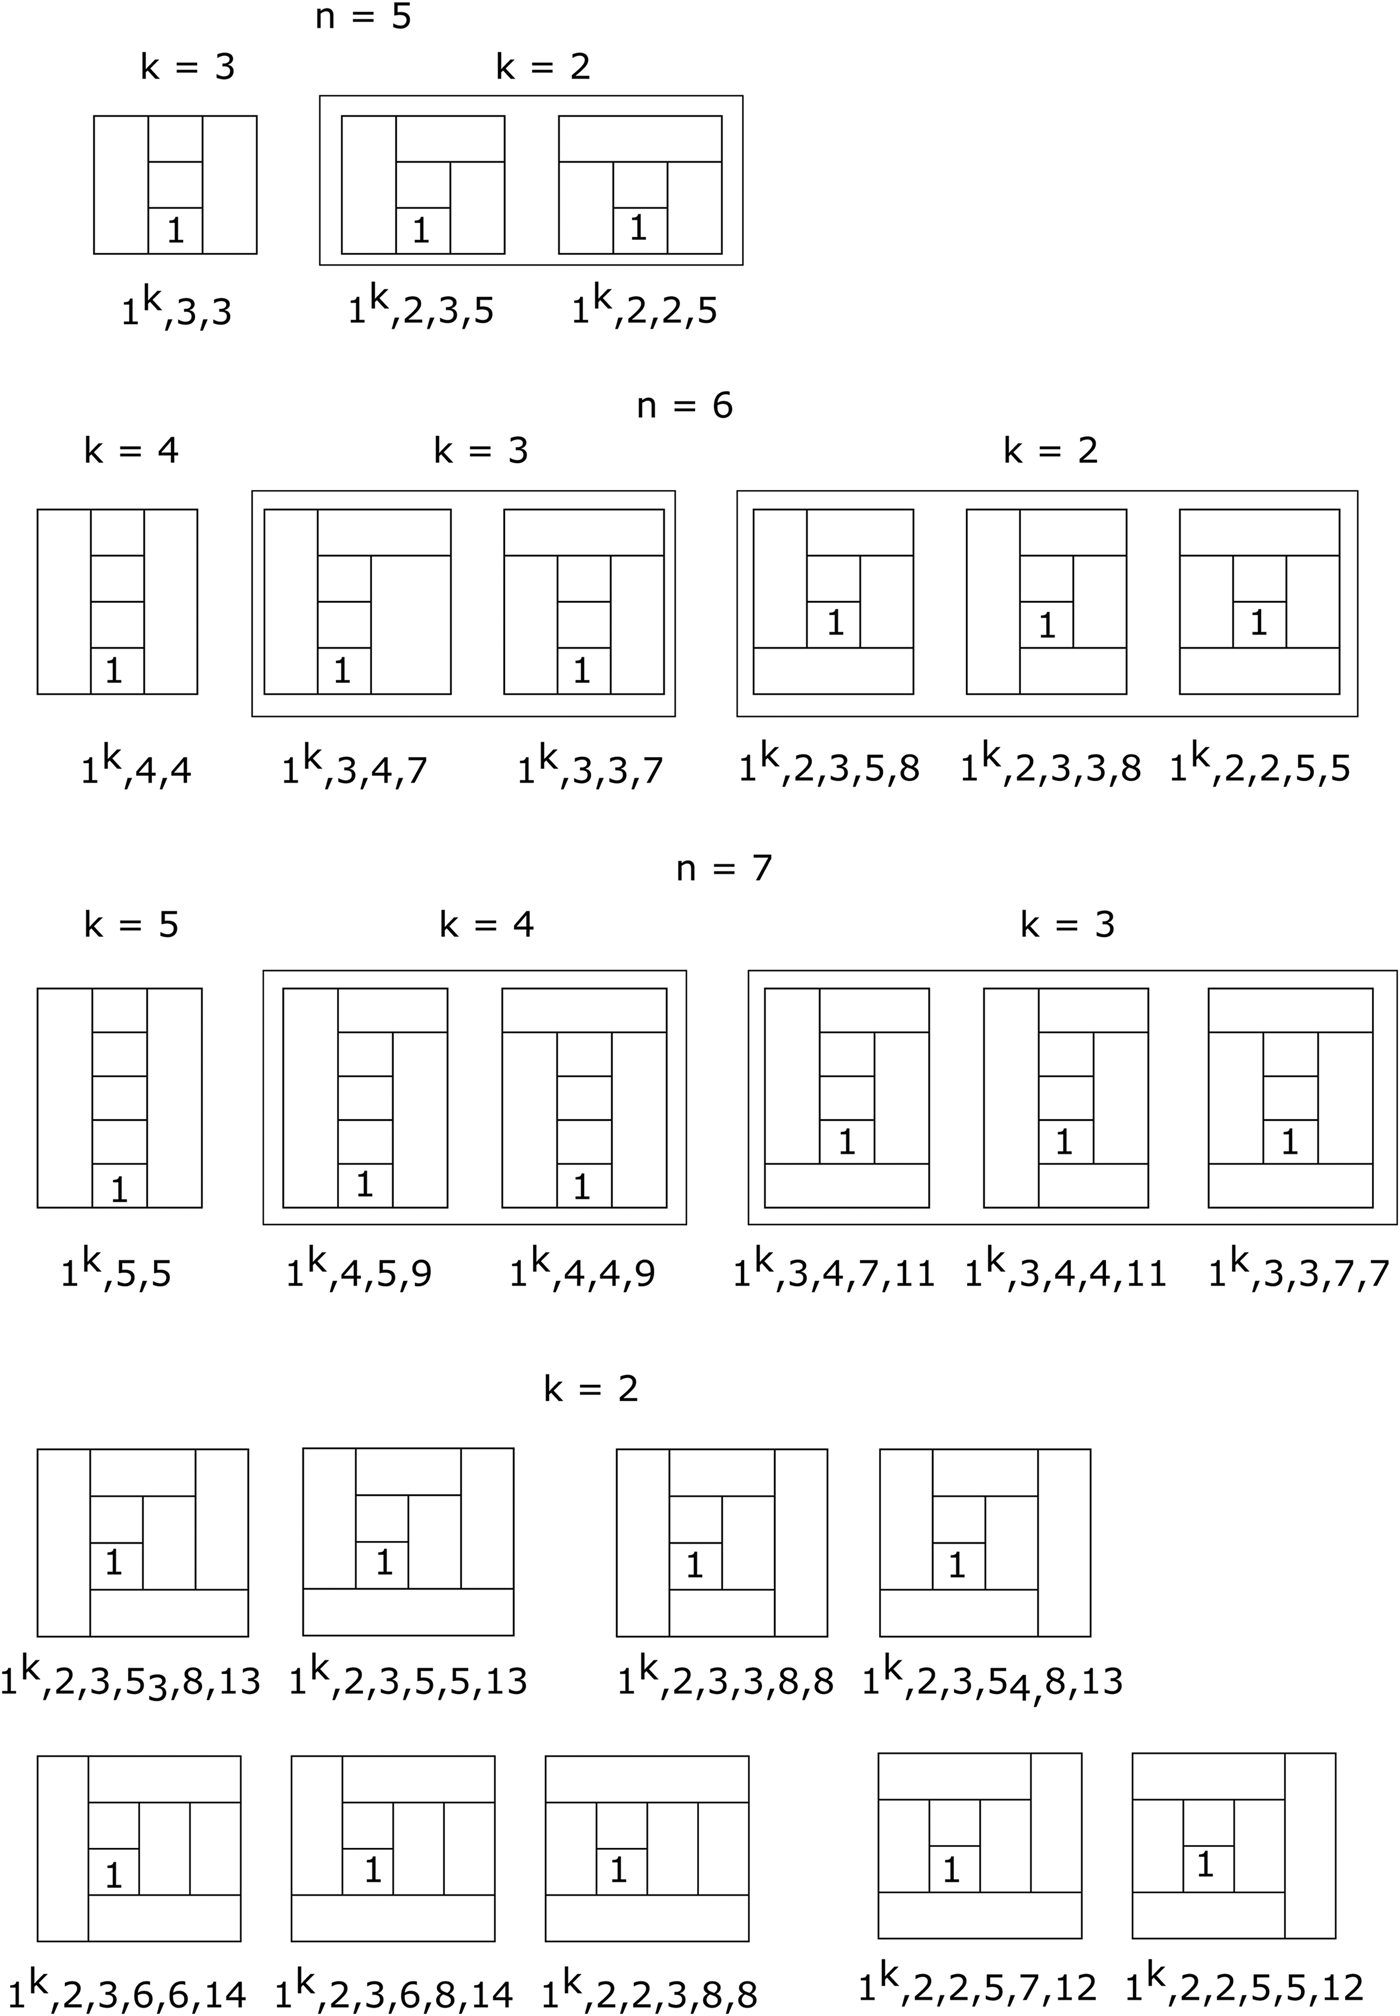
First, we construct all possible best connected rectangular floor plans for 4 < n < 10. Then, among all possible floor plans, we pick the ones having distinct dual graphs. Interestingly, this procedure serves two purposes. First, it leads to the computation of generic rectangular floor plans. At the same time, it covers all possible plans corresponding to maximal graphs with 3n − 7 edges. For better understanding, refer to Figure 13 where best connected rectangular floor plans with five, six and seven rooms respectively, have been demonstrated. In this figure, k represents the first k rooms arranged one above the other such that each drawn room shares a full wall with the last drawn room. It can be verified easily that, for best connected rectangular floor plans, 1 < k < n − 1. Therefore, for the construction of these floor plans, we start with k = n − 2 and go till k = 2 while decreasing k by one at each step. For a better understanding, the construction of best connected rectangular floor plans with different values of k, refer to (Shekhawat & Duarte, Reference Shekhawat, Duarte and Gero2017).
All topologically distinct best connected rectangular floor plans with five, six, and seven rooms respectively (corresponding to each floor plan, a labeling is assigned where 1k represents 1, 1, …, 1 (k times)). In this figure and in Figures 14, 16–18, the first room to be placed for obtaining the compositional schema of a rectangular floor plan is the one with number “1” written in its centre. Then, k − 1 rooms are drawn where k is the number of rooms arranged one above the other such that each drawn room shares a full wall with the last drawn room. After drawing k rooms, the next room is the one sharing its full wall with all the k rooms. In the same fashion, remaining rooms in the compositional schema can be identified by looking for the next room that is sharing its full wall with some of the existing rooms. The compositional schema can also be identified from the labeling assigned to each floor plan whose details are given in the next section

In Figure 13, a numbering has been assigned to each floor plan to show that all generated floor plans are topologically distinct. For the details about this numbering, refer to the section “Rectangular floor plans labeling”.
For a comparison of the method for computing maximal graphs with 3n − 7 edges presented in the section “Maximal rectangular floor plan with eight and nine rooms” with the method presented in the section “Methodology”, refer to Table 2.
Comparing the two methods presented in the sections “Methodology” and “Best connected rectangular floor plans” respectively for computing maximal graphs with 3n − 7 edges

Maximal rectangular floor plan with eight and nine rooms
Definition 7. Two rectangular floor plans with a same number of rooms are said to be distinct if their dual graphs are distinct.
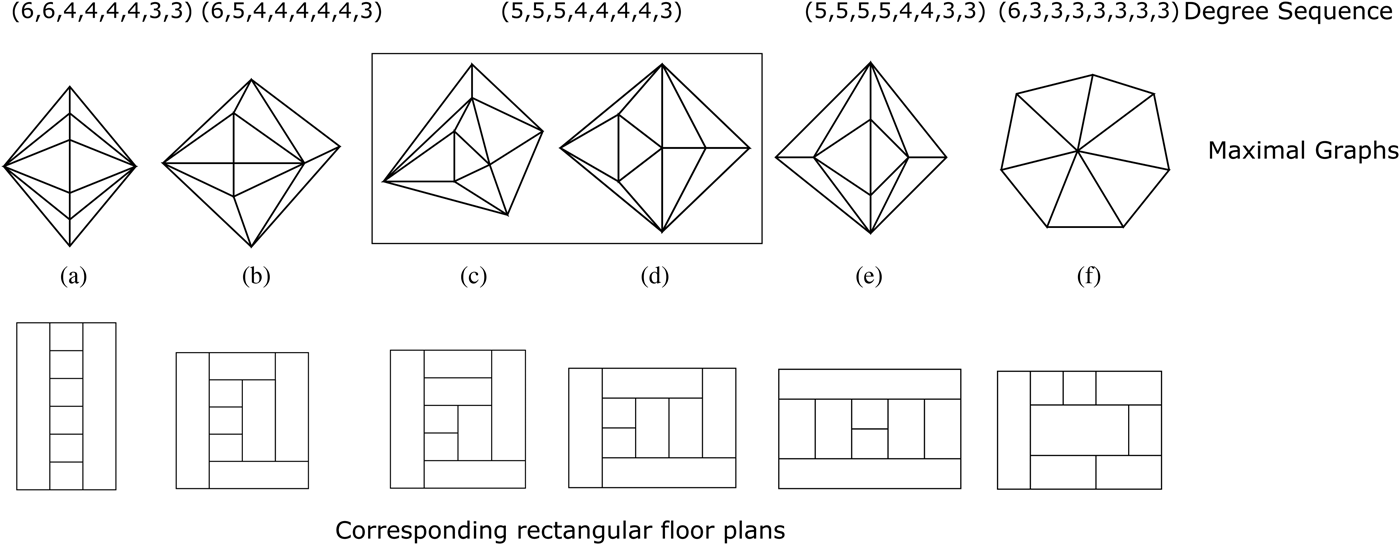
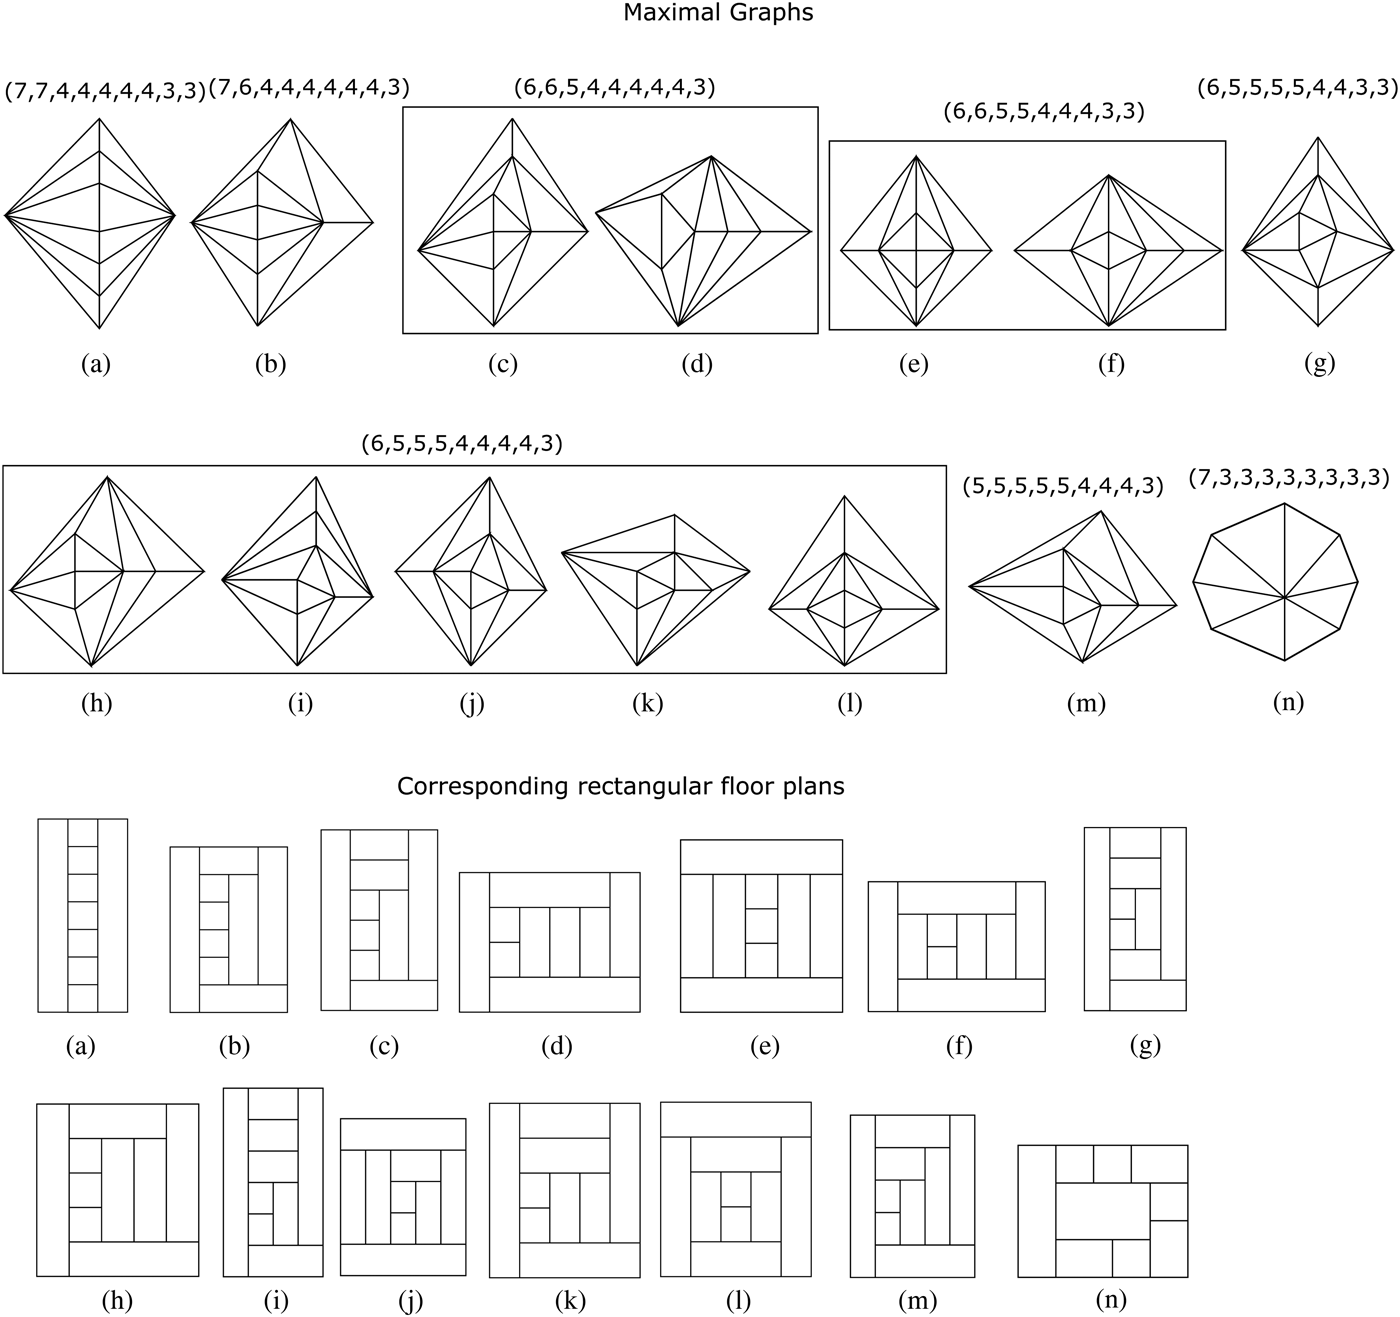
For n = 8, there exists 44 topologically distinct best connected rectangular floor plans (refer to Fig. 14), out of which there are only five distinct maximal rectangular floor plans, as shown in Figure 15(a–e). This implies that for n = 8 there exists five maximal graphs with 3n − 7 edges.
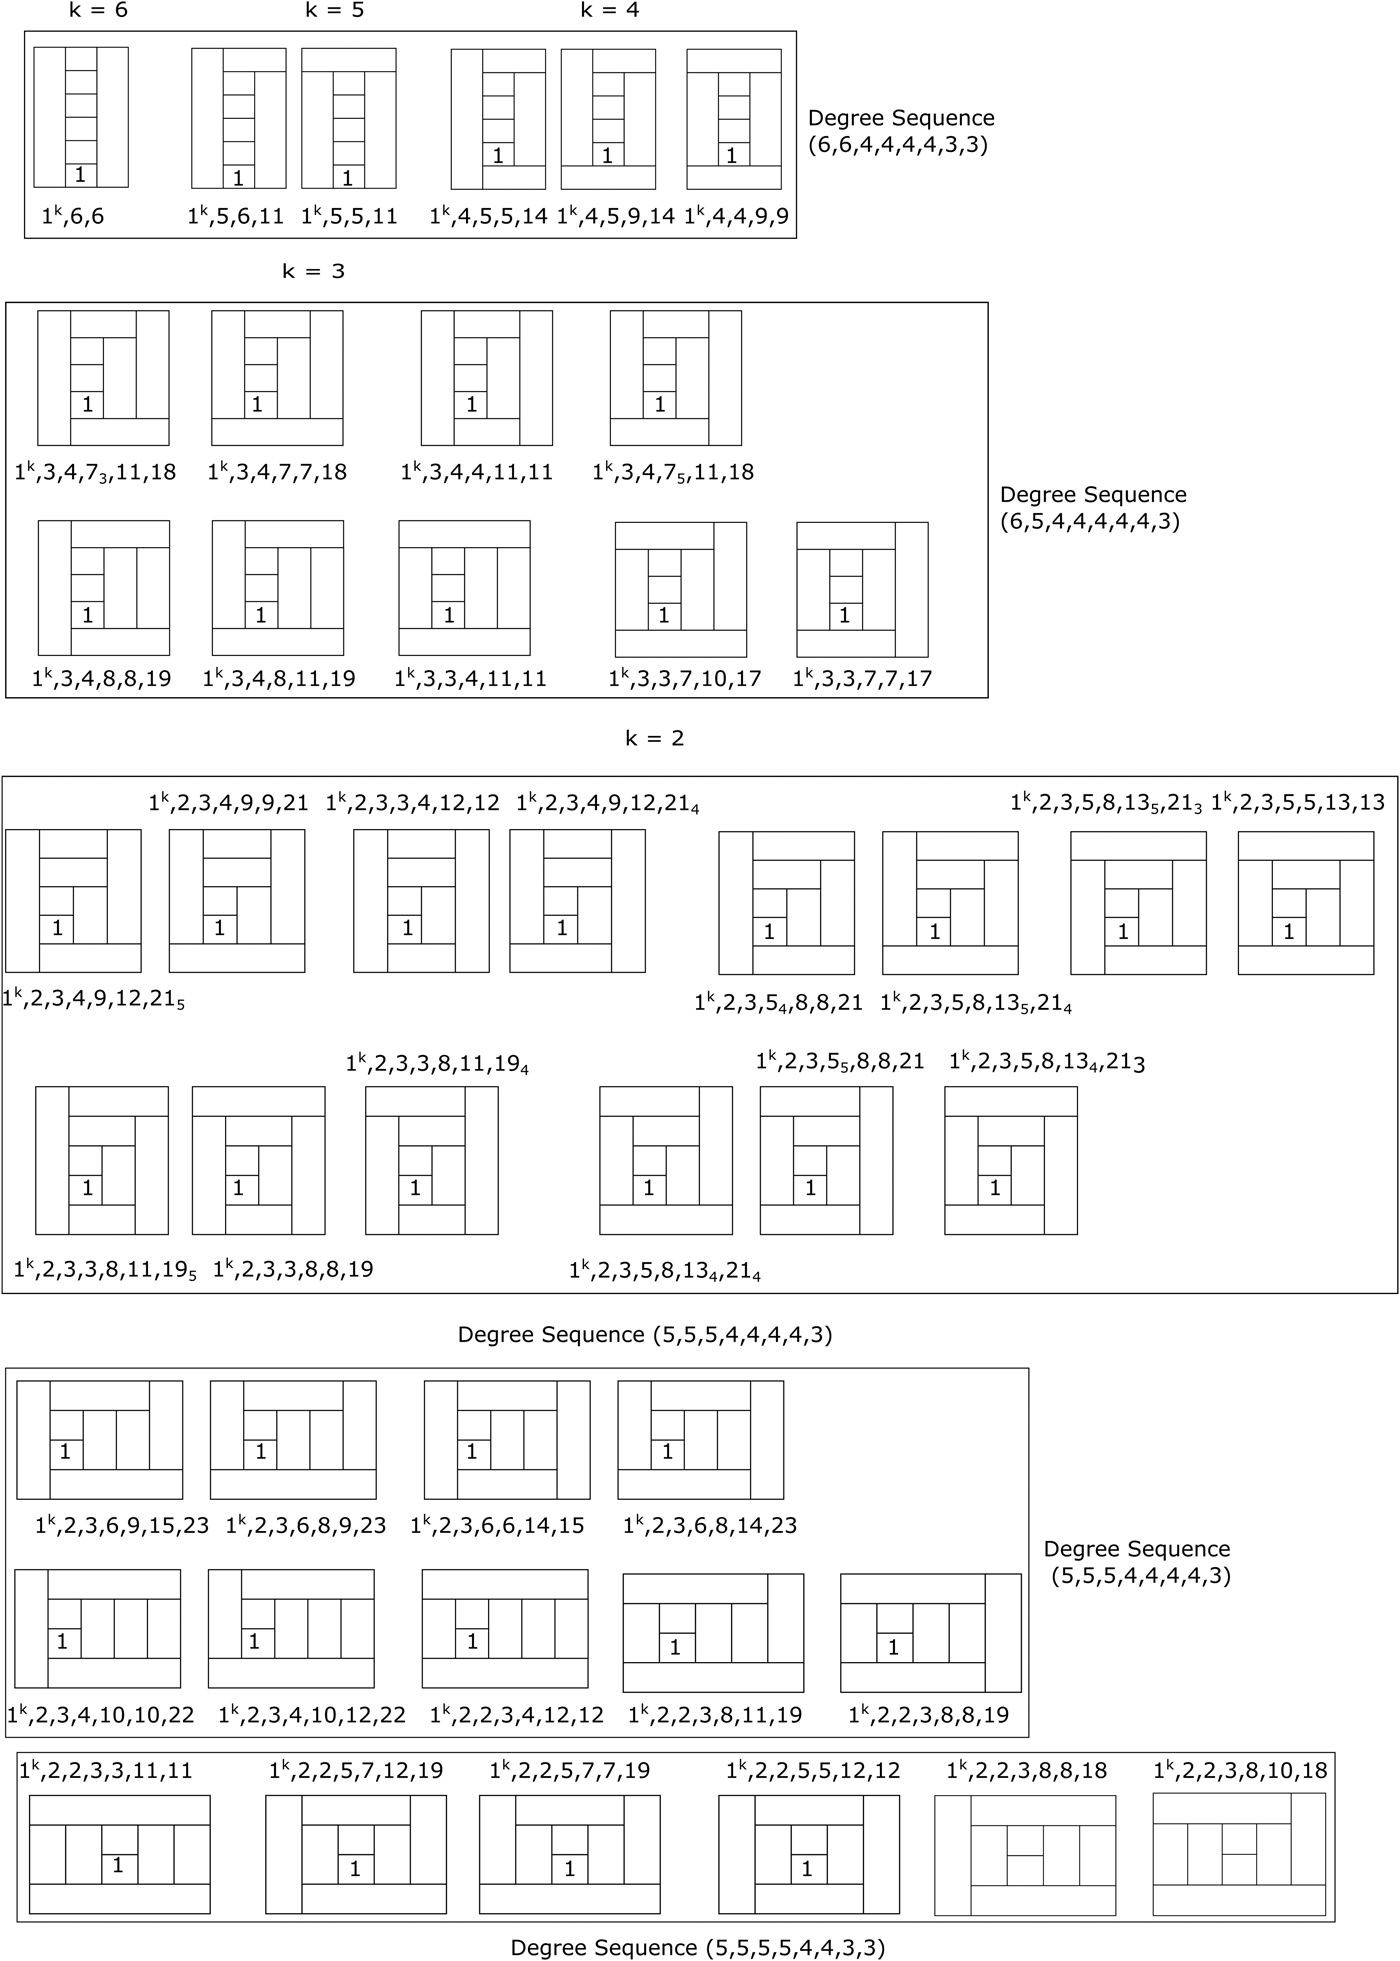
All topologically distinct best connected rectangular floor plans with eight rooms (here, there are five distinct boxes with floor plans, where the dual graphs of all floor plans inside a box are the same and duals graphs of any two floor plans present in two different boxes are distinct)

All distinct maximal graphs with eight vertices and corresponding rectangular floor plans

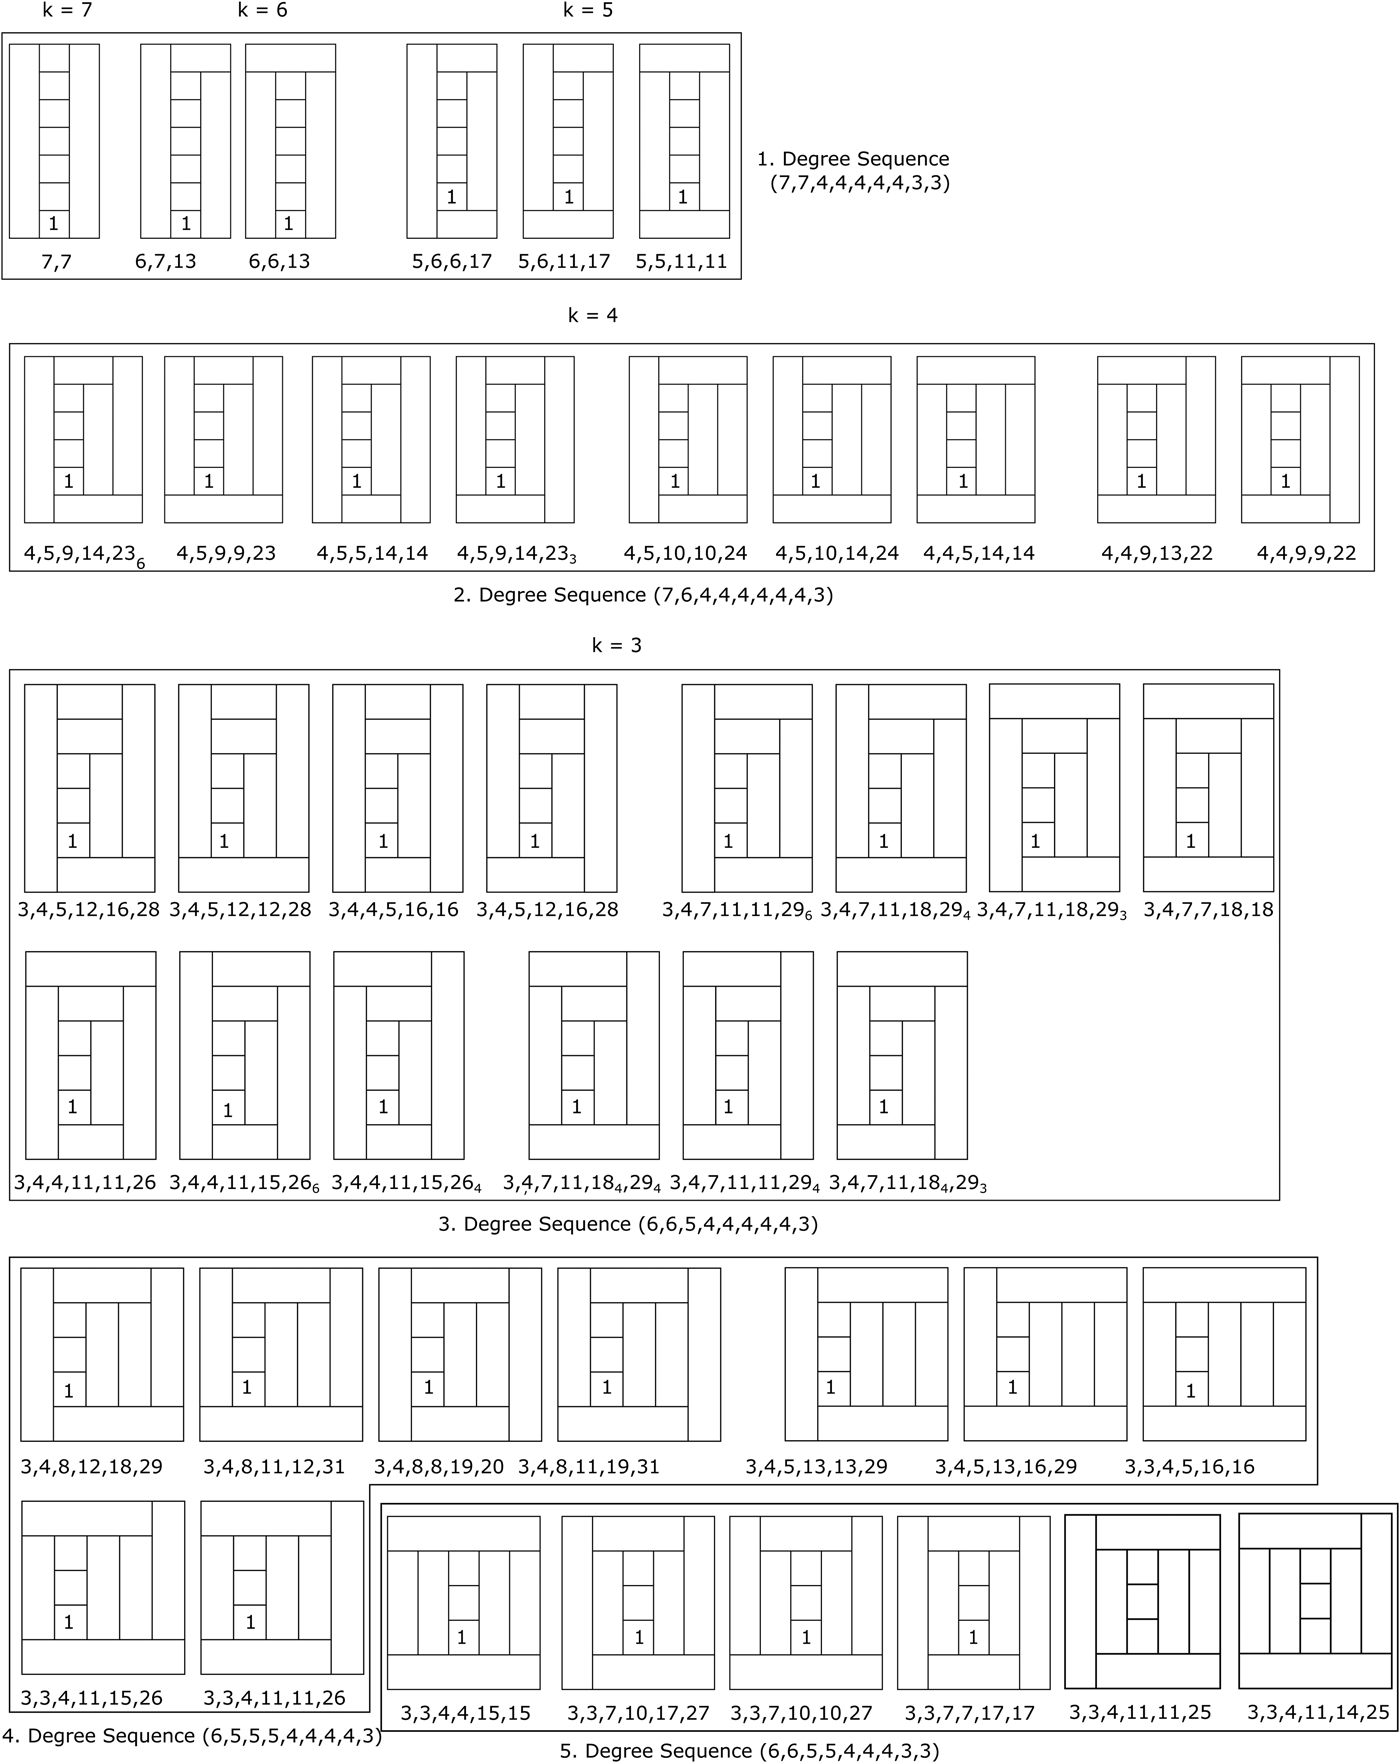
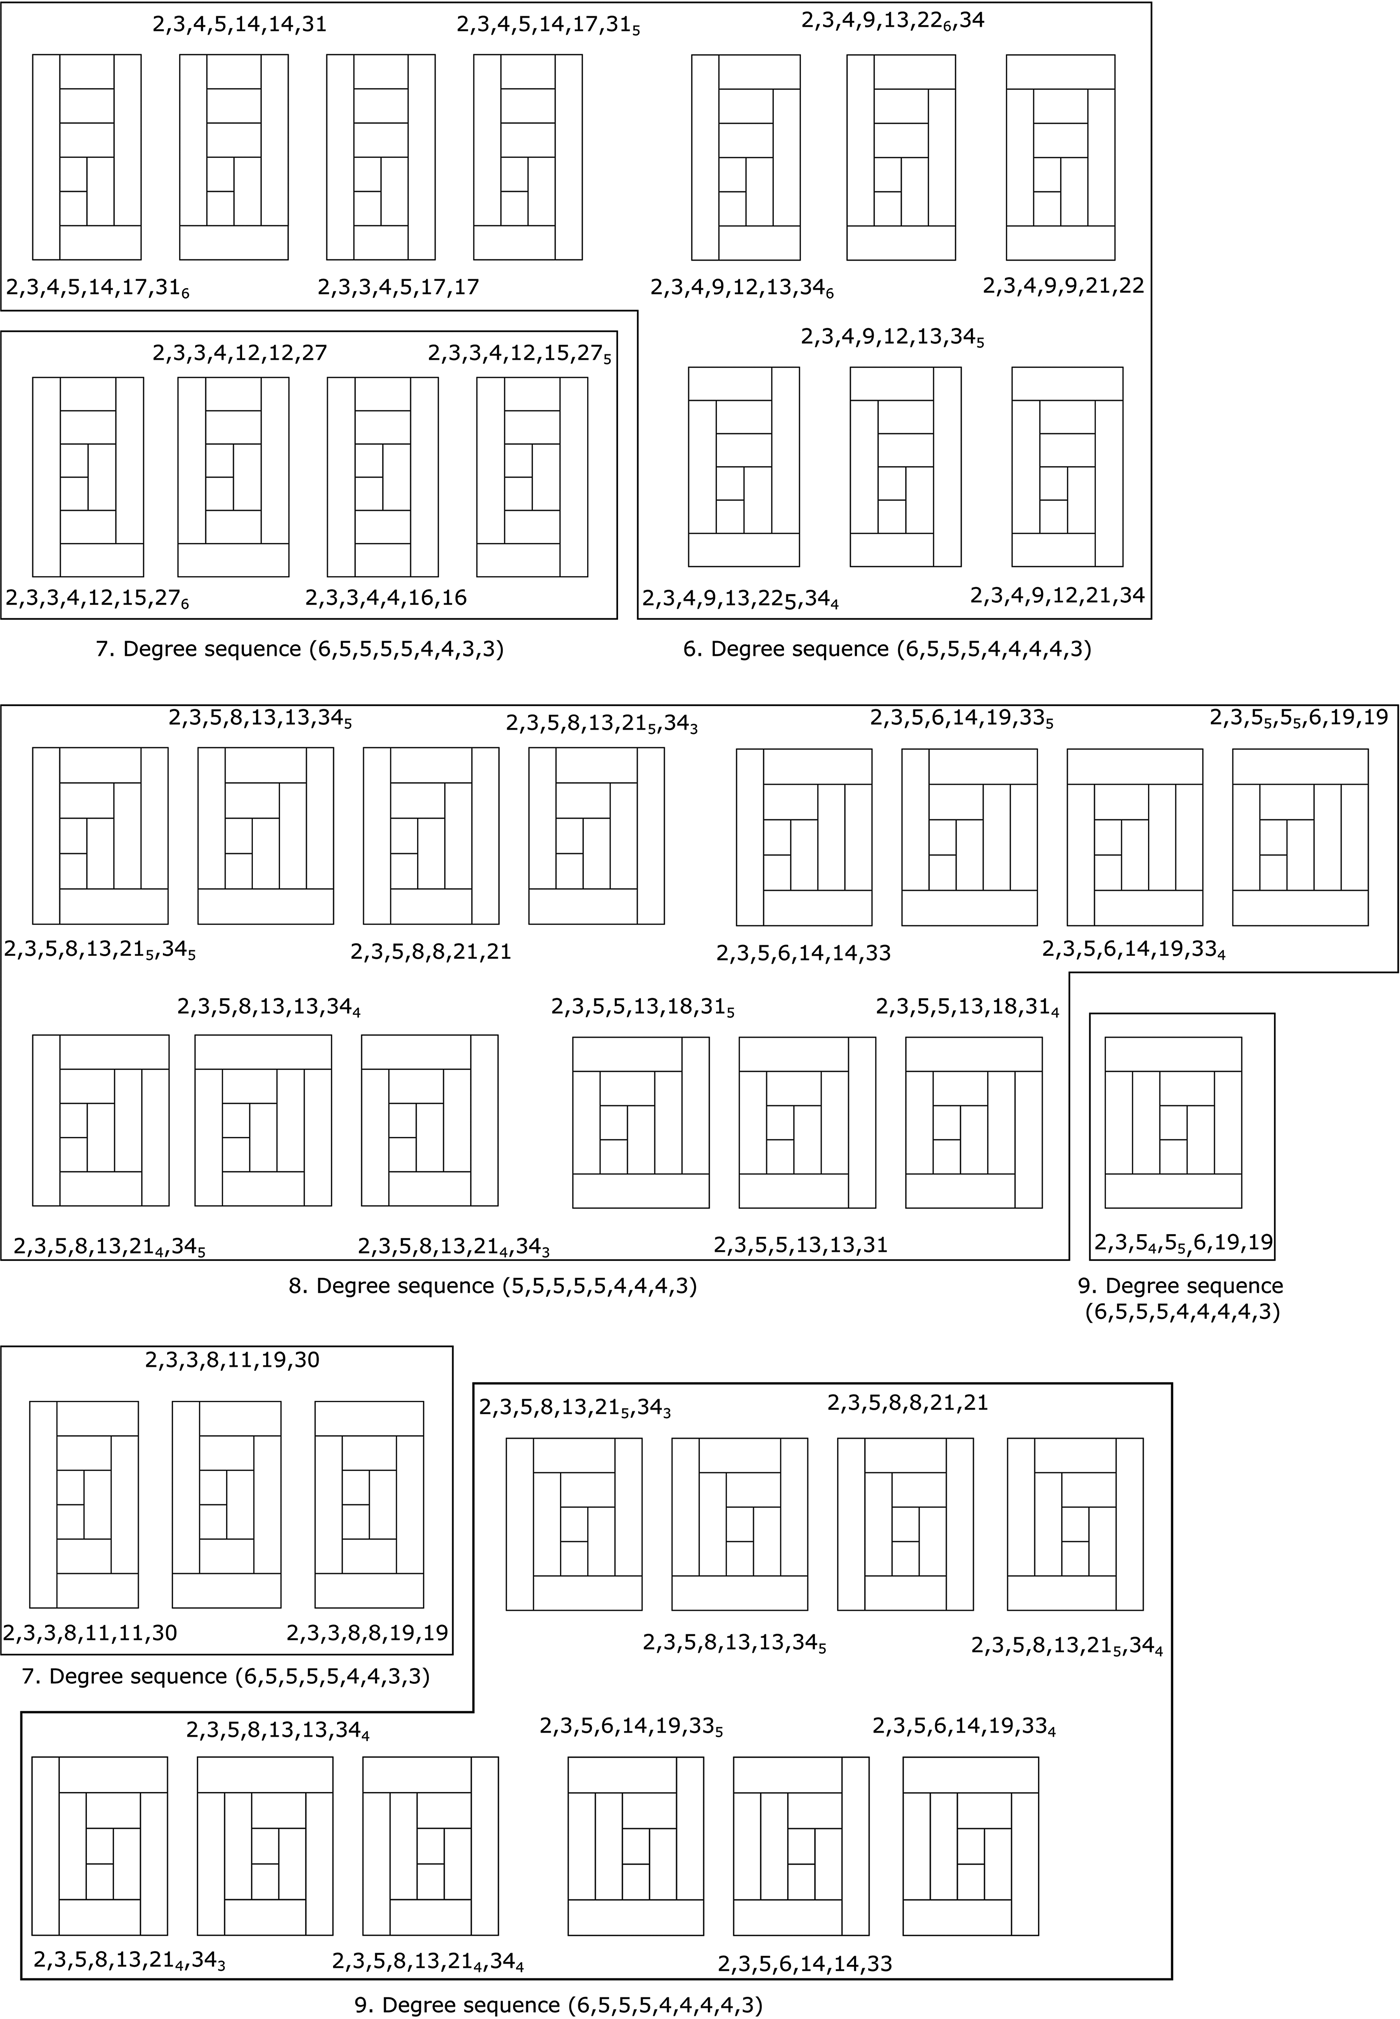
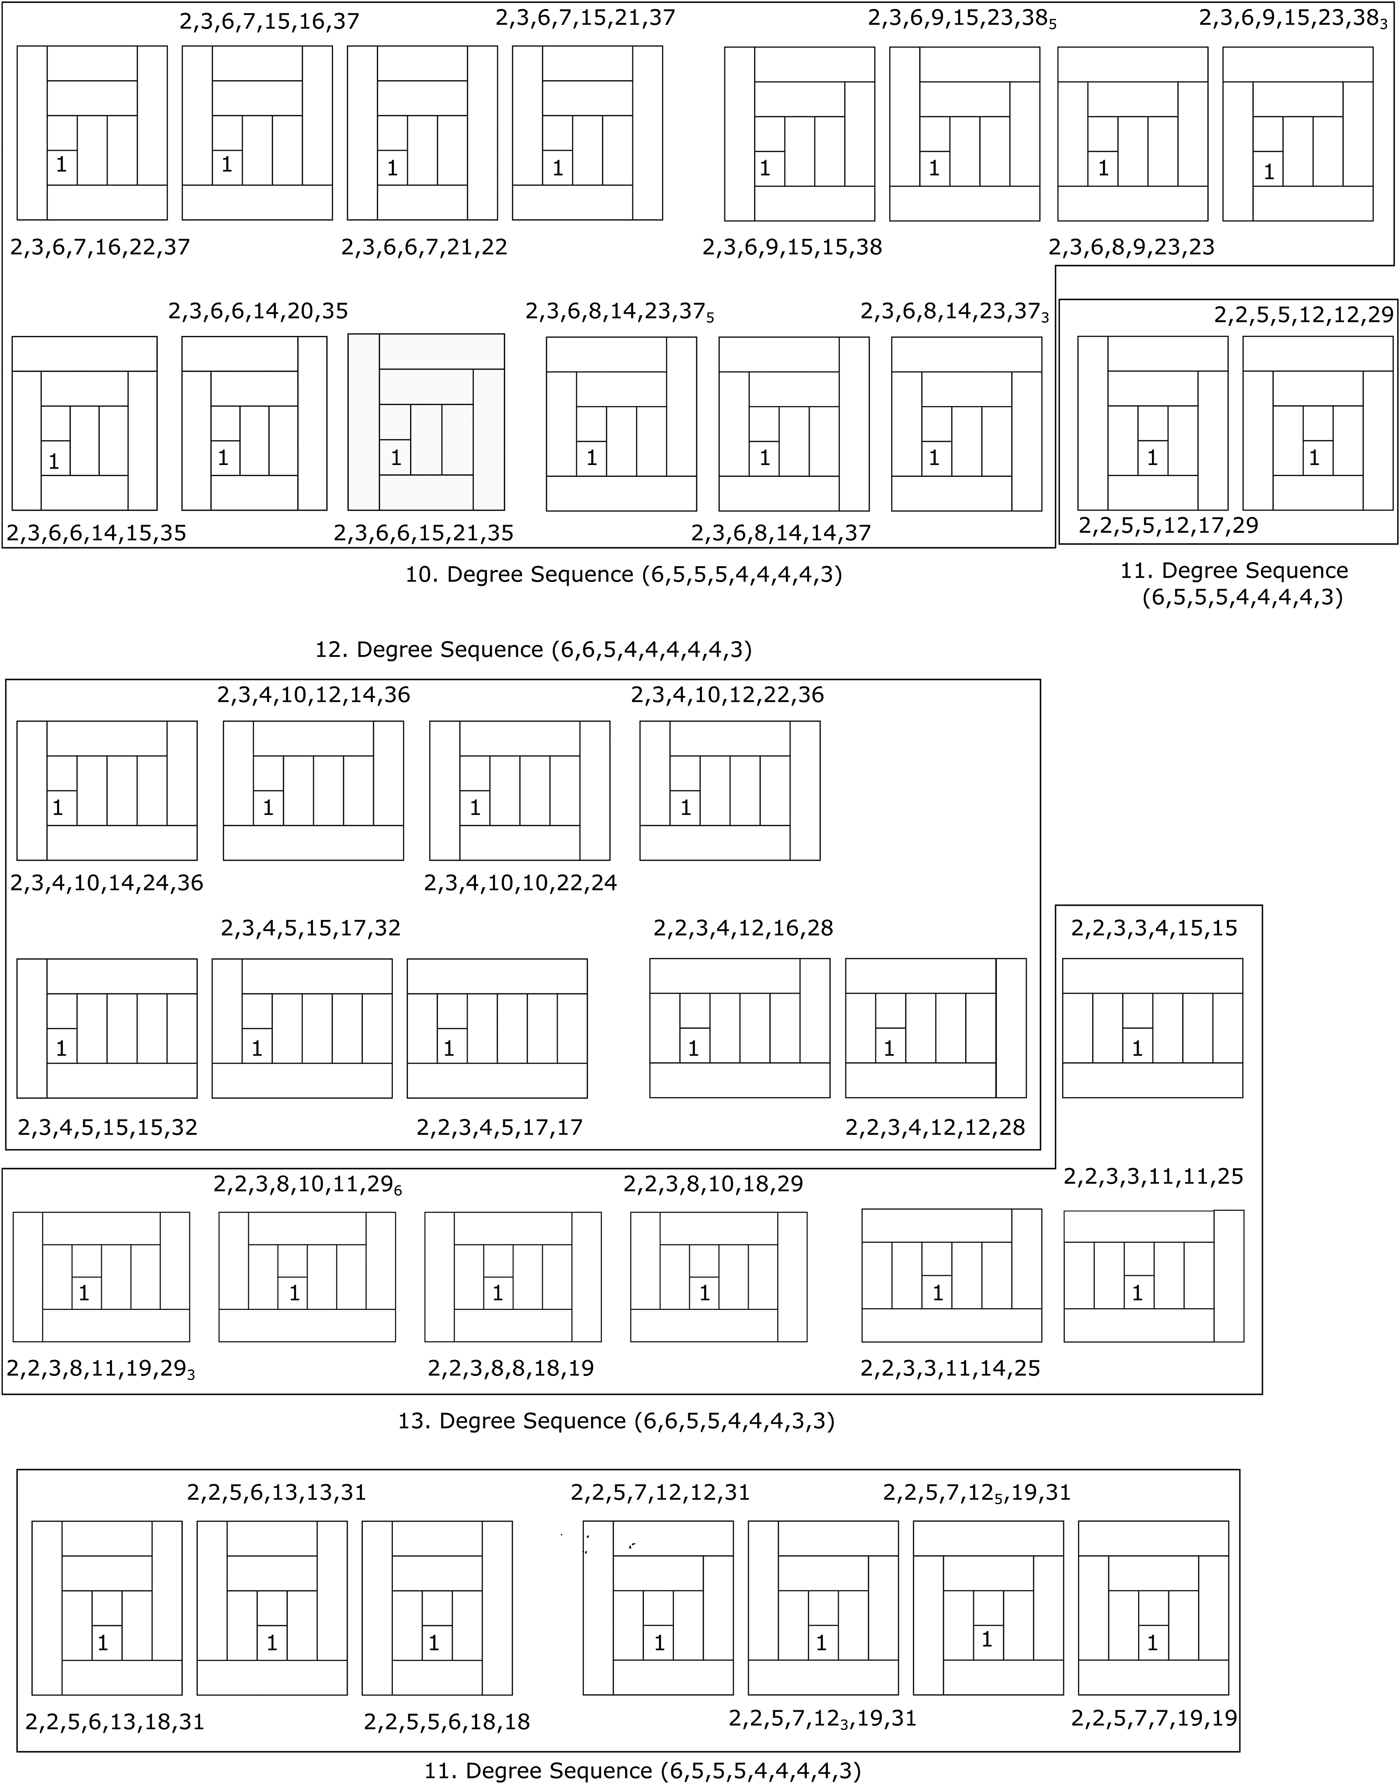
For n = 9, there exists 125 topologically distinct best connected rectangular floor plans (refer to Figs. 16–18), out of which there are only 13 distinct maximal rectangular floor plans, as shown in Figure 19(a–m). This implies that for n = 9 there exists 13 distinct maximal graphs with 3n − 7 edges (in the labeling of rectangular floor plans in Figs. 14, 16–18, each labeling must have 1k as its first term but due to a shortage of space, it has not been displayed in the corresponding Figures. Here, 1k represents 1, 1, …, 1 (k times)).
All topologically distinct best connected rectangular floor plans with nine rooms when 2 < k < 8 ((In Figs. 16–18, there is a total of 13 different boxes with distinct numbering, where the dual graphs of all floor plans inside the boxes with the same numbering are the same and the dual graphs of any two floor plans present in two different boxes with different numbering are distinct))

Forty-two topologically distinct best connected rectangular floor plans with nine rooms when k = 2

Thirty-nine topologically distinct best connected rectangular floor plans with nine rooms when k = 2

All distinct maximal graphs with nine vertices and corresponding rectangular floor plans

Rectangular Floor Plans Labeling
In the section “Best connected rectangular floor plans”, we presented all possible topologically distinct best connected rectangular floor plans for 4 < n < 10.
Definition 8. Two rectangular floor plans with a same number of rooms are said to be topologically distinct (or non-isomorphic) if one cannot be derived from the other using the following transformations (Stiny, Reference Stiny1980):
(i) Translation
(ii) Rotation
(iii) Reflection
(iv) Scaling
(v) Any composition of the above
Now, it can be verified visually that the rectangular floor plans presented in Figures 14, 16–18, are topologically distinct but in the literature, we did not find a procedure for checking the isomorphism or non-isomorphism of given rectangular floor plans. In this section, the idea is to associate a unique representation or labeling to a rectangular floor plan which can be easily used to check the non-isomorphism of given rectangular floor plans.
The steps used for deriving a labeling for a rectangular floor plan are as follows (here we are considering the rectangular floor plans in which each room is arranged in such a way that the composition of drawn rooms is always rectangular):
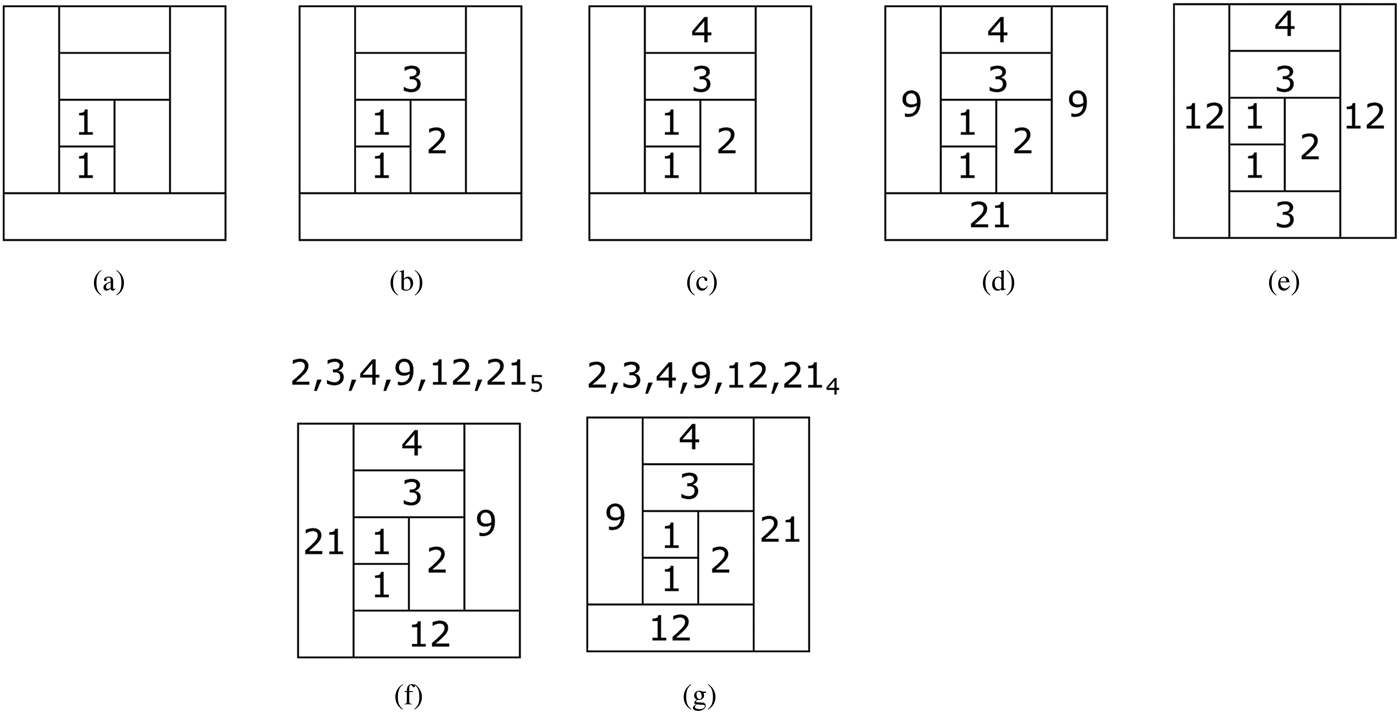
(i) Assign number “1” to first k rooms arranged one above the other (see Fig. 20a).
(ii) The number assigned to a room (other than the first k rooms), that is adjacent to more than one existing rooms, is equal to the sum of the numbers corresponding to the rooms adjacent to it (see Figs. 20b and d).
(iii) The number assigned to a room (other than the first k rooms), that is adjacent to only one of the existing rooms, is equal to one plus the number corresponding to the room adjacent to it (see Fig. 20c).
(iv) A monotonic non-increasing sequence of the numbers associated with the rooms is a labeling associated with the floor plan. If two-floor plans have different labeling, then they are non-isomorphic (e.g. Figures 20d and e are non-isomorphic).
(v) If two-floor plans have the same labeling then we redefine the labeling by associating a subscript with each of the numbers, that is equivalent to the degree of the corresponding room. Again, if two-floor plans have different labeling, then, they are non-isomorphic. For example, initially, Figures 20f and g have the same labeling but after adding subscripts, we can see that they are non-isomorphic.
Labeling of rectangular floor plans

Results
The detailed description of the generic graphs for n = 4, 5, …, 9 are as follows:
• For n = 4, 5, the generic graphs consist of a set with only one maximal graph as illustrated in Figures 3a and 4c respectively.
• For n = 6, the generic graphs consist of a set of two maximal graphs as illustrated in Figures 7b and d.
• For n = 7, the generic graphs consist of a set of three maximal graphs as illustrated in Figures 12a, c and e.
• For n = 8, the generic graphs consist of a set of six maximal graphs as illustrated in Figures 15a–f.
• For n = 9, the generic graphs consist of a set of 14 maximal graphs as illustrated in Figures 19a–n.
Here are three important results that can be concluded from the theory presented in the sections “Methodology”and “Best connected rectangular floor plans”.
Proposition 9. There exists a maximal rectangular floor plan corresponding to any given graph G n if and only if its underlying unlabeled graph is a sub-graph of any one of the maximal graphs corresponding to n.
Proof. For a given n, it is easy to see that any unlabeled graph say G a, which is a sub-graph of a maximal graph  $G_a^M $ can be derived from
 $G_a^M $ by deleting some of its edges, and a rectangular floor plan
 $R_a^F $ corresponding to the
 $G_a^M $ guarantees the existence of a maximal rectangular floor plan corresponding to the graph G a.
Clearly, if the underlying unlabeled graph of the given labeled G a is the sub-graph of the  $G_a^M $, then a maximal rectangular floor plan can be constructed corresponding to the underlying unlabeled graph. Once we have the required floor plan, it can be labeled according to the given G a to have the desired result. □
Proposition 10. There does not exist a rectangular floor plan  $R_n^F $ for a given graph G n if its underlying unlabeled graph is not a sub-graph of any of the maximal graphs corresponding to n.
Proof. Its proof directly follows from Proposition 8.
Proposition 11. For any n, the minimal set of rectangular floor plans corresponding to all maximal graphs form the generic rectangular floor plans  $R_n^G $.
Discussion and Future Work
In this paper, we have presented a necessary and sufficient condition for the existence of maximal rectangular floor plans, that is, we looked for the set of maximal graphs such that any other graph for which a rectangular floor plan exists should be the sub-graph of at least one of the maximal graphs. This result leads to a necessary condition for the existence of a rectangular floor plan R F (n) for a given graph G n, that is, if the underlying unlabeled graph of any given G n is not a sub-graph of any of the maximal graphs, then there does not exist a R F (n) corresponding to the G n. Once the conditions for the existence of maximal rectangular floor plans are satisfied, we can construct a maximal rectangular floor plan for the underlying unlabeled graph of a given graph which can, therefore, be converted into a maximal rectangular floor plan for the given graph. The obtained maximal floor plans will be further transformed into the floor plans corresponding to the given graphs.
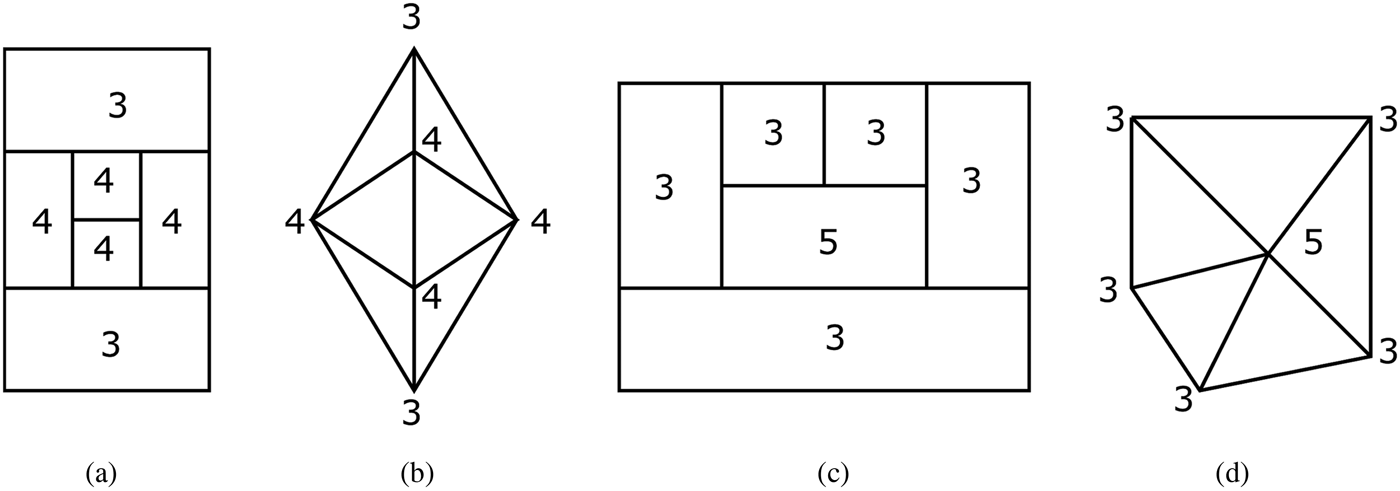
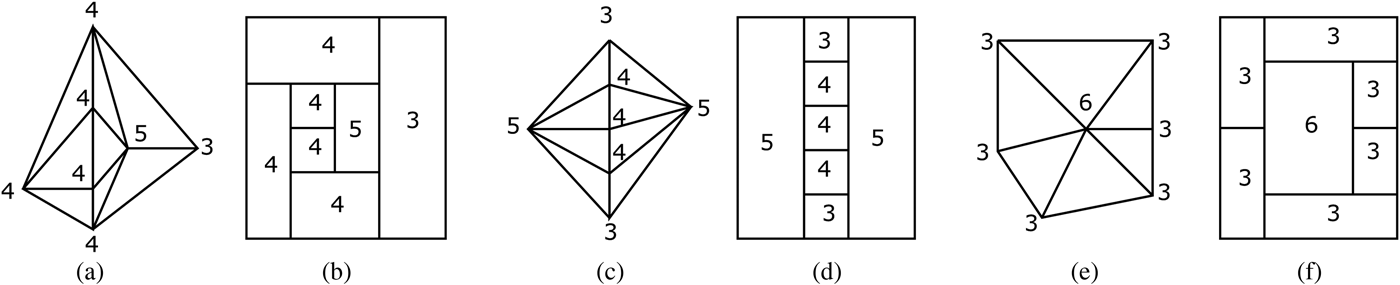
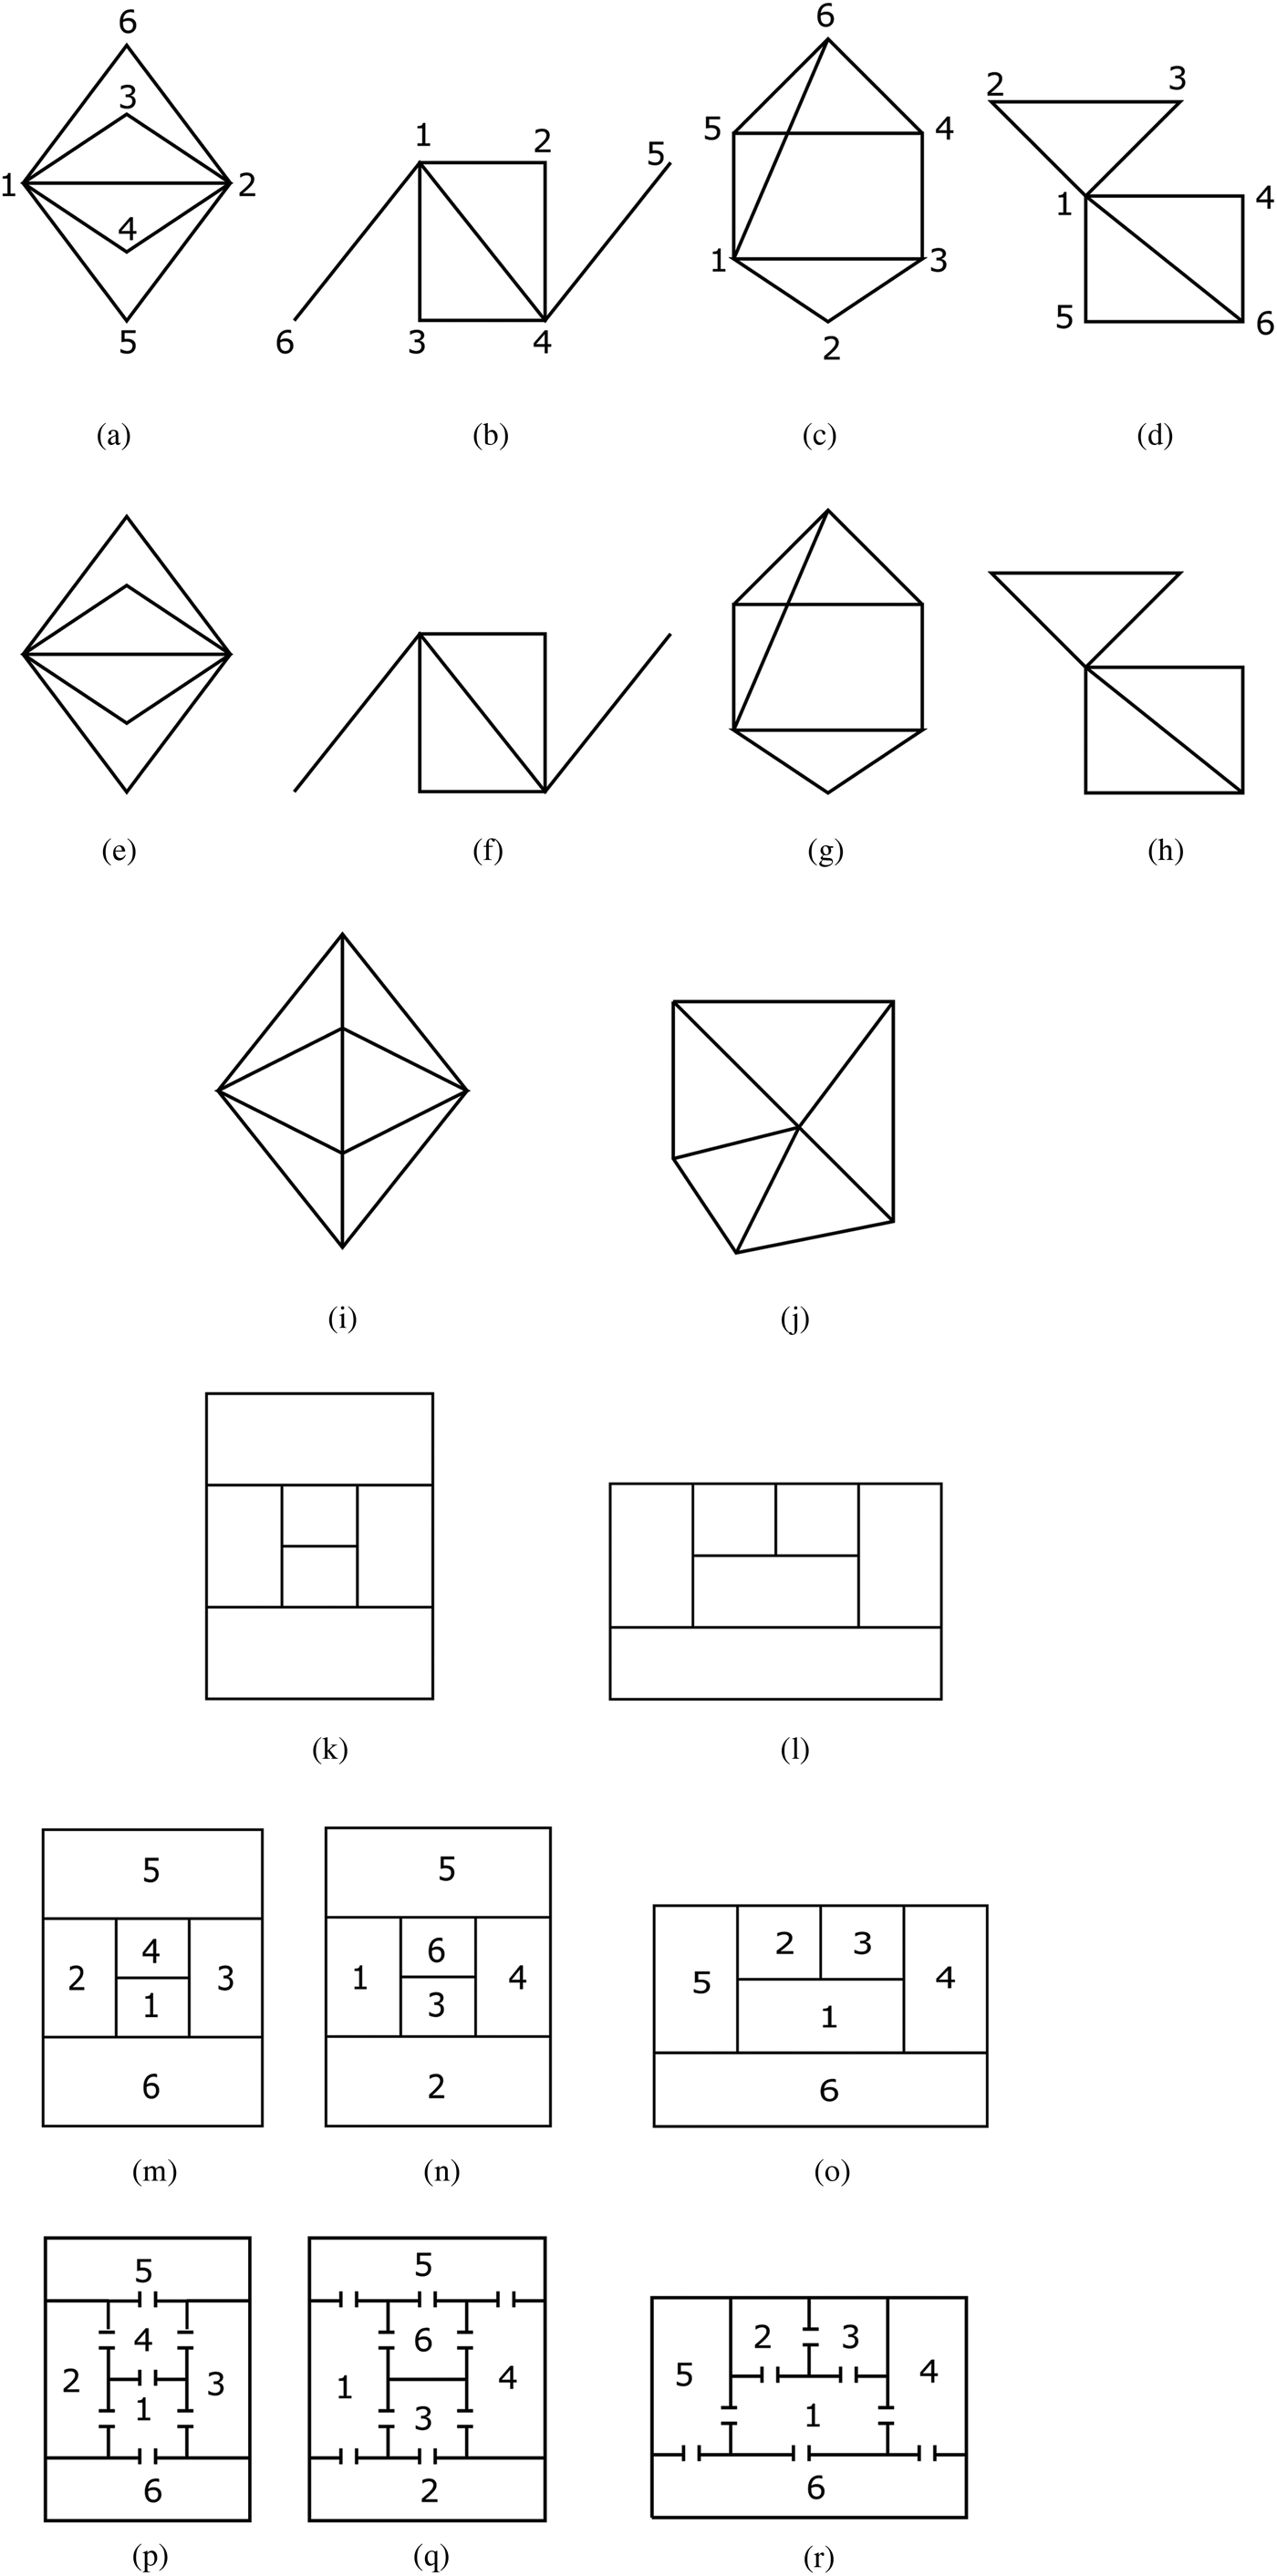
For a better understanding of the results, let us consider that we have been given four graphs as shown in Figures 21a–d and the aim is to construct a rectangular floor plan corresponding to them. To construct the required floor plans, the steps are as follows:
(i) From Proposition 10 and Figure 7, for n = 6, there exist maximal rectangular floor plans for the given graphs if their underlying unlabelled graphs, illustrated in Figures 21e–h, are sub-graphs of any of the maximal graphs shown in Figures 21i and j. Clearly, the graph in Figure 21e is not a sub-graph of any of the maximal graphs because two of its vertices have degree 5 which is not possible for the graphs in Figures 21i and j. It can be verified that the graphs in Figures 21f and g are the sub-graphs of Figure 21i whereas the graph in Figure 21h is a sub-graph of Figure 21j. This implies that there exist maximal rectangular floor plans for the graphs in Figures 21b to d but there does not exist a rectangular floor plan for the graph in Figure 21a.
(ii) The rectangular floor plans corresponding to Figures 21i and j are illustrated in Figures 21k and l respectively. The rectangular floor plan R F (6) in Figure 21k is a maximal rectangular floor plan for the graphs in Figures 21f and g while the R F (6) in Figure 21l is a maximal rectangular floor plan for the graph in Figure 21h.
(iii) Once we have constructed a maximal rectangular floor plan
$R_M^F (n)$ for the underlying unlabelled graph of the given graph G n, the next step is to convert this $R_M^F (n)$ into a $R_M^F (n)$ corresponding to the given G n. For example, the $R_M^F (6)$ corresponding to the graphs in Figures 21b–d are demonstrated in Figures 21m–o respectively. Clearly, these are derived from the $R_M^F (6)$ in Figures 21k and l.(iv) The maximal floor plans can be transformed into the floor plans corresponding to the given graphs by inserting a door between the rooms whose corresponding vertices are adjacent in the given graph. For example, Figures 21p–21r are the required floor plans corresponding to the graphs in Figures 21b–d. It should be noted that if there is no door between two rooms then they are not connected; for example in Figure 21p, rooms two and five are not connected.


Example demonstrating the results of this paper

This work leads to a considerable number of relevant open problems which we would like to cover in the near future.
(i) In this paper, we proposed a method to compute generic rectangular floor plans and enumerate them for 4 < n < 10. This method can be used to compute generic rectangular floor plans for any n but it involves a lot of computation and it is not an easy approach to generalize. Actually, it will be difficult for hand enumeration beyond n = 9 and a proof technique that is not based on exhaustive enumeration is not obvious. In the future, we intend to look for such a proof technique.
(ii) How to compute that the underlying unlabeled graph of a given graph is a sub-graph of any other unlabeled graph.
(iii) Here we have presented a composition schema of a maximal rectangular floor plan corresponding to the underlying unlabeled graph of a given graph; it remains to develop a method for converting it into a labeled maximal rectangular floor plan for the given labeled graph.
(iv) If there does not exist a rectangular floor plan for a given graph, then how to convert the given graph into a graph for which a rectangular floor plan can be constructed.
(v) How to consider the dimensional constraints while satisfying the given topological constraints.
(vi) How to identify and introduce the circulation spaces.
Conclusion
In this paper, we introduced a concept of generic rectangular floor plans and construct them upto nine rooms.
Architecturally and mathematically, the idea is to reduce a large and complex problem, that is, designing of a rectangular floor plan for a given adjacency graph, into a simple problem, that is, look for a maximal graph corresponding to the given adjacency graph. Clearly, the generic rectangular floor plans lead to a class of floor plans that is independent of topological constraints and any rectangular floor plan can be topologically derived from them, as demonstrated in Figure 21.
The next important result of this paper is to construct all possible composition schema of best connected rectangular floor plans (floor plans corresponding to maximal graphs with 3n − 7 edges). Clearly, it provides all possible choices to the architects for the construction of maximal rectangular floor plans.
Last but not least important result is to develop a mathematical theory for examining the isomorphism of given rectangular floor plans. This could a very important tool for avoiding the similar and repeated solutions and to verify the topological equivalence of any two-floor plans with a same number of rooms.
Acknowledgment
The research described in this paper evolved as part of the research project Mathematics-aided Architectural Design Layouts (File Number: ECR/2017/000356) funded by the Science and Engineering Research Board, India.
Dr. Krishnendra Shekhawat is working as an Assistant Professor at Department of Mathematics, BITS Pilani, India. Prior to this joining, he worked as a Post-doctoral fellow in the guidance of Prof. José Pinto Duarte at University of Lisbon. He has completed his PhD in Mathematics from University of Geneva. His areas of interests are geometric graph theory and architectural design.
Dr. José Pinto Duarte is the Stuckeman Chair in Design Innovation and Director of the Stuckeman Center for Design Computing (SCDC). After obtaining his doctoral degree from MIT, he returned to Portugal where he helped launch groundbreaking, technology-oriented architecture degrees and programs in two different universities, as well as a digital prototyping and fabrication lab. Most recently, he served as dean of the Technical University of Lisbon School of Architecture (FA). In addition, he has served as president of eCAADe, a European association devoted to education and research in computer-aided architectural design. He also helped to establish the MIT–Portugal program, and created the Design and Computation research group, which boasts a strong record of interdisciplinary and collaborative research efforts funded by the Portuguese Foundation for Science and Technology (FCT) and private companies.