





Portion size, defined as the amount of food consumed at one eating occasion, has become a major focus in public health nutrition(Reference Almiron-Roig, Navas-Carretero and Emery1). Larger portion sizes of foods such as potatoes, beans, fruits and vegetables are associated with favourable dietary intake patterns, including higher fibre and micronutrient intakes(Reference Lyons, Walton and Flynn2–Reference Flieh, Miguel-Berges and Huybrechts4), whereas experimental studies show that serving larger portion sizes of foods can also raise food and energy intake(Reference Andres, Fisher and Anderson5). Understanding the distribution of portion sizes across food groups is therefore essential both for ensuring adequate nutrient intake and preventing obesity. Additionally, age-specific portion size information is critical for developing portion size estimation tools, such as photographic food atlases(Reference Nelson and Haraldsdóttir6), and for assigning realistic portion sizes in non-weighed dietary assessment methods like estimated dietary records (DR) and FFQ. Several countries have developed portion size databases for this purpose(Reference Choi, Hyun and Lee7,Reference Lyons, Walton and Flynn8) .
The transition from childhood to adolescence is accompanied by biological, behavioural and environmental changes that substantially influence dietary needs and behaviours(Reference Story, Neumark-Sztainer and French9). Accordingly, portion sizes of several food groups often increase with age among children and adolescents(Reference Wrieden, Longbottom and Adamson10–Reference Blundell-Birtill and Hetherington12). While several studies estimating portion sizes of various food items among children and adolescents have been conducted in several Western countries including the UK(Reference Wrieden, Longbottom and Adamson10,Reference Blundell-Birtill and Hetherington12–Reference Albar, Alwan and Evans14) , other European countries(Reference Flieh, Miguel-Berges and Huybrechts4,Reference Schnermann, Nöthlings and Alexy11,Reference Lioret, Volatier and Lafay15) , Australia(Reference Collins, Watson and Collins16,Reference van der Bend, Bucher and Schumacher17) and the USA(Reference Nielsen and Popkin18–Reference Piernas and Popkin20), similar studies in Asia have been limited to Japan(Reference Asakura, Haga and Adachi21) and South Korea(Reference Choi, Lee and Kim22). Considering the relatively low prevalence of childhood obesity in developed Asian countries(Reference Zhang, Liu and Ni23), investigation of portion sizes in these populations may help to identify factors that contribute to this favourable situation (e.g. culinary practices and available package sizes) and thereby offer insights for shaping food environments that support adequate nutrient intake and healthy growth, not only in Asia but also globally. Moreover, previous studies in Asia only estimated portion sizes among children with limited age ranges (i.e. 3–6 years in Japan(Reference Asakura, Haga and Adachi21) and 6–11 years in South Korea(Reference Choi, Lee and Kim22)), and information on portion sizes among Asian adolescents is lacking. Furthermore, although adult men generally have larger portion sizes than adult women(Reference Kelly, Rennie and Wallace24–Reference Zheng, Wu and Louie26), findings on sex differences in portion sizes among children and adolescents are inconsistent(Reference Wrieden, Longbottom and Adamson10,Reference Schnermann, Nöthlings and Alexy11) . Consequently, it remains unclear whether it is necessary to account for sex differences in portion sizes when performing dietary assessment in these age groups.
This study aimed to estimate age- and sex-specific portion sizes across a wide range of food groups among Japanese children and adolescents aged 3–17 years.
Methods
Study sample
This analysis was conducted using data from the MINNADE study (MINistry of Health, Labour and Welfare-sponsored NAtionwide study on Dietary intake Evaluation), which aimed to collect comprehensive, nationwide information on dietary habits and eating behaviours in Japan. Details on the recruitment procedure were published previously(Reference Murakami, Livingstone and Masayasu27). Briefly, Japanese individuals aged 1–79 years were recruited from thirty-two out of forty-seven prefectures. Participants were recruited by 441 research dietitians working in the target prefectures, mainly through the personal connections of each dietitian. The potential participants of the study were community-dwelling individuals who could voluntarily keep eight non-consecutive-day DR. Individuals were excluded from the study if they met any of the following criteria: were a dietitian, were receiving dietary counselling from a physician or dietitian, were undergoing insulin therapy or dialysis treatment, were following special dietary practices for religious or health reasons or were an infant or young child who habitually consumed breast milk. The study was conducted over three separate 1-year data collection rounds: the first from November 2016 to September 2017, the second from October 2017 to September 2018 and the third from November 2019 to August 2020. In the first round, 256 participants (128 males and 128 females) were recruited for each of nine age groups (1–6, 7–13, 14–19, 20–29, 30–39, 40–49, 50–59, 60–69 and 70–79 years), given constraints related to available human and financial resources (Figure 1). Based on the difference in dropout rates between age and sex groups observed during the first round, the number of individuals in each age and sex category was adjusted for the second round. In the third round, additional recruitment was conducted exclusively for children aged 1–6 years to improve the reliability of consumption data for this age group. The study protocol was conducted according to the guidelines laid down in the Declaration of Helsinki, and all procedures involving human subjects were approved by the Ethics Committee of the University of Tokyo Faculty of Medicine (nos. 11397 and 2019124NI). Written informed consent was obtained from parents or guardians of the children.
Flow chart of participant recruitment and selection of the analytical sample.

Figure 1. Long description
The flowchart begins with the invitation of participants for three rounds of surveys, detailing the number of boys and girls scheduled for each age group. It shows the number of participants who took part in each round, with specific age groups and gender distributions. The flowchart then consolidates the total participants aged under 20 years, excluding those aged 1-2 years and 18-19 years. Further exclusions are made based on dietary record criteria, such as records conducted for less than 8 days, records not collected within designated months, records including consecutive recording days within at least one season, and participants identified as living in a different geographic region. The final step shows the number of participants included in the analyses, with specific counts for boys and girls.
In the current study, data from participants aged 3–17 years were used. Among the 1428 participants (721 boys and 707 girls) whose guardians provided informed consent and completed at least one study questionnaire, 1404 (98·3 %) completed the full 8-d DR. A total of seventy-one were excluded for the following reasons: (i) conducting the DR for less than 8 d (2 d completed; n 12, 4 d completed; n 6, and 6 d completed; n 6); (ii) DR were not collected within the designated months (October–December for autumn, January–March for winter, April–June for spring and July–September for summer) (n 10); (iii) DR included consecutive recording days within at least one season (n 35) and (iv) participants were identified to be living in a different geographic region than originally assigned after data collection (n 2). After these exclusions, 1357 participants (692 boys and 665 girls) aged 3–17 years were included in the final analysis. Participants were grouped into three age categories: preschoolers (3–6 years), elementary schoolchildren (7–12 years) and middle/high school students (13–17 years).
Eight-day weighed dietary records
Dietary data were collected using weighed DR conducted over 8 d, consisting of two distinct days in each of the four seasons. The detailed procedure for the DR was published elsewhere(Reference Murakami, Livingstone and Masayasu27,Reference Shinozaki, Murakami and Masayasu28) . Briefly, adolescents aged 13 years and older were presumed capable of completing the record on their own. For children younger than 13 years, guardians were requested to complete the record with the child’s involvement as needed. Record keepers were provided with recording forms and a digital scale (KS-812WT; Tanita) by the research dietitians and received both written and verbal instructions on how to record the foods and beverages they consumed. The primary items recorded included the names of dishes, the names of foods, including ingredients in composite dishes, as well as the weights of foods covering both the prepared amount and any leftovers. The provided digital scale can measure up to 2 kg in 1 g increments. When foods were consumed outside the home (e.g. eating out or school meals), record keepers were instructed to weigh and record them in a manner as similar as possible to foods consumed at home. If weighing was not feasible, they were asked to record the names of food items and provide estimated amounts consumed (e.g. three pieces of chopped carrot), along with additional information, including the name of the restaurant, the dish ordered, and, for school meals, information from newsletters provided by the school. For foods not prepared at home (e.g. purchased ready-made dishes), record keepers were instructed to document the product name and manufacturer and to record the weight indicated on the product label or packaging. If the labelling was not provided in grams (e.g. ‘contents: 1 cup’), they were asked to weigh the food themselves.
The recording forms were submitted to the research dietitians the day after the recording or as soon as possible if immediate submission was not feasible. The research dietitians checked submitted forms for missing information and then coded food items using the Standard Tables of Food Composition in Japan (STFCJ) 2015(29) and supplementary editions published in 2016, 2017, 2018 and 2019. All diaries were double-checked by trained dietitians at the central office for accuracy in coding, recorded weights and descriptions of the consumed items. Finally, daily intake of energy was calculated as the average over an 8-d DR. To estimate consumption of food items, the weight of dried foods was converted to rehydrated weight using conversion factors for food weight changes(29). Rice, grains, beans and dried vegetables/mushrooms/seaweeds were converted to cooked weight, and noodles were converted to boiled weight. Tea leaves and powdered beverages were converted by adding the amount of water used for extraction or dilution to obtain the whole weight.
Identification of food items, food grouping and portion size calculation
Portion size was defined as the quantity consumed per dish per eating occasion. Among 1810 unique food items (i.e. food codes in the STFCJ) recorded in the 8-d DR of 1357 individuals, portion sizes were estimated for 1013 food items that were consumed by at least fifteen individuals (approximately 1 % of the total study population). Food items with fewer consumers were excluded due to concerns about the reliability of portion size estimates. To ensure the selected food items would be useful for future dietary surveys, it was confirmed that they accounted for cumulative 80 % of the daily intake of energy and twenty-five nutrients (i.e. carbohydrate, fibre, protein, total fat, salt equivalent, twelve vitamins and eight minerals). Based on their contribution to energy and nutrient intake, two additional food items were included, resulting in a final list of 1015 food items for portion size estimation.
To avoid bias from participants who frequently consumed extremely large or small portions, a single representative portion size was calculated for each food item per participant. This was calculated by dividing the total consumption of that item by the total frequency of its appearance over the recording period for each participant(Reference Wrieden, Longbottom and Adamson10). If a food item appeared multiple times within the same dish (e.g. eggs used as an ingredient in a meat patty and also served as a fried egg on the side), it was considered to appear once within that dish. The portion size of each food item was then calculated as the median value among consumers within each sex and age category.
Next, the identified food items were classified into eighty food groups based on food groupings used in the STFCJ 2015(29), question items of the pre-existing diet history questionnaire for preschoolers(Reference Asakura, Haga and Sasaki30) and school-age children(Reference Okubo, Tajima and Shinozaki31), culinary use of each food item in Japan and similarity of the portion sizes of food items. Food items that appeared frequently in the DR of many children were classified into independent groups (e.g. regular milk), but those consumed less often were classified into a group including similar food items (e.g. low-fat milk/flavoured milk). Details of the food grouping are presented in online Supplementary Table 1. From these food groups, six groups (grain flours, starches, sugars/other sweeteners, cooking oils, seasonings and cooking sake/wine) and water added during cooking were excluded from the analysis because they were not required to be weighed in the recording procedures in order to reduce the research burden of the participants. Subsequently, portion sizes of seventy-three food groups according to sex and age categories were calculated as weighted averages of the median portion sizes of the food items within the food group, using the number of consumers for each item as weights. Specifically, for a given food group A, the weighted mean portion size was computed as:
 $\overline {P_A} = {{{\Sigma_i}{p_i} \times {f_i}} \over {{\Sigma_i}{f_i}}}$
where
 ${p_i}$
represents the portion size of food item i and
 ${f_i}$
denotes its frequency of appearance. This approach ensures that food items with higher consumption frequency contribute more substantially to the estimated portion size of the food group, thereby reflecting typical consumption patterns within each group.
Assessment of basic characteristics of participants
A questionnaire was administered to determine the basic characteristics of the participants. Participants’ ages (in years) at the start of the study were determined based on their dates of birth. At the beginning of the survey, body height (to the nearest 0·1 cm) and body weight (to the nearest 0·1 kg) were measured by guardians or research dietitians according to standard procedures. Body weight was measured with participants wearing light clothing and no shoes or heavy outerwear. Body height was measured using a standardised measuring tape provided by the research team. For participants whose body weight (n 62 among preschoolers) or height (n 79 among preschoolers and n 2 among elementary schoolchildren) could not be measured, guardian- or self-reported values were used.
Statistical analysis
All statistical analyses were conducted on separate data for boys and girls using SAS statistical software (version 9.4, SAS Institute, Inc.). Participants’ characteristics were presented as mean values and standard deviations for continuous variables and as numbers and percentages for categorical variables.
As described above, portion sizes for each food group were calculated as weighted averages of the median portion sizes of individual food items. Because these values are derived from summary measures rather than individual-level observations, statistical testing to assess differences across age groups is not appropriate. Therefore, differences in portion sizes between age groups were evaluated based on how many times higher the portion sizes were among middle/high school students than among preschoolers. Nevertheless, given the inherent measurement error in dietary assessment, caution is warranted when interpreting very small percentage differences as true differences between age groups. Although there are no widely accepted criteria for interpreting such ratios, differences within approximately 10 % from a reference method are generally considered acceptable (i.e. non-meaningful differences) in validation studies of dietary assessment tools(Reference Lombard, Steyn and Charlton32). Accordingly, we defined ‘similar’ as a ratio between 0·9 and 1·1, placing emphasis on differences exceeding 10 % as potentially meaningful. On this basis, differences in portion sizes were categorised as follows: smaller (< 0·9 times), similar (0·9–1·1 times), slightly larger (1·2–1·5 times), moderately larger (1·6–1·9 times) and markedly larger (≥ 2·0 times). The remaining categories were defined using pragmatic cut-offs (0·3-unit intervals) to facilitate interpretation of the distribution. Similarly, if the portion size differed by 10·0 % or more between boys and girls, there was considered to be a sex difference in the portion size for that food group. These categories were defined a priori for descriptive purposes. Sex differences were evaluated only for food groups with an estimated portion size greater than 10 g because participants were not instructed to record food weights with decimal precision and a difference of less than 1 g could not be detected. In addition, the 5th, 10th, 25th, 50th, 75th, 90th and 95th percentiles of portion sizes of each food item for each sex and age group are provided in online Supplementary Tables 2–7 for reference in future research.
Results
Table 1 summarises the characteristics of the study participants, including 572 preschoolers (287 boys and 285 girls), 406 elementary schoolchildren (204 boys and 202 girls) and 379 middle/high school students (201 boys and 178 girls).
Characteristics of Japanese children and adolescents aged 3–17 years included in the analyses (n 1357)

Table 1. Long description
The table presents data on Japanese children and adolescents aged 3 to 17 years, divided into three age groups: 3-6 years, 7-12 years, and 13-17 years. It includes 572 preschoolers, 406 elementary schoolchildren, and 379 middle/high school students. The table is organized into columns for each age group, with rows for sex, age, height, weight, and energy intake. Each row provides mean values and standard deviations for boys and girls within each age group. For example, the mean height for boys aged 3-6 years is 105.3 centimeters, while for girls in the same age group, it is 105.4 centimeters. The mean weight for boys aged 13-17 years is 57.6 kilograms, and for girls in the same age group, it is 48.8 kilograms. Energy intake is measured in kilocalories per day, with boys aged 13-17 years having a mean intake of 2979 kilocalories and girls in the same age group having a mean intake of 2055 kilocalories.
* For participants whose body weight (n 62 among preschoolers) or height (n 79 among preschoolers and n 2 among elementary schoolchildren) could not be measured, guardian- or self-reported values were used.
† Energy intake was calculated as the average over an 8-d dietary records.
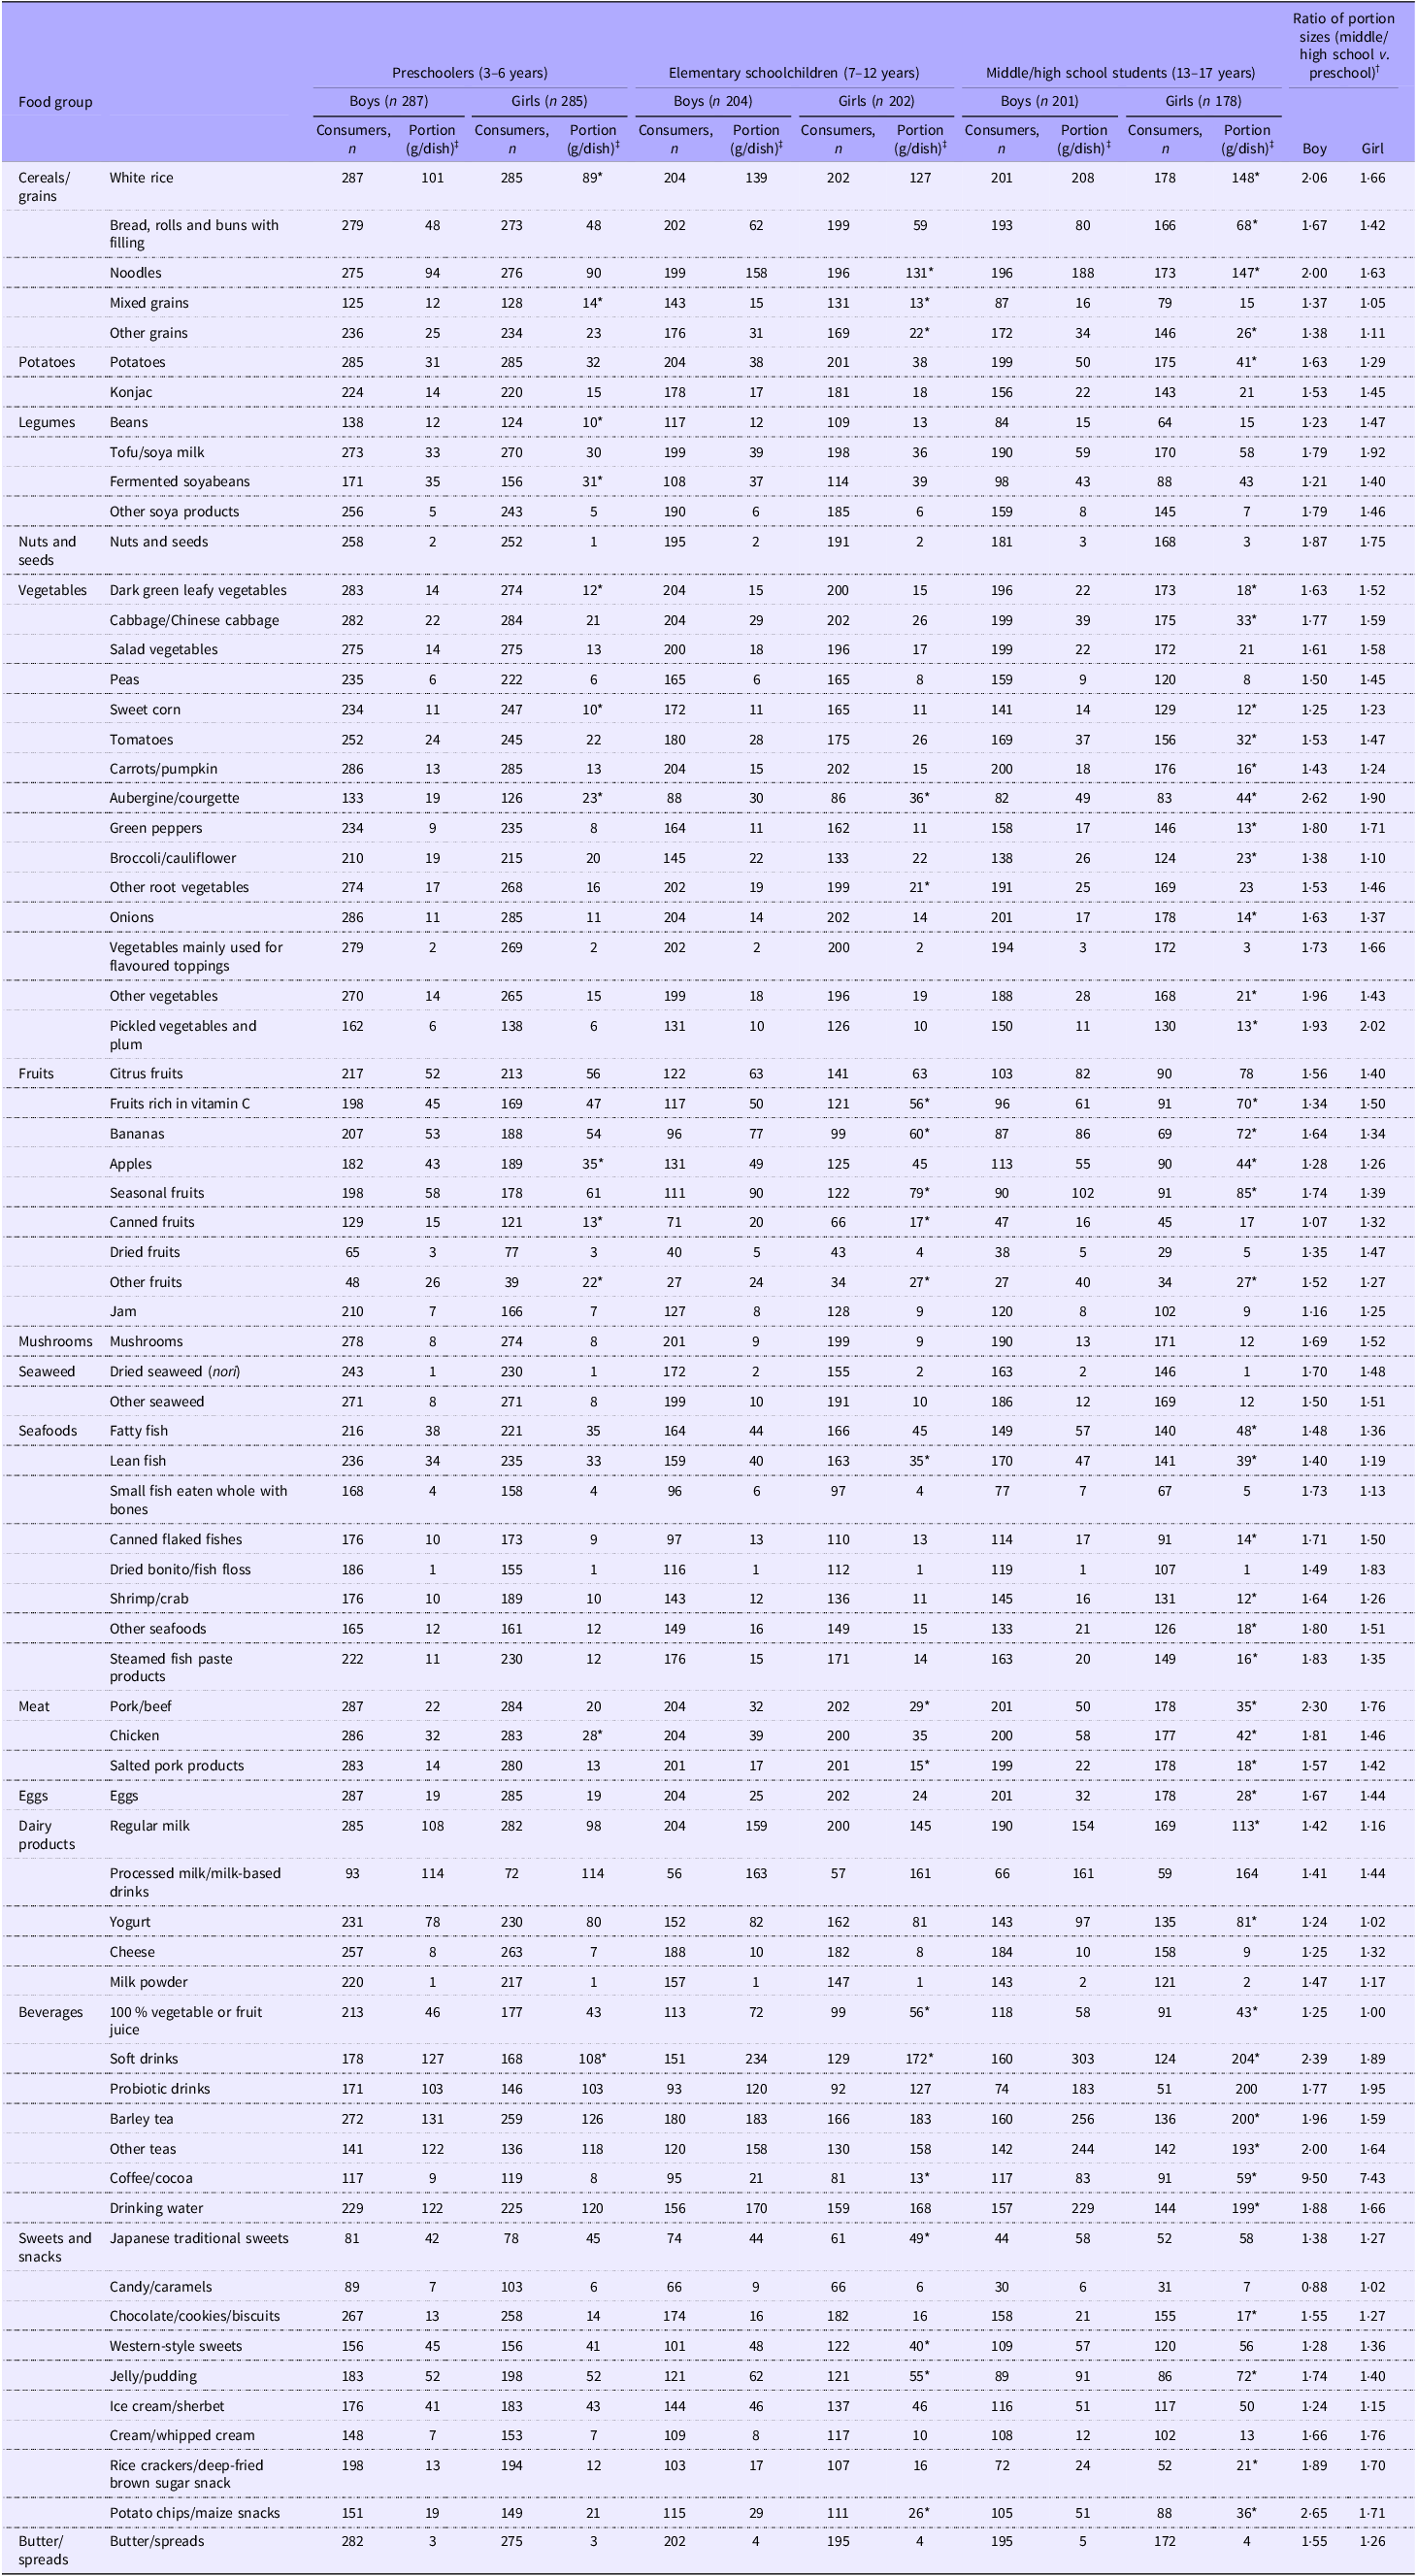
Table 2 shows the portion size for each food group, stratified by sex and age group. Older participants tended to have larger portion sizes than younger participants, but the magnitude of this difference varied between sex and food groups. Specifically, for most of the seventy-three food groups, portion sizes were slightly (1·2–1·5 times) or moderately (1·6–1·9 times) larger among middle/high school students than among preschoolers. Of these, twenty-nine food groups for boys and forty-five food groups for girls were slightly larger, while thirty-two food groups for boys and eighteen food groups for girls were moderately larger. Among middle/high school boys, markedly (≥ 2·0 times) larger portion sizes were observed for ten food groups, namely, white rice (101 v. 208 g), noodles (94 v. 188 g), aubergine/courgette (19 v. 49 g), other vegetables (14 v. 28 g), pork/beef (22 v. 50 g), soft drinks (127 v. 303 g), barley tea (131 v. 256 g), other teas (122 v. 244 g), coffee/cocoa (9 v. 83 g) and potato chips/maize snacks (19 v. 51 g). Among middle/high school girls, markedly larger portion sizes were observed for three food groups, namely pickled vegetables/plums (6 v. 13 g), probiotic drinks (103 v. 200 g) and coffee/cocoa (8 v. 59 g). By contrast, for limited numbers of food groups (one for boys and seven for girls), generally those consumed in small amounts as additions to main ingredients such as canned fruits, mixed grains and other grains, the portion sizes were similar among preschoolers and middle/high school students. Candy/caramels was the only food group for which the portion size was larger among preschoolers than among middle/high school students for boys.
Portion sizes of frequently eaten food groups among Japanese children and adolescents aged 3–17 years (n 1357) stratified by sex and age categories

Table 2. Long description
The table compares portion sizes of seventy-three food groups among Japanese children and adolescents aged 3-17 years, stratified by sex and age categories. The table has 13 rows and 12 columns, including headers for different age groups and food categories. Older participants generally have larger portion sizes than younger participants, with variations between sexes and food groups. For most food groups, portion sizes are slightly or moderately larger among middle/high school students than among preschoolers. Notably, middle/high school boys have markedly larger portion sizes for ten food groups, including white rice, noodles, aubergine/courgette, other vegetables, pork/beef, soft drinks, barley tea, other teas, coffee/cocoa, and potato chips/maize snacks. Middle/high school girls have markedly larger portion sizes for three food groups: pickled vegetables/plums, probiotic drinks, and coffee/cocoa. For a limited number of food groups, portion sizes are similar between preschoolers and middle/high school students. Candy/caramels is the only food group with a larger portion size among preschoolers than among middle/high school students for boys.
* There is a greater than 10 % difference between boys and girls. Sex differences were evaluated only for food groups with an estimated portion size greater than 10 g because participants were not instructed to record food weights with decimal precision and a difference of less than 1 g could not be detected.
† Portion size among middle/high school students divided by portion size among preschoolers.
‡ Calculated as a weighted average of the median portion sizes of the food items within the food group, using the number of consumers for each item as weights.
Among food groups with portion sizes of 10 g or more, boys had portion sizes greater than 10 % larger than girls for ten out of fifty-five items among preschoolers, fifteen out of fifty-eight items among elementary schoolchildren and forty-one out of sixty items among middle/high school students. Conversely, girls had portion sizes greater than 10 % larger than boys for two out of fifty-five items among preschoolers, five out of fifty-eight items among elementary schoolchildren and two out of sixty items among middle/high school students. Notably, soft drinks were the only food group for which boys consistently had larger portion sizes than girls in all age groups.
Discussion
Main findings
Using the data of a nationwide survey, this study provides detailed estimates of portion sizes of various food groups among Japanese children and adolescents aged 3–17 years, stratified by sex and age group. To our knowledge, this is the first study to describe sex- and age-specific portion sizes among Asian children and adolescents. Our findings demonstrate clear age- and sex-related differences in portion sizes, with older children generally consuming large portions and boys having larger portion sizes than girls, particularly among middle/high school students. These results provide a foundation for developing age- and sex-specific dietary assessment tools and education to promote healthy eating in children and adolescents.
Factors possibly associated with the main findings and implications for nutritional education
The differences in portion sizes according to age and sex are partly due to differences in energy demands associated with growth(Reference Story, Neumark-Sztainer and French9,Reference Torun33) . The major energy sources of our participants (data are not shown), such as white rice, noodles and pork/beef, were consumed in markedly larger portion sizes by middle/high school boys than by preschool boys. However, substantial age-related differences in portion size were also observed for foods with a low energy contribution, such as certain vegetables and beverages, suggesting that factors beyond increased energy demands influence portion size. These may include changes in taste preferences(Reference Birch34,Reference Nicklaus35) , as older children become more accepting of the bitterness and sourness of vegetables through repeated exposure, and the development of autonomy in adolescence(Reference Bassett, Chapman and Beagan36), which allows boys in particular to choose larger portions of soft drinks and potato chips/maize snacks independent of parental control. Interestingly, some sweets and snacks showed small age-related differences, possibly due to ‘unit bias’, where people perceive a single unit (e.g. a doughnut or ice cream bar) as the appropriate portion(Reference Geier, Rozin and Doros37). Conversely, it may be necessary to adopt strategies to prevent portion sizes of amorphous foods like potato chips from increasing as children grow, such as purchasing pre-portioned packages(Reference Blake, Fisher and Ganter38). Taken together, age- and sex-specific differences in portion sizes observed in this study appear to reflect the combined effects of physiological needs(Reference Torun33), sensory acceptance(Reference Birch34,Reference Nicklaus35) , behavioural autonomy(Reference Bassett, Chapman and Beagan36) and food form(Reference Geier, Rozin and Doros37), highlighting the importance of considering these factors when designing nutritional education for the dietary intake of children and adolescents.
In Japan, childhood obesity remains relatively low compared with other high-income countries(Reference Zhang, Liu and Ni23) but has increased over the past decade(Reference Fujiwara, Harada and Hagiya39). Underweight is also prevalent among adolescent girls(40) and is recognised as a public health concern across the life course(Reference Kobayashi, Itoi and Shrestha41,Reference Simchoni, Landau and Derazne42) . Considering the common misperceptions about appropriate portion sizes(Reference Almiron-Roig, Navas-Carretero and Emery1), it may be worthwhile to develop portion size guidance (i.e. recommended portion sizes) to support adequate energy intake in Japanese children and adolescents(Reference Porter, Kipping and Summerbell43–45). Specifically, variation in portion sizes of staple foods may have a substantial impact on energy intake, highlighting the potential importance of portion size guidance for these foods. In this study, sex differences in rice portion sizes observed among preschoolers disappeared among elementary schoolchildren but re-emerged among middle/high school students. This pattern may suggest that portion sizes of rice are similar between boys and girls among elementary schoolchildren, whose meals are mainly prepared by guardians and school dietitians, whereas sex differences may emerge in adolescence as girls may prefer small portions of staple foods due to desire for thinness(Reference Mori, Asakura and Sasaki46). To inform development of portion size guidance, further research is needed to clarify how variation in portion size relates to obesity(Reference Andres, Fisher and Anderson5) and diet quality(Reference Flieh, Miguel-Berges and Huybrechts4) among children and adolescents. Future studies should also consider variation in portion size by eating occasion, time of day and eating context(Reference Blundell-Birtill and Hetherington12).
Comparisons with previous studies
In contrast to multinational studies employing standardised methodologies(Reference Kirwan, Walsh and Brennan47,Reference Ruby, Alvarenga and Rozin48) , it is difficult to directly compare our findings with previous research because of differences in portion size calculation procedures and food grouping methodologies. Nevertheless, for food groups considered comparable, we observed both similarities and differences in portion sizes between countries, likely reflecting variation in culinary practices and commercially available package sizes. Specifically, portion sizes of rice(Reference Flieh, Miguel-Berges and Huybrechts4,Reference Wrieden, Longbottom and Adamson10,Reference Schnermann, Nöthlings and Alexy11,Reference van der Bend, Bucher and Schumacher17) and noodles(Reference Flieh, Miguel-Berges and Huybrechts4,Reference Wrieden, Longbottom and Adamson10,Reference Schnermann, Nöthlings and Alexy11) among our participants were generally comparable to those reported in previous studies of children and adolescents, whereas portion sizes of potatoes(Reference Flieh, Miguel-Berges and Huybrechts4,Reference Wrieden, Longbottom and Adamson10,Reference Schnermann, Nöthlings and Alexy11,Reference van der Bend, Bucher and Schumacher17) , fish(Reference Flieh, Miguel-Berges and Huybrechts4,Reference Wrieden, Longbottom and Adamson10,Reference Schnermann, Nöthlings and Alexy11,Reference Lioret, Volatier and Lafay15) , pork/beef(Reference Flieh, Miguel-Berges and Huybrechts4,Reference Schnermann, Nöthlings and Alexy11,Reference Lioret, Volatier and Lafay15,Reference van der Bend, Bucher and Schumacher17) , chicken(Reference Flieh, Miguel-Berges and Huybrechts4,Reference Wrieden, Longbottom and Adamson10,Reference Schnermann, Nöthlings and Alexy11,Reference Lioret, Volatier and Lafay15,Reference van der Bend, Bucher and Schumacher17) , eggs(Reference Flieh, Miguel-Berges and Huybrechts4,Reference Wrieden, Longbottom and Adamson10,Reference Lioret, Volatier and Lafay15,Reference van der Bend, Bucher and Schumacher17) , yogurt(Reference Wrieden, Longbottom and Adamson10,Reference Schnermann, Nöthlings and Alexy11,Reference van der Bend, Bucher and Schumacher17) , Western-style sweets (e.g. cakes, pies and doughnuts)(Reference Flieh, Miguel-Berges and Huybrechts4,Reference Schnermann, Nöthlings and Alexy11,Reference Lioret, Volatier and Lafay15,Reference van der Bend, Bucher and Schumacher17) and ice cream(Reference Wrieden, Longbottom and Adamson10,Reference Schnermann, Nöthlings and Alexy11,Reference van der Bend, Bucher and Schumacher17) tended to be smaller than those reported elsewhere. Notably, portion sizes reported in a previous Asian study(Reference Choi, Lee and Kim22) (i.e. South Korea) for children aged 6–11 years did not entirely correspond to those observed among our elementary schoolchildren (7–12 years). For example, although portion sizes of potatoes and fish were similar in Japan and South Korea(Reference Choi, Lee and Kim22), portion sizes of pork/beef, chicken, eggs, yogurt and ice cream in South Korea were more similar to those reported in Australia(Reference van der Bend, Bucher and Schumacher17) and European countries(Reference Flieh, Miguel-Berges and Huybrechts4,Reference Wrieden, Longbottom and Adamson10,Reference Schnermann, Nöthlings and Alexy11,Reference Lioret, Volatier and Lafay15) than to those reported in Japan, highlighting differences in dietary habits and food availability even within the same Asian region.
Implications for future dietary surveys
Our analyses also provided foundational data for future dietary surveys among Japanese children and adolescents, particularly those focusing on absolute nutrient intakes. For example, in surveys using dietary recalls or estimated DR, participants are required to estimate the portion sizes they consumed using various tools such as a food photographic atlas(Reference Foster, Adamson and Anderson49). During the development of such tools, information on portion size distribution can provide guidance on which portion size variations should be included(Reference Nelson and Haraldsdóttir6). Specifically, around three to eight portion sizes are typically presented included in a food atlas(Reference Nelson and Haraldsdóttir6), and these are determined based on the distribution of observed portion sizes, often after excluding extreme values (e.g. the 5th–95th percentiles), to represent a realistic range of consumption(Reference Foster, Hawkins and Barton50,Reference Shinozaki, Murakami and Asakura51) . In Japan, although a digital photographic food atlas based on portion size distributions in adults has been developed(Reference Shinozaki, Murakami and Asakura51), no such atlas is currently available for children and adolescents. Given the importance of age-appropriate food photographs for accurately estimating portion sizes in children(Reference Foster, Matthews and Nelson52), the development of a photographic food atlas for Japanese children and adolescents would be valuable. As another example, in surveys where caregivers record what their child consumes, it may be difficult to weigh foods consumed outside the caregiver’s supervision(Reference Livingstone, Robson and Wallace53). In this case, information on representative portion sizes for that age is useful to impute missing portion sizes in the DR. Notably, sex-specific portion sizes need to be applied for middle/high school students because there were sex differences in portion sizes of various food groups in these individuals.
Study strengths and limitations
The strengths of this study include its wide geographical representation across Japan and the application of detailed 8-d DR collected across all four seasons. Nonetheless, the study has several limitations. First, the participating children and adolescents were not selected through random sampling but were primarily recruited via the personal networks of the research dietitians. Given the substantial burden associated with completing 8-d DR over 1 year, it is plausible that the participants came from households with a relatively high level of health consciousness. However, mean height and weight of each age category were comparable to those reported in nationally representative survey data in Japan(40). Second, although DR do not rely on memory and are therefore considered suitable for estimating portion sizes, they are not entirely free from reporting errors, as with other dietary assessment methods. Notably, mean total energy intakes of preschool boys and girls were approximately 200 kcal/d higher than the estimated energy requirement for individuals of the same age with a normal level of physical activity, whereas energy intake among middle/high school female students was approximately 300 kcal/d lower than the corresponding estimated energy requirement(54). These discrepancies may reflect potential over- or under-reporting and should be considered when interpreting the findings. Such reporting errors may have influenced the estimation of portion sizes, particularly in subgroup comparisons. Third, when weighing was not possible, participants were allowed to record what they ate based on estimated portion sizes rather than actual measurements. In contrast to prior research(Reference Schnermann, Nöthlings and Alexy11), portion sizes recorded without weighing could not be distinguished in the present dataset, and it is unclear to what extent estimated portion may have biased the results of this study. However, the location of consumption could be identified in our dataset. Although participants were instructed to weigh foods as much as possible regardless of eating location, estimated portion sizes were likely recorded more frequently for foods consumed outside the home. In our participants, 60·9 % of foods were consumed at home, 24·5 % as school meals, 4·4 % when eating out and 10·2 % in other settings (e.g. at after-school activities). Notably, among middle/high school students, the proportion of school meals (11·5 %) was lower, whereas the proportions of eating at home (64·9 %) and other settings (19·0 %) were higher than those in the overall population. Therefore, when comparing portion sizes across age groups, differences in the proportion of weighed v. estimated values may have influenced the interpretation of comparison. Fourth, the classification of food groups used in this study may be partly based on the subjective judgement of researchers. Although the food grouping method affects portion size estimation, there is no internationally approved food grouping theory. However, it is possible to calculate the weighted averages of portion sizes of alternative food groups using the information provided in the supplemental tables. Fifth, for certain items such as some fruits and sweets/snacks, the number of consumers might be too small to reliably estimate a portion size. Therefore, the findings should be interpreted with caution, considering that the accuracy of portion size estimation likely differs between food groups. Sixth, the cut-off values used to interpret percent differences in portion sizes by age group and sex were pragmatically defined for the purposes of this study and do not represent established thresholds for meaningful differences. Moreover, the implications of such differences are likely to vary across food groups. For example, a twofold difference in portion size for a staple food, a major source of energy, may have substantially different implications compared with a similar difference for non-sweetened tea. Seventh, this study does not account for possible differences in portion sizes depending on the time of day each food was consumed. It has been suggested that portion sizes tended to be larger for foods consumed later in the day(Reference Blundell-Birtill and Hetherington12). This limitation may have influenced the estimation of portion sizes, particularly if the distribution of eating occasions differed across age or sex groups. Future research clarifying this issue is expected to provide insights into which eating occasion (e.g. snacking after dinner) should be targeted for portion size control. Finally, although the portion sizes of food groups were intended to be calculated based on the weight at the time of consumption, it is possible that foods in different forms were grouped into a single food group. For example, we aimed to estimate the portion size of cocoa/coffee as a beverage by including the weight of the water used for dilution. However, we could not account for cocoa/coffee used as an ingredient in confectionery. This likely explains why the portion size of cocoa/coffee among preschoolers was less than 10 g.
Conclusion
This study provided estimates of portion sizes of various food groups among children and adolescents aged 3–17 years. Our findings demonstrated that while portion sizes differ according to sex and age, the magnitude of these differences varies depending on the food group. These results offer a scientific foundation for developing databases to be used in future dietary assessments of children and adolescents as well as for designing education strategies targeting portion size to improve dietary intake in this population.
Supplementary material
For supplementary material/s referred to in this article, please visit https://doi.org/10.1017/S0007114526107454
Acknowledgements
The authors thank all the children and their parents/guardians who took part in this study. The authors also thank the following research dietitians and staff who collected and processed the data: Tamotsu Noshiro*, Ikuko Kato, Yoshie Awa, Erika Takayama, Mari Sakurai, Mihoko Yanase, Masae Kato, Mihoko Furukawa, Yuna Nodera, Kazue Fukushi, Miwako Onodera, Yoshie Sato, Megumi Yoshida, Masako Shimooka, Kaori Takahashi and Fuki Kudo (Hokkaido); Yumiko Sato, Yutaka Shojiguchi, Kazunori Kimoto, Saori Kikuchi, Megumi Maeta, Mayumi Sugawara, Shinogu Muraoka, Kanako Takahashi, Noriko Suzuki, Yoko Fujihira and Megumi Onodera (Iwate); Yukiko Takahashi, Kaoru Honda, Chie Yamada, Miki Sato, Katsue Watanabe, Akemi Konno and Reina Kato (Miyagi); Akiko Sato, Hiromi Kawaguchi, Miyuki Awano, Chigusa Miyake, Ayako Konno, Ayumi Goto, Shizuko Taira, Yuka Takeda, Akiko Matsunaga, Nao Konta, Yumi Miura, Satoshi Numazawa, Chiemi Ito, Sachie Yokosawa, Manam Endo and Hiromi Seki (Yamagata); Yoko Tsukada, Tomoko Oga, Satoko Fujita, Hitomi Sonobe, Hanayo Kadoi, Toshie Nakayama, Hiromi Takasawa, Yoko Ichikawa, Yuko Takano, Junko Hanzawa, Kiyomi Seki, Emi Kamoshita, Yuri Kawakami and Hisako Watahiki (Ibaraki); Reiko Ishii, Yoshiyuki Tatsuki, Daisuke Mogi, Akiko Nakamura, Suguru Yagi, Yumiko Furushima, Noriko Ogiwara, Kiyomi Kimura, Kinue Takahashi, Kikue Tomaru, Kana Tsukagoshi, Fumiko Fujiu, Kyoko Maehara and Yuki Kobayashi (Gunma); Kaoru Goto, Yuka Inaba, Michiko Koresawa, Tomoko Tsuchida, Naoko Sakakibara, Fumika Shimoyama, Akiko Kato, Miki Hori, Rika Kurosaki, Hiroko Yamada, Hitomi Sasaki, Keiko Arai, Yuka Arai, Manami Honda, Akiko Utsumi, Asako Hamada, Keiko Sekine, Akiko Yamada, Mami Ono, Satoko Maruyama, Emiko Kajiwara, Taeko Takahashi, Hitomi Kawata, Satoru Arai, Ryoko Hirose, Madoka Ono and Mihoko Ainai (Saitama); Masako Shinohara, Noriko Nakamura, Mitsuko Ito, Yuka Takahara, Minako Fukuda, Masae Ito, Yayoi Sueyoshi, Hiroko Shigeno, Tomohiro Murakami, Masako Kametani, Kyoko Wada, Mika Ueda, Jun Kouno, Hiroyo Yamaguchi, Mariko Oya, Junko Suegane, Yumiko Asai, Miyuki Ono, Mitsuko Uekusa, Chieko Sunada, Yumi Tanada, Mariko Shibata, Emi Tsukii, Kae Terayama, Hiroko Iwasaki, Keiko Yokoyama, Haruna Kayano, Kazuyo Shimota, Keiko Ifuku and Keiko Honma (Chiba); Yoshiko Saito, Megumi Suzuki, Eiko Kobayashi, Yoshiko Katayama, Sonoko Yamaguchi, Tomoko Kita, Naoko Yuasa, Hitomi Okahashi, Shinobu Matsui, Yurina Arai, Sanae Togo, Eiko Horiguchi, Juri Sato, Takehiro Komatsu, Yumi Matsuura, Junko Higashi, Ayaka Nakashita, Takako Sakanashi, Yoko Kono, Naomi Nakazawa and Yukiko Shibata (Tokyo); Machiko Tanaka, Ikue Sahara, Yasue Watanabe, Kanako Yoshijima, Yuko Harashima, Yoshiko Iba, Haruko Irisawa, Junko Inose, Reiko Okui, Taeko Endo, Mayuko Sakitsu, Ikuko Endo, Haruko Terada, Chiaki Nishikawa, Ai Yasudomi, Suzuyo Takeda, Kaori Shimizu, Mari Ikeda, Yuko Okamoto, Keiko Yamada, Fumiko Nemoto, Shinobu Katayama, Yuki Takakuwa, Michiru Goukon, Megumi Koike, Masae Kamiya, Takako Okada, Yayoi Hayashi, Etsuko Abe, Akiko Hamamoto, Kumiko Ono, Kazumi Takagi, Sachiko Ito, Yuki Kumagai, Noriko Ozaki, Haruka Sato, Hisae Takahashi, Masuko Komazaki, Akiko Nako, Tatehiro Inamoto and Kimiyo Matsumoto (Kanagawa); Masako Koike, Reiko Kunimatsu, Keiko Kuribayashi, Hiroko Adachi, Yuri Shikama, Yurika Seida, Ryouko Ito, Satoko Kimura, Yoko Sato, Michiyo Nakamura, Hisako Kaneko, Hatsuyo Ikarashi, Mamiko Karo, Keiko Hirayama, Ikumi Torigoe and Fumiko Gumizawa (Niigata); Natsuko Mizuguchi, Aki Sakai, Hisako Noguchi, Chie Tanabe, Yokako Osaki, Ikiko Kawasaki, Nobuko Yoshii, Yumiko Nishihara, Izumi Takahara, Mika Minato, Yuuki Okamoto, Yukiyo Sakai, Shitomi Nakamura, Kanako Kobayashi, Emi Hano and Megumi Emori (Toyama); Kazumi Horiguchi, Michiyo Kubota, Naoya Mochizuki, Miyuki Yokokoji, Kazuko Koizumi, Megumi Ariizumi, Hozumi Kakishima, Mayumi Kawakubo, Chisato Nakajima, Yasuko Ishii, Yukie Shiogami, Yukiko Uchida, Ikuko Kayanuma and Kikuyo Moriya (Yamanashi); Noriko Sumi, Noriko Takahashi, Kuniko Watanabe, Yoko Ido, Akiko Adachi and Manami Tauchi (Gifu); Naoya Terada, Chisato Suwa, Toshihiro Tamori, Natsuko Osakabe, Toshiyuki Serizawa, Akiko Seki, Izumi Mochizuki, Nagako Matsui, Eiko Watanabe, Kyoko Yui, Yuki Murakami, Tomomi Iwasaki and Tomoko Sugiyama (Shizuoka); Keiko Kawasumi, Masako Tanaka, Kayoko Ishida, Megumi Yamatani, Shihoko Yama, Miyuki Otono, Mie Kojima, Tamaki Kobayashi, Hiroe Komaki, Miki Yanagida, Yumiko Fukaya, Syoko Sawaki, Tomomi Ota, Yasuko Kito, Mei Tobinaga, Takashi Yasue, Kuniko Hatamoto, Toru Ono, Takako Minami, Akemi Kumazawa, Masami Kato, Miyuki Kondo, Kyoko Shimizu, Sayoko Tanaka and Shizue Masuda (Aichi); Hiromi Ashida, Shintaro Hinaga, Yoshiko Shoji, Ryusuke Yamaguchi, Hiroka Morita and Atsuko Nakabayashi (Mie); Erika Shioi, Sawa Mizukawa, Miwako Ohashi, Eriko Taniguchi, Yuri Mitsushima, Mariko Teraya, Kazuko Ogawa, Yoko Minami, Megumi Ito, Yasuhiro Morimoto, Shizuka Kurokawa and Manami Hayashi (Kyoto); Yumiko Noutomi, Yoshiko Iwamoto, Junko Ikukawa, Shinobu Fujiwara, Tami Irei, Keiko Takata, Yasuka Tabuchi, Naoko Murayama, Kaori Maruyama, Hiromi Tashiro, Miki Tanaka, Miho Nomura, Shizuyo Umezawa, Minori Shintani, IkuyoMaruishi, Atsuko Toyokawa, Rumi Kitada, Yuka Takashima, Eriko Nakatani, Wakana Tsujimoto, Yumi Koori, Emi Iwamoto and Masumi Yamada (Osaka); Atsuko Konishi, Yoshiko Nakamori, Yumi Ikawa, Junko Shimizu, Mie Atsumi, Atsuko Fukuzaki, Akemi Yamamoto, Yasuko Inoue, Miyuki Nakahara, Reiko Fujii, Yumi Tanaka, Rika Miyachi, Mari Matsuyama, Ayana Honda, Tomoka Nakata, Miho Inagaki, Mikiyo Ueno, Mami Kamei, Kiyomi Kawachi, Yasuyo Hasegawa and Masayo Fukumoto (Hyogo); Sachiyo Otani, Tomomi Sugimoto, Kanako Mizoguchi, Tomomi Shimada, Shima Takahashi, Yoshiko Okuno, Takahide Kijima, Masayo Ueda, Yuko Sakamoto, Hitoshi Matsuda, Yumie Shimizu, Rie Hataguchi, Junko Nohara, Yuko Sakakitani, Hatsuki Matsumoto, Sakiko Tanaka, Moe Yoshikawa and Rena Yuki (Nara); Yurika Adachi, Akiko Notsu, Keiko Uzuki, Atsuko Umeda, Hiroko Nishio, Chikako Takeshita and Sayuri Omoso (Tottori); Hiromi Watanabe, Nami Sakane, Nao Hino, Sakiko Sonoyama, Yukiko Katagiri, Kaori Nagami, Tsunemi Moriyama and Yoshiko Kirihara (Shimane); Sachiko Terao, Akemi Inoue, Mieko Imanaka, Noriyuki Kubota, Sachiko Sugii, Yuri Fujiwara and Tomoko Miyake (Okayama); Youko Fujii, Hiroko Tamura, Kimie Tanaka, Izumi Hase, Etsuko Kimura, Akiko Hamada, Tomoko Kawai, Masako Ogusu and Emi Isomichi (Hiroshima); Kyoko Ueda, Atsuko Nakanishi, Tomoko Ishida, Nobuko Morishita, Hitomi Nakata and Takako Yagi (Yamaguchi); Yuriko Doihara, Toyoko Kitadai, Hideyo Yamada, Mariko Nakamura, Nanako Honda, Eri Ikeuchi, Kayo Hashimoto, Azusa Onishi and Manami Iwase (Tokushima); Machiko Ueda, Ayano Kamei, Reiko Motoie, Yoko Moriki, Nobumi Yoshida and Kiyoko Kubo (Ehime); Kyoko Kaku, Emi Ibushi, Miho Otsuka, Kiyoko Katayama, Hisami Kumagai, Chizuru Shibata, Miki Hamachi, Yuko Hayashida, Akiko Matsuzaki, Mika Yoshioka, Yoshie Yanase, Yoshiko Yahagi and Tomomi Ota (Fukuoka); Junko Kiyota, Hiromi Ide, Takako Fukushima, Shiho Tominaga, Satsuki Miyama, Yoko Okamura, Kayoko Kurahara, Tomomi Nagamori, Chika Shino, Akiko Taira, Yuki Kuwajima and Miyuki Matsushita (Kumamoto); Miki Hamada, Kiyomi Aso, Toshie Eto, Mitsue Kodama, Miyoko Sato, Mutsuko Shuto, Yuko Soga, Taeko Nagami, Machiko Hirayama, Mika Moribe, Junko Yamamoto, Hideko Yoshioka, Yuko Kawano, Rika Matsuoka and Satomi Sato (Oita); and Hisami Yamauchi, Satomi Moromi, Satoko Tomari, Kaoru Miyara, Chikako Murahama, Yukiko Furugen, Kana Awano, Hiromi Arakaki, Suzumi Uema, Yasuko Tomori, Nariko Mori, Ayako Iho, Michiru Hokama, Yasue Higa and Chigusa Chibana (Okinawa). The authors would also like to thank the following research team staff at the survey centre (The University of Tokyo): Tomoko Doi, Hitomi Fujihashi, Akiko Hara, Nana Kimoto, Nanako Koe, Eri Kudo, Fumie Maeda, Keika Mine, Akemi Nakahara, Hiroko Onodera, Hiroko Sato, Chifumi Shimomura and Fusako Takahashi. *Deceased.
This research was funded by the Ministry of Health, Labour and Welfare, Japan (grant number 23KA1009). The Ministry of Health, Labour and Welfare had no role in the design, analysis or writing of this article.
R. T. contributed to conceptualisation, data collection, formal analysis and data interpretation and wrote the original draft of the manuscript; H. O. contributed to the conceptualisation, data interpretation and review and editing of the manuscript; N. S. contributed to the conceptualisation, data collection and review and editing of the manuscript; S. M. and S. S. contributed to the methodology and supervision; K. M. contributed to the conceptualisation, methodology, data collection, project administration, data curation, data interpretation and review and editing of the manuscript. All authors reviewed and approved the final version submitted for publication.
H. O. and R. T. belong to the Department of Nutritional Epidemiology and Behavioural Nutrition, Graduate School of Medicine, The University of Tokyo, which is a social cooperation programme with Ajinomoto Co., Inc. The authors declare that Ajinomoto Co., Inc. had no role in the design of the study; in the collection, analyses or interpretation of data; in the writing of the manuscript or in the decision to publish the results. The remaining authors declare that they have no conflicts of interest.




 Open access

