Probiotics are defined as viable microorganisms which, upon ingestion in sufficient amounts, exert health benefits to the host beyond inherent basic nutrition (Guarner & Schaafsma, Reference Guarner and Schaafsma1998). They have been used for the treatment of various types of diarrhoea (Szymanski et al. Reference Szymanski, Pejcz, Jawien, Chmielarczyk, Strus and Heczko2006), urogenital infections (Reid et al. Reference Reid, Charbonneau, Erb, Kochanowski, Beuerman, Poehner and Bruce2003), and gastrointestinal diseases such as Crohn's disease (Bousvaros et al. Reference Bousvaros, Guandalini, Baldassano, Botelho, Evans, Ferry, Goldin, Hartigan, Kugathasan, Levy, Murray, Oliva-Hemker, Rosh, Tolia, Zholudev, Vanderhoof and Hibberd2005) and pouchitis (Kuehbacher et al. Reference Kuehbacher, Ott, Helwig, Mimura, Rizzello, Kleessen, Gionchetti, Blaut, Campieri, Folsch, Kamm and Schreiber2006), although there is still no consensus about their effectiveness (Lin, Reference Lin2003). Probiotic bacteria, often belonging to the Lactobacillus and Bifidobacterium genera (Weinbreck et al. Reference Weinbreck, Bodnár and Marco2010).
Lactic acid bacteria are commercialised mainly as food supplements with dairy products being the most often used vehicle (Heller, Reference Heller2001; Lourens-Hattingh & Viljoen, Reference Lourens-Hattingh and Viljoen2001). However, recent studies have suggested fruit juices as an alternative vehicle for the incorporation of probiotics (Mousavi et al. Reference Mousavi, Mousavi, Razavi, Emam-Djomeh and Kiani2011; Pereira et al. Reference Pereira, Maciel and Rodrigues2011; Fonteles et al. Reference Fonteles, Costa, de Jesus and Rodrigues2012; Costa et al. Reference Costa, Fonteles, de Jesus and Rodrigues2013). Fruit juices are rich in nutrients and do not contain starter cultures that compete for nutrients with probiotics. Furthermore, fruit juices contain high amounts of sugars, which could encourage probiotic growth (Ding & Shah, Reference Ding and Shah2008).
The optimal growth of probiotic bacteria is affected by fermentation conditions such as pH, temperature, medium formulation and the others. Study of the individual and interactive effects of these factors will help in efforts to optimise biomass production of the probiotic microorganism (Du Toit et al. Reference Du Toit, Engelbrecht, Lerm and Krieger-Weber2011). According to Oliveira & Damin (Reference Oliveira and Damin2003), to evaluate the growth of lactic acid bacteria, it is necessary to know the substrates applied for the microbial growth, as well as, the optimal temperature and pH values because these factors are the most important for the microbial development.
Response surface methodology (RSM) is a useful model for studying the effect of several factors influencing the responses by varying them simultaneously and carrying out a limited number of experiments. In addition, response surface methodology is an efficient strategic experimental tool by which the optimal conditions of a multivariable system may be determined (Khayati & Kiyani, Reference Khayati and Kiyani2012; Khayati, Reference Khayati2013).
Lactobacilli are also extensively used as probiotics, but no information is available on the growth of the species Bifidobacterium in apple juice. The objective of this study was to determine the suitability of apple juice as a raw material for production of probiotic by Bifidobacterium spp.. Thus, the use of apple juice as substrate to produce a probiotic was studied herein. So in this paper, the growth of probiotic Bifidobacterium animalis subsp. lactis in apple juice (as a basement medium) with a function of four affecting parameters including lactose (g/l), inulin (mg/l) and yeast extract concentration (g/l) and initial pH was studied by RSM.
Then these bacterial strains can be successfully manufactured and incorporated into highly acceptable dairy food products where they can retain their viability and functionality. (Alander & Mattila-Sandholm, Reference Alander and Mattila-Sandholm2000).
Materials and methods
Microorganisms and media
Bifidobacterium animalis subsp. lactis PTCC 1736 was prepared from the Iranian Research Organization for Science and Technology (IROST). All chemicals used were of analytical grade. The strain was maintained in MRS agar medium containing 1% lithium chloride, 0·3% sodium propionate and 0·5% L-cysteine at 4 °C. Subcultures (1% inoculum, incubated for 10 h at 37 °C in anaerobic jars) were prepared immediately before the culture was used experimentally.
Fermentation conditions
In the design orthogonal array, each row consists of a number of conditions depending on the levels assigned to each factor. Submerged fermentation experiments were carried out in cotton plugged 100 ml Erlenmeyer flasks containing 30 ml apple juice in different conditions. pH adjusted by adding 0·02 N HCl prior to sterilisation (15 min, 121 °C). Lactose and yeast extract were sterilised separately. Cultures were inoculated with mentioned above pre-cultures (approximate concentration of 103 CFU/ml of the probiotic strain), and incubated for 36 h at 37 °C in an anaerobic atmosphere (85% N2/10% H2/5% CO2).
Microbiological analysis
The number of viable cells was determined as colony forming units (CFU). One millilitre of sample was diluted with 9 ml 0·1% sterile peptonated water. Serial decimal dilutions of each sample were plated in triplicate onto MRS-LP agar; afterwards, bacteria were counted applying the pour plate technique (Kodaka et al. Reference Kodaka, Mizuochi, Teramura and Nirazuka2005). Plates were incubated at 37 °C for 72 h under anaerobic conditions (Gas-Pak plus system). CFU were enumerated in plates containing 30–300 colonies. The selectivity of culture media was confirmed by microscopic examination of cells in the colonies. Results were expressed as log10 CFU/ml.
Experimental design and statistical analysis
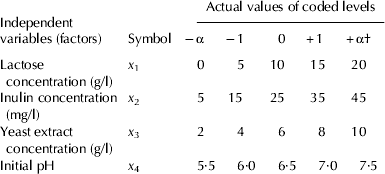
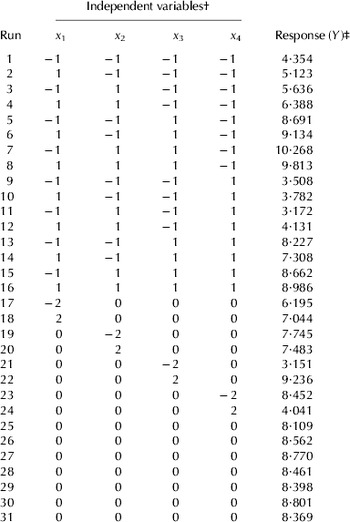
In this experiment, the response was the growth of Bifido. animalis subsp. lactis PTCC 1736, represented by log10 (number of viable cells/ml; CFU/ml). The effect of four independent variables: lactose (x 1), inulin (x 2) and yeast extraction concentration (x 3) also initial pH (x 4) on the response variable (Y, the log10 (number of viable cells/ml)) was evaluated using central composite design (CCD) (Table 1). The five coded levels of each variable were incorporated into the design and were analysed in 31 experimental trails (Table 2). The central point of the design was repeated seven times to calculate the reproducibility of the method (Montgomery, 2001). For each experimental trail of the independent variables in the experimental design, the dependent parameter (the log10 (number of viable cells/ml)) was determined. The effect of these independent variables x 1, x 2, x 3 and x 4 on the response Y was investigated using the second-order polynomial regression equation. This equation, derived using RSM for the evaluation of the response variable, is as follows:
 $$Y = {\rm \beta} _0 + \sum\limits_{i = 1}^k {{\rm \beta} _i x_i} + \sum\limits_{i = 1}^k {{\rm \beta} _{ii} x^2} + \sum\limits_{i \ne j}^k {{\rm \beta} _{ij} x_i x_j} $$
where β0 is defined as the constant, β i the linear coefficient, β ii the quadratic coefficient and β ij the interaction coefficient. x i and x j are the independent variables while k equals to the number of the tested factors (k=4). The analysis of variance (ANOVA) tables were generated and the effect and regression coefficients of individual linear, quadratic and interaction terms were determined. The significances of all terms in the polynomial were judged statistically by computing the P<0·05. The regression coefficients were then used to make statistical calculations to generate response surface and contour maps from the regression models. The analysis of data and the optimising process were generated using Minitab statistical software version 15.
Independent variables and their coded and actual levels

† α=2·0 (star point for orthogonal CCD for the case of 4 independent variables)
Central composite experimental design and responses

† x 1: lactose concentration (g/l); x 2: inulin concentration (mg/l); x 3: yeast extract concentration (g/l); x 4: initial pH
‡ Y: log10 (CFU/ml)
Results and discussion
Effects of independent variables on responses
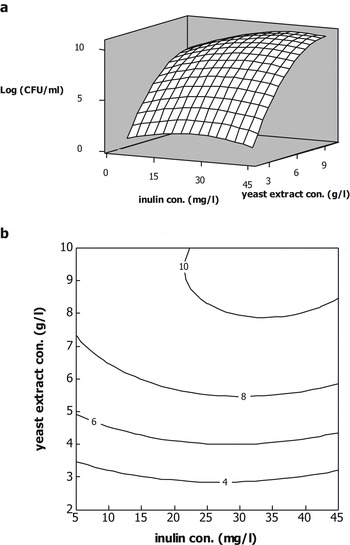
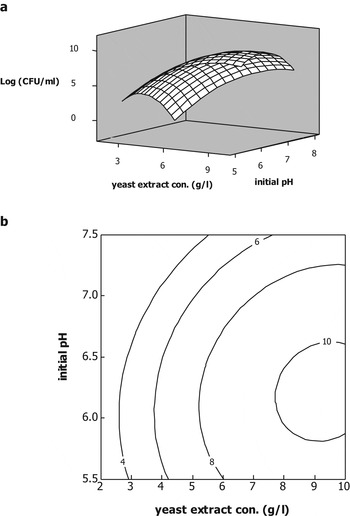
Interest in the incorporation of Bifidobacteria into fermented products has developed considerably over recent years. In many studies reporting human health benefits associated with the consumption of these bacteria so they have received attention as probiotic (Doleyres & Lacroix, Reference Doleyres and Lacroix2005). Response surface was used to illustrate the effect of lactose, inulin and yeast extract concentration and initial pH on the growth of Bifido. animalis subsp. lactis in apple juice. The response surfaces and contour plots of the bacterial growth conditions are presented in Figs. 1–3. Also, the effect of inulin and yeast extraction concentrations on the response is shown in Fig. 1. The growth of microorganism was increased with the yeast extract concentration increasing to a certain value, thereafter was constant. It is due to the low content of free amino acids and small peptides in the apple juice medium (Elbert & Esselen, Reference Elbert and Esselen1959) and could be improved by adding the yeast extract. The content of both small peptides and vitamins improved the bacterial growth. Avonts et al. (Reference Avonts, Van Uytven and De Vuyst2004) have shown that addition of yeast extract (0·3–1·0% w/v) to milk medium enhanced both growth and bacteriocin production for all strains and no growth took place in milk medium without that.
Response surface plot (a) and its contour plot (b) for the effects of inulin concentration and yeast extract concentration on log10 (CFU/ml) at its centre level.

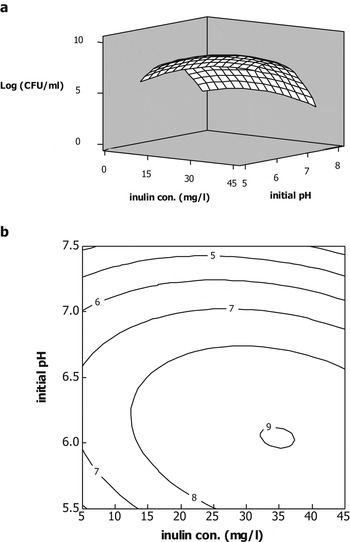
An inverse effect was observed to that of pH value (Figs. 2 and 3). As pH increased the response decreased. These results were also confirmed by Doleyres et al. (Reference Doleyres, Fliss and Lacroix2002). They reported lower growth of Bifido. longum with increased pH. The results showed that the growth of Bifido. animalis subsp. lactis was dramatically decreased when initial pH of culture media increased to 7·5 (Fig. 2). According to Poolman & Konings (Reference Poolman and Konings1988), the amino acid or peptide transport, which is one of the growth-rate-determining steps, depends on the pH of the culture medium. The optimum pH for the growth of bifidobacteria has been reported to be between 6·5 and 7·0 (Rozada-Sánchez et al. Reference Rozada-Sánchez, Sattur, Thomas and Pandiella2008). Thus, the low nutrient consumption and consequently, the low growth rate of microorganism during incubation in the culture at the initial pH=7·5, could be related to a limitation in nutrient transport.
Response surface plot (a) and its contour plot (b) for the effects of inulin concentration and initial pH on log10 (CFU/ml) at its centre level.

Response surface plot (a) and its contour plot (b) for the effects of yeast extract concentration and initial pH on log10 (CFU/ml) at its centre level.

The inulin supplementation of apple juice had a significant influence on the growth of Bifido. animalis subsp. lactis (Figs. 1 and 3). The effect of inulin has already been reported to stimulate Bifidobacterium spp. metabolism (Shin et al. Reference Shin, Lee, Pestka and Ustunol2000; Bruno et al. Reference Bruno, Lankaputhra and Shah2002; Akalın et al. Reference Akalın, Fenderya and Akbulut2004). Also the results showed that in compared with yeast extract the prebiotic growth development effects of inulin is weaker.
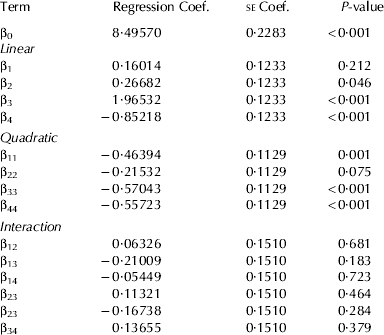
The effects of growth conditions on the log10 (number of viable cells/ml) by the regression coefficients of fitted second-order polynomial are presented in Table 3. It was evident that the linear terms except for lactose concentration were significant (P<0·05), whereas all the interaction terms were not significant (P>0·05). The results indicated that the pH and yeast extraction concentration were the major contributing factors to growth of Bifido. lactis (Table 3). Rozada-Sánchez et al. (Reference Rozada-Sánchez, Sattur, Thomas and Pandiella2008) also showed that yeast extract is a strong growth promoter for Bifidobacterium spp. Most strains of Bifidobacteria are unable to grow in a totally synthetic medium and require complex nitrogenous substrates such as bovine casein hydrolysates, milk whey or yeast extract (Poch & Bezkorovainy, Reference Poch and Bezkorovainy1988; Petschow & Talbott, Reference Petschow and Talbott1990).
Significance of regression coefficients of the fitted second-order polynomial model for response (Y)

Fitting the model and Response surface analysis
The experimental results of the growth of Bifido. animalis subsp. lactis were presented in Table 2. The log10 (number of viable cells/ml) was analysed to get a regression model. The following mathematical model was used to express response as a function of the independent variables:
 $$\eqalign{Y = & 8{\cdot}49 + 0{\cdot}26x_2 + 1{\cdot}96x_3 - 0{\cdot}85x_4 \cr & - 0{\cdot}46x_1 ^2 - 0{\cdot}57x_3 ^2 - 0{\cdot}55x_4 ^2} $$
where Y is the log10 (number of viable cells/ml), whereas x 1, x 2, x 3 and x 4 are the coded variables for lactose, inulin and yeast extract concentration and initial pH respectively.
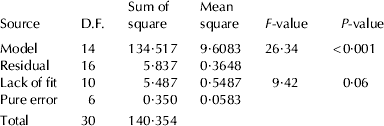
If the model exhibits an unsuitable fit, there may be poor or misleading results from a fitted response surface (Liyana-Pathirana & Shahidi, Reference Liyana-Pathirana and Shahidi2005). An ANOVA analysis was performed in Table 4. The P-value of the model was less than 0·001 (Table 4). This confirmed that the model fitness was good and acceptable. For Eq. (2), lack of fit P-value of 0·06 implied that the model of number of viable cells developed was insignificance. The non-significant lack of fit indicates good predictability of the model (Khayati Reference Khayati2013). Coefficient of determination (R 2) is defined as the ratio of the explained variation to the total variation and used to measure the degree of fitness (Nath & Chattopadhyay, Reference Nath and Chattopadhyay2007). The closer the R 2 value to unity, the better the empirical models fits the actual data (Sin et al. Reference Sin, Yusof, Hamid and Rahman2006). On the other hand, the smaller the R 2 value the less relevance the dependent variables in the model have in explaining the behaviour of variations (Lee et al. Reference Lee, Yusof, Hamid and Baharin2006). By analysis of variance, the R 2 value of this model was determined to be 0·958. Therefore, the developed model could adequately represent the real relationship among the factors chosen.
Analysis of variance (ANOVA) of the regression parameters for the response surface model

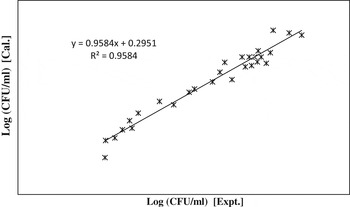
Regression model was used for the log10 (number of viable cells/ml) predicted values calculation and the results compared with the experimental values (Fig. 4). The figure showed that was good agreement between model (Eq. 2) and experimental data.
The relationship between the calculated the growth of probiotic Bifido. animalis subsp.lactis and experimental data.

Conclusion
The response surface methodology was successfully employed to the growth of Bifido. animalis subsp. lactis. The second-order polynomial model gave a satisfactory description of the experimental data. Yeast extract concentration and initial pH culture media were the most important factors affecting on the growth of the microorganism, whereas lactose concentration had no significant effects (P>0·05). Predicted and experimental results showed high similarity, which reflected the accuracy and applicability of RSM to process optimisation of probiotic production. The present study introduced the new production conditions for Bifidobacterium strains that are potentially useful to the production of novel dairy foods for human health benefit.