Most of the published articles in the disaster medicine literature are qualitative, and most of those that are quantitative are descriptive in nature.Reference Auf der Heide1 The dominance of qualitative methodology in disaster medicine research is the result of the difficulty in controlling the many variables, the evanescence of data, and the lack of quantitative benchmarks parameters.Reference Auf der Heide1 The lack of such parameters, based on which analytical, quasi-experimental, and experimental research can be conducted, still afflict the field of disaster medicine and the science of surge,Reference Handler, Gillam, Kirsch and Feied2 including multiple casualty events (MCE) at both the prehospital and hospital-based levels.
Hospital surge capacity is the core of the health care facility–based medical response in MCE and an integral part of the total medical capacity of the community affected.3Reference Carmona4Reference Barbisch and Koenig5Reference Burkle6Reference Estacio7Reference Wise8Reference Kaji, Koenig and Bey9Reference McManus, Huebner and Scheulen10Reference Stratton and Tyler11Reference Bonnett, Peery and Cantrill12 Many articles have described various aspects of hospital surge capacity.Reference Hirshberg, Holcomb and Mattox13Reference Levi, Michaelson, Admi, Bregman and Bar-Nahor14Reference Arnold, Tsai, Halpern, Smithline, Stok and Ersoy15Reference Hick, Hanfling and Burstein16Reference Hanfling17Reference Burt and McCaig18Reference Kelen, Kraus and McCarthy1920Reference Voelker21Reference Hick, Koenig, Barbisch and Bey22 However, there is no single universally accepted definition or quantification of its various components, as acknowledged by the 2006 Academic Emergency Medicine Consensus Conference entitled “Science of Surge Capacity.”Reference Koenig and Kelen23
More recently, a taxonomy system of surge capacity was proposed by Hick et al,Reference Hick, Barbera and Kelen24 categorizing it into “conventional capacity (implemented in major mass casualty incidents and representing care as usually provided at the institution), contingency capacity (using adaptations to medical care spaces, staffing constraints, and supply shortages without significant impact on delivered medical care), and crisis capacity (implemented in catastrophic situations with a significant impact on standard on care).”
From a quantitative perspective, de Boer proposed based on trauma exercises, that each hospital under regular circumstances could care for a number of critically and moderately injured patients equivalent to 0.5 to 1 patient per 100 hospital beds per hour.Reference De Boer25 With the activation of the surge plan, this number increased to 2 to 3/100 hospital beds per hour for a maximum of 8 hours.
Rivara et al conducted a survey of 133 trauma centers that showed that if the average emergency department (ED) time necessary for diagnosis and treatment is set at 2 hours per patient, then the ED throughput in 6 hours in level I trauma centers (median 39 ED beds) was 117 patients and 75 patients in level II centers (median 25 ED beds).Reference Rivara, Nathens, Jurkovich and Maier26
Hirshberg et al took into consideration the quality of care provided in trauma-related MCE.Reference Hirshberg, Scott, Granchi, Wall, Mattox and Stein27 They determined in a simulation study that using immediately available resources, Ben Taub Hospital (Houston, TX) could adequately care for 4.6 critical trauma patients per hour. A full disaster plan deploying all of the hospital's trauma assets including staff called from home increased the capacity to 7.1, beyond which point the trauma system of the hospital began to fail. Hirshberg and colleagues argued that “there will be no difference in the level of care between casualty loads of 50 or 500 critical casualties per hour.”Reference Hirshberg, Scott, Granchi, Wall, Mattox and Stein27 Those numbers (4.6 and 7.1) were calculated by regressing the number of critical patients per hour on the mean level of care (made dependent on 6 variables by Hirshberg et al). They defined adequate level as a mean level of care of ≥90% of the optimal care (care of a single critical trauma patient during normal daily operations).
OBJECTIVES
The first objective of the present study was to benchmark quantitatively the various components of hospital surge capacity pertaining to the care of critically and moderately injured patients in trauma-related MCE. The second objective was to illustrate the applications of those quantitative parameters in local, regional, national, and even international disaster planning; in the distribution of patients to various hospitals by prehospital medical services; and in the decision-making process for ambulance diversion.
METHODS
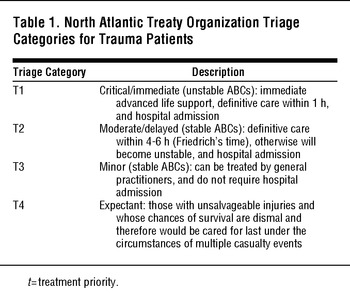
A 2-step approach was adopted in the methodology of this study. First, an extensive literature search was performed, followed by mathematical modeling. A literature review of MEDLINE, EMBASE, and CINAHL from 1950 to July 2009 was conducted to identify articles of interest using the following search terms individually and in various combinations: “hospital,” “surge,” “capacity,” “emergency department,” “trauma,” “multiple casualty,” “disaster,” “modeling,” and “management.” Identified quantitative studies on hospital surge capacity in trauma-related MCEReference De Boer25Reference Rivara, Nathens, Jurkovich and Maier26Reference Hirshberg, Scott, Granchi, Wall, Mattox and Stein27 were used as the basic framework for our model. Preliminary validation of the model was achieved by comparing the results of the model to those of various quantitative studies. The North Atlantic Treaty Organization triage categories for trauma patients (T1-T4; Table 1) were used in our model for simplicity.Reference De Boer25
North Atlantic Treaty Organization Triage Categories for Trauma Patients

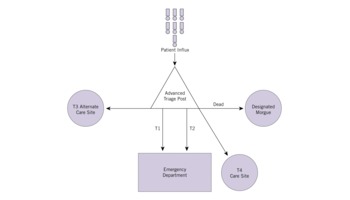
Critical casualties in this model (T1) were considered to be equivalent to trauma casualties with an Injury Severity Score of ≥16 and to the red category in the Simple Triage And Rapid Treatment (START) system. Moderate casualties in this model (T2) were considered to be equivalent to trauma casualties, with an Injury Severity Score <16 requiring admission to the hospital and to the yellow category in the START system. Time zero was defined as the time of arrival of the first T1 or T2 at the hospital. Patients with minor injuries were excluded from our model because the delay in their medical care is inconsequential and because alternate care sites have been proposed as safe and effective locations for delivery of care to a large influx of patients with minor injuries, which protects the integrity of existing hospitals, emergency departments' infrastructure, and ongoing operations (Figure 1).Reference Eastman, Rinnert, Nemeth, Fowler and Minei28
Emergency department access control.

RESULTS
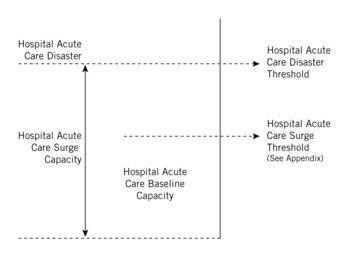
Two complementary components of hospital surge capacity pertaining directly to the care of critically and moderately injured patients were identified in trauma-related MCE: hospital acute care surge capacity (HACSC) and hospital bed surge capacity (HBSC). Following the framework recommended by McCarthy et alReference McCarthy, Aronsky and Kelen29 and Hirshberg et al,Reference Hirshberg, Scott, Granchi, Wall, Mattox and Stein27 HACSC was expressed as a rate and defined as the maximum number of critically and moderately injured patients for whom a hospital can adequately care during a defined period of time. The upper limit of HACSC is conceptually the beginning of the hospital acute care disaster, above which care for patients deteriorates exponentially even after recruiting more medical assets (decay of care). This is because HACSC is not infinite; it is limited not only by equipment and staff but also by access to services (eg, CT scans, operating rooms, hospital beds) (Figure 2). By definition, HACSC is the total capacity per hour because it includes both the regular baseline capacity using immediately available resources and the “extra” capacity generated by mobilization of additional resources.
Acute care components of hospital surge capacity.

Proposed Quantitative Model for Hospital Surge Capacity in Trauma-Related MCE
HACSC was defined in our proposed model as the maximum number of critical (T1) and moderate (T2) casualties for which a hospital can adequately care per hour. The capacity to deliver adequate care for critical patients per hour (cp/h) as described by Hirshberg et al was used as the basis for our modeling methodology because they specifically looked at quality of care in their study. At Ben Taub Hospital, the number of ED beds (EDB) in MCE could be expanded to 69, according to Hirshberg et al.Reference Hirshberg, Scott, Granchi, Wall, Mattox and Stein27 In that setting, the maximum number of T1 that could be adequately cared for per hour after activating the surge plan was estimated to be 7.1 cp/h, which corresponds to the number of EDB divided by 10 (69/10 ≈ 7.1). Furthermore, data from the study of Hirshberg et al indicate that the ratio of T1 to T2 that can be adequately cared for and admitted is 1:3. Therefore, HACSC as defined by our model is equal to (#EDB/10) multiplied by 4 (1 + 3 = 4) to account for both T1 and T2; HACSC = [(#EDB/10)*4].
Emergency Department Time Concept
Emergency department time (EDT) was defined as the time from ED triage that is necessary for adequate diagnosis, treatment, and actual disposition of critically and moderately injured patients. The EDT for T1 and T2 is de facto an emblem of HACSC, and an important concept already in use by EDs during normal operations. The shorter the EDT, the higher the HACSC is. However, this is conditioned by providing adequate care. With the activation of the surge plans of hospitals, the EDT would be shortened to accommodate more patients being received. If the EDT is set at 2.5 hours per patient, then the equation HACSC = (#EDB/10)*4 can be rewritten as HACSC = #EDB/EDT = #EDB/2.5 because 4/10 = 1/2.5 = 0.4. Thus, the maximum number of T1 and T2 for which each hospital can adequately care per hour in trauma-related MCE is represented by the following final equation:
HACSC = #EDB/EDT = #EDB/2.5 (with a maximum of 25% of the patients being critically injured) (1)
For example, a level I trauma center with an EDB capacity of 69 will have an HACSC of about 27 (T1 + T2) per hour, of which 7 is the maximum number of critically injured patients. The concept of EDT abbreviation to 2.5 hours—upon activation of the surge plan—can be used by ED directors and managers as the average ED target time in trauma-related MCE for both T1 and T2 combined. Evidently, the EDT for T1 is expected to be shorter than that of T2 because critically injured patients have priority for critical resources utilization, such as receiving CT scans, being taken to operating rooms, and admitted to intensive care units.
Hospital Acute Surge Capacity in 6 Hours (HACSC6)
Because most of the victims of explosion events present within the first 6 hours to hospital EDs,Reference Greenberg and Hendrickson30 it is important to model the maximum number of critically and moderately injured patients for whom a hospital can adequately care in 6 hours (HACSC6). Therefore,
HACSC6 = HACSC*6 = [(#EDB/2.5)*6] (2)
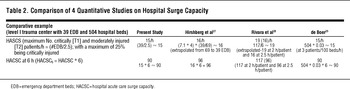
The results of our model on HACSC and HACSC6 were consistent with those of the other 3 quantitative studies (Table 2).
Comparison of 4 Quantitative Studies on Hospital Surge Capacity

HBSC
Several articles attempt to define and quantify Hospital Bed Surge Capacity (HBSC).Reference Hick, Hanfling and Burstein16Reference Kelen, Kraus and McCarthy19Reference Halpern, Tsai, Arnold, Stok and Ersoy31Reference Levi, Bregman, Geva and Revah32Reference Davis, Poste, Hicks, Polk, Rymer and Jacoby33Reference DeLia34Reference Einav, Aharonson-Daniel, Weissman, Freund and Peleg35Reference Cosgrove, Jenckes and Kohri36Reference Challen and Walter37Reference Roccaforte and Cushman38 In this model, because all (T1 + T2) by definition would require admission, HBSC is defined as the number of staffed beds that need to be made available within 6 hours, must match HACSC6 to ensure coordinated care and to prevent bottlenecks. HBSC is equal to the number of available staffed beds (pre-event) plus the number of occupied staffed beds that can be physically vacated and ready to accept new patients within 6 hours plus the number of extra beds that can be added to service and be staffed. For example, HBSC at a level I trauma center with 39 EDB and 504 hospital beds needs to match HACSC6 = [(39/2.5] * 6 = 93. This number (93) corresponds to about 18% of the hospital bed capacity (HBC); 504 * 0.18 = 93. Therefore, mathematically modeled,
HBSC = HBC * 0.18 (3)
This number (18% of the HBC) is consistent with the recommendations by Hick et alReference Hick, Hanfling and Burstein16 (10%-20%) and Halpern et alReference Halpern, Tsai, Arnold, Stok and Ersoy31 (15%-20%). Note that this percentage depends on a hospital-to-EDB ratio of 13:1 or more. If the ratio is <13, then a higher percentage of HBC (>18%) should be recruited to match HACSC6. This is an important concept that should be explored in hospital planning and design.
COMMENT
At the core of evidence-based medicine is the concept of quantitative parameters, or metrics. The present authors define the term disaster metrics as the quantitative field of measurement, evaluation, statistics, and assessment pertaining to MCE of any nature, or pertaining to any aspect of disaster medicine including prevention/mitigation, preparedness, response, recovery, training, and education. Although some authors imply trauma when using the term MCE, this term is conceptually applicable to all types of events that generate multiple patients (ie, injured by chemical, biological, radiological, nuclear, explosives, other trauma, miscellaneous, or mixed). Applications of disaster metrics in MCE comprise but are not limited to scales and indexes, risk analysis, benchmarking, performance indicators, intervention effectiveness, simulation and modeling, and so forth. All of the quantitative parameters illustrated in our model are categorized as disaster metrics. HACSC, HACSC6, and HBSC are examples of disaster metrics that can be quantitatively benchmarked for every hospital for use by both hospital and prehospital disaster managers.
In trauma, hospital acute care surge capacity is dependent on the coordinated care in 4 potential patient care units (emergency departments, operating rooms, acute care areas for critical patients, general medical/surgical services) and 2 diagnostic services (radiological and laboratory services). Requisite to the success of coordinated medical care is the bed availability for critically and moderately injured patients who require admission; otherwise, there will be the bottleneck phenomena in the EDs, radiology suites, and the operating recovery rooms.
Although our proposed model expresses hospital acute care surge capacity in terms of the number of beds in the ED (Equation 1), our modeling methodology reflects the total medical capacity of the hospital (structure, staff, and stuff), including various services. This was highlighted by the consistency of our results with various quantitative studies on hospital surge capacity (Table 2). In addition, the proposed model does not assume empty EDs because in reality there are none. The number of critically and moderately injured trauma patients, who are not related to the specific MCE and are still under the care of the ED, is accounted for in our model. For example, if a level I trauma center with a HACSC of 27 (of which a maximum of 7 can be T1) has 2 critical patients from daily “regular” trauma, then this center can receive only 5 T1 from the MCE during the next hour.
Furthermore, the concept of HACSC being inversely proportional to EDT, as long as adequate care is maintained, is germane. Until we have information on individual EDTs for T1 and T2 separately, the proposed formula of HACSC = #EDB/EDT (with EDT of 2.5 hours in trauma-related MCE) holds for both T1 and T2 combined. It is important to note that the proposed EDT of 2.5 hours is specific only to trauma-related MCE and not to chemical, biological, radiological, and nuclear MCE; however, fundamental concepts of this model pertaining to hospital surge capacity, such as HACSC, may be adopted in non-traumatic MCE. As more data accumulate on the medical care of critically and moderately injured patients in chemical, biological, radiological, and nuclear events, injury-specific EDT may become available and used to estimate the various components of hospital surge capacity pertaining to the acute care of critically and moderately injured patients, based on a comparable framework.
In summary, the fact that the modeled HACSC6 is consistent with other quantitative studiesReference De Boer25Reference Rivara, Nathens, Jurkovich and Maier26Reference Hirshberg, Scott, Granchi, Wall, Mattox and Stein27 in regards to the maximum capacity (Table 2), and that the HBSC of 18% is consistent with the current recommendations,Reference Hick, Hanfling and Burstein16Reference Kelen, Kraus and McCarthy19 both indicate that the fundamental concept of HACSC can be adopted in trauma-related MCE.
Application of the Proposed Model in Local, Regional, National, and International Disaster Planning
The proposed model can provide a framework for conducting a systematic and comprehensive estimation of surge capacities of hospitals, which would be made available to all concerned parties, including prehospital and hospital managers and directors. This task can be led by public health departments because all-hazards preparedness is one of their emerging roles. Comprehensive data banks for hospital surge capacity may be generated to quantify the total medical capacity of hospitals within each unit of measurement on the local, regional, multiregional, and national levels. These data bank registries can be shared among neighboring countries to coordinate efforts in international cross-border events.
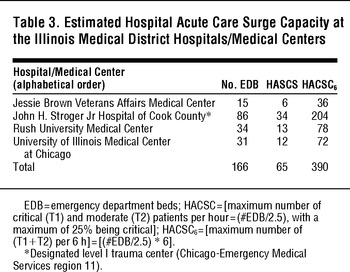
In Chicago, for example, there are 4 major medical centers a few blocks from one another that form the core of the Illinois Medical District. Table 3 shows the estimated HACSC and HACSC6 for each medical center individually and collectively (total). The capacity of each hospital to adequately care for T1 and T2 per hour is bounded by its corresponding HACSC. As time progresses in MCE, various resources including staff, stuff, and structure become exhausted, and the maximum capacity ceiling (HACSC6) is reached (Table 3).
Estimated Hospital Acute Care Surge Capacity at the Illinois Medical District Hospitals/Medical Centers

Based on our model, the 4 Illinois Medical District hospitals can collectively provide adequate care for 65 critically (T1) and moderately injured (T2) trauma patients per hour (16 critically and 49 moderately) and a total of 390 patients (25% of which are T1) per 6 hours. At that point, capacity ceilings are reached, leading to exponential decay in the care that is delivered to patients.Reference Hirshberg, Scott, Granchi, Wall, Mattox and Stein27
Application of the Proposed Model in the Distribution of Patients by Prehospital Services
The predetermined HACSC affects the decision pertaining to the distribution of patients by prehospital services among various hospitals and affects the selection of the number of hospitals involved in the response. Attempts should be made first to distribute patients so that the HACSC of each designated hospital during any hour would not be exceeded. If those numbers are reached, then the number of T1 and T2 distributed to that specific hospital during the next hour(s) needs to be adjusted accordingly, and the situation needs to be revised periodically. If the number of T1 + T2 distributed per hour approaches the cumulative HACSC of the initially designated hospitals, then a decision to recruit more hospitals would be necessary. This high level of coordination can be achieved by frequent communication of prehospital services to the receiving hospitals. The objectives of this communication are to keep track of all T1 and T2 sent by ambulances to specific hospitals and of those arriving by private transportation or walk-ins from MCE, and to account for critically and moderately injured patients from daily “regular” trauma.
Application of the Proposed Model in Ambulance Diversion
If the number of critically and moderately injured patients reaches HACSC6 = [(#EDB/2.5) * 6], then complete ambulance diversion is required. The reason for this is that any subsequent T1 + T2 received will not be adequately accommodated because the resources and HBSC would be capped.
Comparison of 4 Hospital Surge Capacity Models
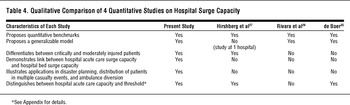
In quantifying the hospital surge capacity in trauma-related MCE, Table 4 compares the characteristics of the various quantitative models/studies in the literature (Table 4).
Qualitative Comparison of 4 Quantitative Studies on Hospital Surge Capacity

Limitations
The authors faced various limitations in our effort to bring quantitative benchmarks to hospital surge capacity for critically and moderately injured patients in trauma-related MCE. Every attempt was made to have the modeling process follow a rigorous logical and reasonable methodology, applying the principles of systems thinking as it pertains to trauma-related MCE, prehospital, and hospital-based medical response. Our proposed metrics may be criticized on several levels. One important limitation is that the model is theoretical and based on a simulation study (Hirshberg et alReference Hirshberg, Scott, Granchi, Wall, Mattox and Stein27); however, the metrics proposed correlate with other published recommendations, including the 3 quantitative studies on hospital surge capacity.Reference De Boer25Reference Rivara, Nathens, Jurkovich and Maier26Reference Hirshberg, Scott, Granchi, Wall, Mattox and Stein27 Second, hospital surge capacity was expressed in terms of EDB, which may not accurately reflect resources and expertise in various hospitals. There is, however, a positive correlation between the number of EDB and the scope of medical services in health care facilities. In addition, ED resources are frequently the first to be exhausted in MCE. Third, because the metrics are generally derived from larger centers, this model may not be applicable to smaller hospitals that do not have trauma capacity for critically injured patients. Fourth, the model is based on the trauma literature. The reason is that trauma studies constitute the bulk of the available literature on hospital surge and MCE. Finally, in reference to the surge taxonomy, this proposed model likely holds for conventional and contingency capacities but not for crisis capacity, in which there is a significant impact on the standards of care.
CONCLUSIONS
In this article, a new quantitative model for hospital surge capacity in trauma-related MCE, disaster metrics, has been proposed. Disaster metrics builds on the qualitative taxonomy system for surge capacity proposed by Hick at al.Reference Hick, Barbera and Kelen24 Prospective studies are needed to verify the applicability, generalizability, and validity of the model. This proposed model (HACSC, HACSC6, and HBSC) may help open the door to a much-needed inferential research in the field of disaster medicine.Reference Kelen and McCarthy39Reference Phillips40Reference Asplin, Flottemesch and Gordon41Reference Schultz and Koenig42Reference Rothman, Hsu, Kahn and Kelen43
APPENDIX
Hospital Acute Care Surge Threshold
The hospital capacity under regular conditions fluctuates depending on the hour of the day, day of the week, and holidays. This baseline capacity is the basis of the Hospital Acute Care Surge Capacity (see Figure 2).Reference Jenkins, O’Connor and Cone44Reference Davidson, Koenig and Cone45 The hospital acute care surge threshold (HACST) is defined in our model as the maximum number of T1 and T2 patients for whom a hospital can adequately care per hour using only immediately available resources, and above which activating the surge plan becomes a necessity to ensure adequate care. The hospital baseline acute care capacity in this model is defined as the maximum capacity under regular conditions at which the resources are at their peak, which usually translates to a regular weekday morning (eg, Monday, 11 AM).
Proposed Quantitative HACST Model
Following the same modeling methodology for HACSC, the maximum number of T1 that could be adequately cared for per hour at Ben Taub Hospital using immediate resources was estimated by Hirshberg et alReference Hirshberg, Scott, Granchi, Wall, Mattox and Stein27 to be 4.6. Note that the number 4.6, when expressed in terms of EDB, is equal to the number of EDB at Ben Taub (69) divided by 15 (69/15 = 4.6). Furthermore, with a T1-to-T2 ratio of 1:3, HACST = [(#EDB/15) * 4] (1 + 3 = 4 to account for both T1 and T2). HACST for both T1 + T2 at Ben Taub would be 18 [(69/15) * 4 ≈ 18]. Any modeling beyond this point (eg, if all are T2) becomes complicated and impractical.
The regular EDT is defined as the target EDT for both T1 and T2 combined using immediately available assets, and if set at 3.75 hours per patient, the equation HACST = (#EDB/15) * 4 can be rewritten as HACST = #EDB/EDT = #EDB/3.75 because 4/15 = 1/3.75 ≈ 0.27. As noted earlier, when the surge plan is activated, the EDT is shortened from 3.75 to 2.5 hours.
Application of HACST in Activation of the Hospital Surge Plan
If the number of T1 per hour approaches the maximum value that can be cared for using immediate assets (ie, #EDB/15), or if the number of T1 and T2 per hour approaches HACST (#EDB/3.75), then the hospital surge plan should be on standby (alert) mode. If those numbers are reached, then the hospital surge plan needs to be activated to ensure adequate care.
Application of HACST in Distribution of Patients by Prehospital Services
The predetermined HACST also affects the decision in MCE pertaining to the distribution of patients among hospitals and to the selection of hospitals needed to adequately care for an estimated number of T1 and T2. Attempts should be made first to distribute the patients so that HACST of designated hospitals during any hour would not be exceeded to avoid activation of surge plans of various hospitals that would require the mobilization of large resources.
Author Disclosures: The authors report no conflicts of interest.
Acknowledgments: The authors thank Ahmad Bayram for his technical support.