1.0 INTRODUCTION
Data mining is the search for new, valuable and nontrivial information in large volumes of data. It is a cooperative effort by humans and computers. The best results are achieved by balancing the knowledge of human experts in describing problems and goals with the search capabilities of computers. In practice, the two primary goals of data mining tend to be prediction and description. Prediction involves using some variables or fields in the dataset to predict unknown or future values of other variables of interest. Description, on the other hand, focuses on finding patterns describing the data that can be interpreted by humans. Therefore, it is possible to put data mining activities into one of two categories: 1) predictive data mining, which produces the model of the system described by the given dataset, or 2) descriptive data mining, which produces new, nontrivial information based on the available dataset. On the predictive end of the spectrum, the goal of data mining is to produce a model, expressed as an executable code, which can be used to perform classification, prediction, estimation or other similar tasks. On the other descriptive end of the spectrum, the goal is to gain an understanding of the analysed system by uncovering pattern and relationships in large scale aircraft dataset.
Feature selection is a term commonly used in data mining to describe the tools and techniques available for reducing inputs to a manageable size for processing and analysis. Feature selection implies not only cardinality reduction, which means imposing an arbitrary or predefined cut-off on the number of attributes that can be considered when building a model, but also the choice of attributes, meaning that either the analyst or the modelling tool actively selects or discards attributes based on their usefulness for analysis. The ability to apply feature selection is critical for effective analysis, because datasets frequently contain far more information than is needed to build the model. Even if resources are not an issue, one typically wants to remove unwanted features because they might degrade the quality of discovered patterns because some features are noisy or redundant. This noise makes it more difficult to discover meaningful patterns in the data. To discover quality patterns, the data mining algorithms require much larger training aircraft accident dataset on large scale dataset.
We have used different feature selection techniques for discovering attributes evaluator and generating a classification algorithm. These techniques are: correlation feature selection subset evaluator, consistency subset evaluator, gain ratio feature evaluator, information gain attribute evaluator, OneR feature evaluator, principal components attribute transformer, ReliefF attribute evaluator and symmetrical uncertainty attribute.
In this paper, we applied different data mining methods on the aircraft accident reports. We found that feature selection between attributes and classification algorithms to find the relations and rules about the accidents resulted in fatality. We also used Weka as a pre-processing tool to select the attributes to be used in the large-scale data analysis. This paper focuses on different feature selection techniques and applying traditional classification algorithms to understand and clean the dataset. Feature selection attributes are going to be used in this study in order to reduce the number of initial attributes. The classification techniques of data mining are used to predict the warning level of the component as the class attribute.
We have different classifier algorithms such as Bayes classifiers, functions classifiers, lazy classifiers, MISC classifiers, rules classifiers, and decision tree classifiers to be considered for comparing their performance based on the large-scale aircraft dataset. In this experimentation, tenfold cross-validation methods for comparison of selected classification algorithms have been used. This paper concentrates on performance of classifier algorithms with different features combinations such as CFS, consistency, GR, information gain, OneR, PCA, ReliefF and symmetric with the selected datasets and on the improvement of the classification accuracy.
The paper is organized as follows. In Sections 2 and 3, we discuss the related work and proposed work. In Section 4, we produce the experimental results and discussion about classification with feature selection rule discovery for the large-scale aviation dataset.
2.0 RELATED WORK
Data mining is a multidisciplinary effort to extract nuggets of knowledge from data. The proliferation of large datasets within many domains poses unprecedented challenges to data mining as defined by Han and Kamber(Reference Han and Kamber14). Not only are datasets getting larger, but new types of data are also becoming prevalent, such as data streams on the web, microarrays in genomics and proteomics, and networks in social computing and systems biology. Researchers are realizing that in order to achieve successful data mining, feature selection is an indispensable component, as proposed by Guyon and Elisseeff(Reference Guyon and Elisseeff13) and Liu and Motoda(Reference Liu and Motoda17).
Feature selection is normally done by searching the space of attribute subsets and evaluating each one. This is achieved by combining an attribute subset evaluator with a search method. In the present investigation, an evaluation of six filter feature subset methods with a rank search or greedy search method was performed to find out the best feature sets, and they are listed below for reference: (1) correlation-based attribute evaluation (CB); (2) chi-square attribute evaluation (CH); (3) Gain-Ratio attribute evaluation (GR); (4) Information Gain attribute evaluation (IG); (5) ReliefF attribute evaluation (RF); and (6) Symmetrical Uncertainty attribute evaluation (SU). That these entire filter techniques mentioned above could assess the relevance of features has been studied by Saeys et al(Reference Saeys, Inza and LarraÑaga31) on the basis of the intrinsic properties of the data. Feature selection often increases classifier efficiency by reducing the size of the effective features.
Correlation feature subset selection evaluates the worth of a subset of attributes by considering the individual predictive ability of each feature along with the degree of redundancy between them. Correlation coefficients are used to estimate correlation between subset of attributes and class, as well as inter-correlations between the features. Relevance of a group of features grows with the correlation between features and classes, and a decrease with growing inter-correlation as has been studied by Asha et al(Reference Asha, Manjunath and Jayaram5). The study by Antonio et al(Reference Antonio, Benitez and Castro3) established that, in order to predict the concept or class value of its instances, a dataset with the selected features alone must be consistent. The information gain measure is biased towards tests with many outcomes. That is, it prefers to select attributes having a large number of possible values over attributes with fewer values even though the latter is more informative, as defined by Asha et al.
Information Gain (IG) is a commonly used measure in the fields of information theory and machine learning. IG measures the number of bits of information gained about the class prediction by knowing the value of a given feature when predicting the class, according to the method proposed by Altidor et al(Reference Altidor, Khoshgoftaar, Van Hulse and Napolitano2). Rule-based algorithms provide ways to generate compact, easy-to-interpret and accurate rules by concentrating on a specific class. One way of generating classification rules is to use decision trees. The disadvantage of using a decision tree is its complex and incomprehensible nature, which has been noted in the literature(Reference Berry25). Principal component analysis (PCA) is a standard technique used to handle linear dependence among variables. A PCA of a set of m variables generates m new variables (the principal components), PC1. . .PCm. Each component is obtained by linear combination of the original variables and has been studied by Grimaldi et al(Reference Grimaldi, Cunningham and Kokaram18).
ReliefF is an easy-to-use, fast and accurate algorithm even with dependent features and noisy data as defined by Wang et al(Reference Wang, Khoshgoftaar and Napolitano29). Symmetric uncertainty is used to measure the degree of association between discrete features. It is derived from entropy that has been proposed by Chen et al(Reference Chen, Li, Cheng, Guo, Lipmaa, Yung and Lin7). Symmetrical uncertainty is calculated by the above equation. H(X) and H(Y) represent the entropy of features X and Y. The value of symmetrical uncertainty ranges between 0 and 1. The value of 1, indicating that one variable (either X or Y) completely predicts the other variable, has been studied by Ienco et al(Reference Ienco, Pensa and Meo15).
Feature selection is a process of selecting a subset of original features according to certain criteria and is an important and frequently used technique in data mining for dimension reduction. It reduces the number of features; removes irrelevant, redundant or noisy features; and brings about palpable effects for applications, thus speeding up a data mining algorithm, improving learning accuracy and leading to better model comprehensibility. Various studies show that some features can be removed without performance deterioration as shown by Ng(Reference Ng23) and Donoho(Reference Donoho9).
Feature selection can be found in many areas of data mining such as classification, clustering, association rules and regression. For example, feature selection is called subset or variable selection in statistics(Reference Miller19). Guyon and Elisseeff(Reference Guyon and Elisseeff13) have proposed the reducing of the number of dimensions by selecting variables or features which is effective in dealing with high-dimensional data. Variable and feature selection have become the focus of much research in areas of application for which datasets with many number of variables are available. The objective of variable selection is threefold: improving the prediction performance of the predictors, providing faster and more cost-effective predictors, and providing a better understanding of the underlying process that generated the data. Feature selection has been an active research area in the pattern recognition, statistics and data mining communities.
A decision based on selected features about whether a dangerous surgery is necessary has been studied by Kim et al(Reference Kim, Street and Menczer30). Delimata and Suraj(Reference Delimata and Suraj28) have dealt with feature selection, which is usually meant as a process of finding a subset of features from the original set of features forming patterns in a given dataset, optimised according to the defined goal and criterion of feature selection. Many classification problems involve features whose specificity demands some form of feature space transformation (pre-processing) coupled with post-processing consensus analysis in order to accomplish a successful discrimination between different classes. Pizzi and Pedrycz(Reference Pizzi and Pedrycz24) have presented a new methodology that systematically addresses these design classification issues in their study. At the pre-processing phase, they offer a new approach of stochastic feature selection. This type of feature selection collates quadratically transformed feature subsets for presentation to a collection of respective classifiers. Feature selection has been an active and fruitful field of research area in the pattern recognition, machine learning, statistics and data mining communities and has been studied by Mitra et al(Reference Mitra, Murthy and Pal20) and Miller(Reference Miller19).
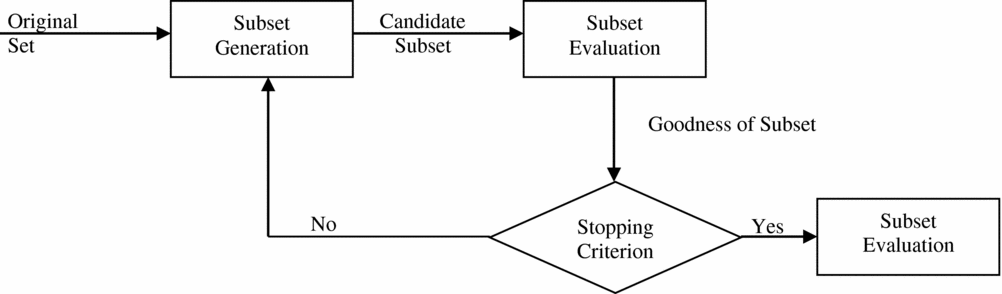
Subset generation is a search process that produces candidate feature subsets for evaluation based on a certain search strategy. Each candidate subset is evaluated and compared with the previous best one according to a certain evaluation. If the new subset turns to be better, it replaces the best one. This process is repeated until a given stopping condition is satisfied. Ranking of features determines the importance of any individual feature, neglecting their possible interactions. Ranking methods are based on statistics, information theory or on some functions of the classifier's outputs, as studied by Duch et al(Reference Duch, Winiarski, Biesiada and Kachel10).
Decision tree induction as defined by Han and Kamber(Reference Han and Kamber14) is a very popular and practical approach for pattern classification. Narasimha and Susheela(Reference Narasimha and Devi21) have dealt with the Naïve Bayes (NB) classifier, a simple probabilistic classifier based on the Bayes theorem where every feature is assumed to be class-conditionally independent. Classification of instances gets difficult when the dataset contains a large number of features and classes because it takes enormous numbers of observations to estimate the probabilities. A Support Vector Machine (SVM) is a hyperplane that separates two different sets of samples with maximum distance of hyperplane to the nearest samples from both sets as by Han and Kamber(Reference Han and Kamber14). The KNN classifier is a non-parametric lazy learning algorithm. A data sample in KNN is classified on the basis of a selected number of k nearest neighbours as described by Han and Kamber.
The automatic and smart analysis of the complex structure of high-volume data in the aviation industry has been studied by Gürbüz et al(Reference Gürbüz, Özbakir and Yapici11). A predictive model to explain the development of a dispatch reliability prediction method for passenger aircraft was proposed by Bineid and Fielding(Reference Bineid and Fielding6). Nazeri and Zhang(Reference Nazeri and Zhang22) have described the application of data mining to analysing severe weather impacts on National Airspace System (NAS). A model that allows investigation of non-linear effects of aviation safety factors and flexible assessment of aviation risk has been described in the literature(Reference Shyur26). The main goal of this work is to develop a model to provide relative risk probability inference and trend analysis among different kind of human errors which may cause any major aviation events. A data mining analysis method that can be applied to evaluate that monitor red-light-signal controlled intersections to improve traffic safety by reducing fatalities has been demonstrated by Solomon et al(Reference Solomon, Nguyen, Liebowitz and Agresti27).
Considering the high level of interaction between a service provider and its customers, the significance of a marketing approach cannot be overstated(Reference Appiah-Adu, Fyall and Singh4). Over the past few decades, considerable attention has been focused on cultivating a market-driven approach, which fosters the effective implementation of the marketing concept as an important source of competitive advantage in the tourism industry. Nazeri and Zhang(Reference Nazeri and Zhang22) have defined data mining methods that have been successfully introduced in many fields. It is still a research topic, but of tremendous interest to the industry in order to solve its real-world problems. Statistics, artificial intelligence techniques, decision tree approaches, genetic algorithms and visualization techniques are the major data mining techniques used to solve these problems. Risk and safety have always been important considerations in aviation. With the rapid growth in air travel, flight delays, cancellations and incidents or accidents have also dramatically increased in recent years.
Aviation accidents may result in human injury or even death. An airline company collects several case reports including structural and textual data. Institutions make important investments in order to collect such information from several sources. Nowadays, analysis of such data cannot be done automatically, and analysts have difficulties in dealing with the growing data efficiently and on time. In conclusion, in the automatic and smart analysis of the complex structure of high-volume data in aviation industry tools with capable instruments are needed.
Data mining is a potentially useful instruments that was not known before, and using this instrument to reveal information hidden in the data was proposed by Jiawei and Kamber(Reference Jiawei and Kamber16). As a result, there is a large amount of knowledge and data accumulation in the aviation industry. These data could be stored in the form of pilot reports, maintenance reports, incident reports, component reports or delay reports. Also in the aviation industry, data mining applications have been used.
Bineid and Fielding(Reference Bineid and Fielding6) have used data mining techniques to explain the development of a dispatch reliability prediction method for passenger aircraft. The U.S. Mine Safety and Health Administration (MSHA) developed a mine accident database from Part 50 of the federal mine safety regulations. This database has been used to track the numbers, rates and severity of mine accidents in the United States. Epidemiologists and mine safety researchers still use it to perform many analyses and help guide research, and best practices have been studied by Dessureault et al(Reference Dessureault, Sinuhaji and Coleman8).
Dessureault et al have explored the background of the Part 50 database, given a general background of data warehousing and data mining, and presented some of the interesting analyses that resulted from a modernized Part 50 data warehouse using data mining. A subset of data gathered from the Flight Safety Management Information Systems (FSMIS) developed by the office of the Taiwan Civil Aeronautics Administration takes aviation risk factors into account. Using the models presented, risk has been assessed as the probability of occurrence of a specific type of human error related to an aviation accident. The potential human-error-related risk could be identified and monitored in a timely fashion. The results can provide better information to the civil aviation communities to manage aviation safety risk so corrective action can be taken to reduce the occurrence of aviation accidents. It also allows identification of the fundamental causes of human-error-related accidents through the analysis of operational safety data. Finally, the results of the case study demonstrate that the proposed model is a more promising regression model with the potential of becoming very useful in practice as described by Shyur(Reference Shyur26).
This work represented several data modelling techniques such as decision trees, neural networks, market-basket analysis and K-means models. Decision trees build rule sets that can affect future decision making. Neural networks try to predict future outcomes by looking at the effects of historical inputs. Market-basket analysis shows the strength of the relationships between variables. K-means models weigh the impact of homogenous clusters on target variables. All of these models are demonstrated using real data gathered by the U.S. Department of Transportation from fatal accidents at red-light-signal controlled intersections in Maryland and Washington, DC, from 2000–2003 by Solomon et al(Reference Solomon, Nguyen, Liebowitz and Agresti27).
3.0 PROPOSED METHOD
Data mining is a process of discovering various models, summaries and derived values from a given collection of large-scale aircraft accident data. It is important to realize that the problem of discovering or estimating dependencies from data or discovering totally new data is only one part of the general experimental procedure used by scientists, engineers and others who apply standard steps to draw conclusions from large-scale aircraft data. The general experimental procedure adapted to data mining problems involves the following steps.
-
1. Statement of the problem
-
2. Collection of aircraft accident data
-
3. Pre-processing of aircraft accident data
-
4. Estimate of the model (tenfold cross-validation model)
-
5. Interpretation of the model and formulation of conclusions
Steps 3 and 4 in the data mining process have to be understood just as two steps in a more complex process. All phases separately and the entire data mining process as a whole are highly iterative, as is shown in Fig. 1. A good understanding of the whole process is important for any successful application. No matter how powerful the data mining method used in Step 4 is, the resulting model will not be valid if the data are not collected and pre-processed correctly, or if the problem formulation is not meaningful. In general, feature selection works by calculating a score for each attribute and then selecting only the attributes that have the best scores. We can also adjust the threshold for the top scores. Analysis services provide multiple methods for calculating these scores, and the exact method that is applied in any model depends on these factors: (1) the algorithm used in one's model, (2) the data type of the attribute, and (3) any parameters one has set on the model.
The data mining process.

Feature selection is applied to inputs, predictable attributes or states in a column. When scoring for feature selection is complete, only the attributes and states that the algorithm selects are included in the model-building process and thus can be used for prediction. If one chooses a predictable attribute that does not meet the threshold for feature selection, the attribute can still be used for prediction, but the predictions will be based solely on the global statistics that exist in the model.
A feature selection algorithm can be seen as the combination of a search technique for proposing new feature subsets along with an evaluation measure which scores the different feature subsets. The simplest algorithm is to test each possible subset of features and finding the one which minimizes the error rate. A typical feature selection process consists of four basic steps shown in Fig. 2: subset generation, subset evaluation, stopping criterion and result validation.
Four key steps of feature selection.

Decision tree induction is a very popular and practical approach for pattern classification. A decision tree is constructed generally in a greedy, top-down recursive manner. The tree can be constructed in a breadth-first manner or depth-first manner. A decision tree structure consists of a root node, internal nodes and leaf nodes. The classification rules are derived from the decision tree in the form of if/then/else. These rules are used to classify the records with unknown value for class label. the decision tree is constructed in two phases: the building phase and the pruning phase.
In the building phase of the tree, the best attributes are selected based on attribute selection measures such as information gain, gain ratio, Gini Index, etc. Once the best attribute is selected, the tree is constructed with that as the root node and the distinct values of the attribute are denoted as branches. The process of selecting the best attribute and representing the distinct values as branches is repeated until all the instances in the training set belong to the same class label.
In the pruning phase, the sub-trees are eliminated which may over fit the aircraft accident dataset. This enhances the accuracy of a classification tree. Decision trees handle continuous and discrete attributes. Decision trees are widely used because they provide human readable rules and are easy to understand. Construction of decision trees is fast and yields better accuracy. There are several algorithms to classify data using decision trees.
J48 s are the improved versions of C4.5 algorithms. or they can be called an optimized implementation of the C4.5 s. The output of J48 is the decision tree. A decision tree is similar to a tree structure with a root node, intermediate nodes and leaf nodes. Each node in the tree consists of a decision that leads to a result. Decision trees divide the input space of a dataset into mutually exclusive areas, with each area having a label, value or action to describe its data points. A splitting criterion is used to calculate which attribute is the best for splitting that portion tree of the training data that reaches a particular node. Figure 3 shows the decision tree model using J48 for an aircraft dataset, whether there was incident or not. In this model, R means Risk Factor and S means Safety for decision tree formed by using the accident attribute of the aircraft dataset.
The decision tree model for an aircraft accident dataset.

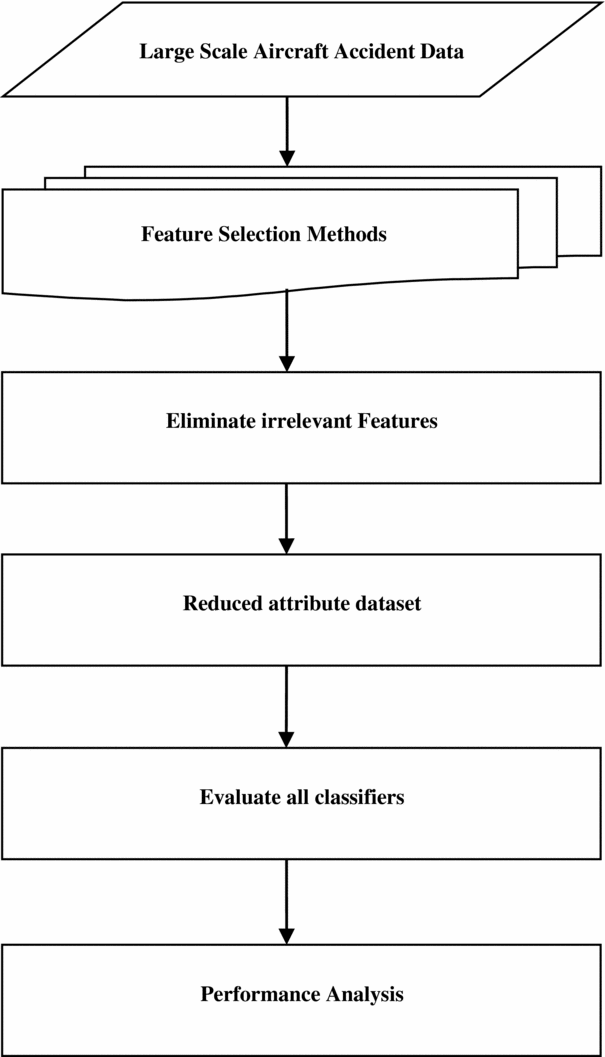
We applied different classification algorithms for aircraft dataset such as DT, NB, SVM, KNN and NN. First we applied these algorithms for entire dataset. The aircraft Attribute Relation File Format (ARFF) will contain a large quantity of data, and applying classification algorithms to this dataset is time-consuming and also gives less accurate results. Hence we have to reduce the number of initial attributes by using different feature attribute selection methods. After the eliminating irrelevant attributes (A1, A2, A3, . . ., An) and reduced attributes set (A1, A2, A3, . . ., An) is fed into the five classifications algorithm and which algorithm is best accuracy for this prediction is investigated. Likewise, all other attribute selection and classification algorithms are applied for the aircraft dataset. From that, we concluded that classification accuracy after applying feature selection attribute methods is significantly improved in this model. The Feature Selection Classification (FSC) algorithm is summarized in Fig. 4. The main steps of the proposed FSC algorithm are outlined as follows.
-
Step 1: Give a new aircraft dataset as input.
-
Step 2: Apply feature selection methods to initial data.
-
Step 3: Eliminate irrelevant feature attributes.
-
Step 4: Reduce attributes of the set after elimination.
-
Step 5: Evaluate the classifier's performance.
-
Step 6: Update the class value found as “risk” or “safety” in the original training data.
-
Step 7: Remove conflicting and redundant data.
-
Step 8: Analyse the data using various classification algorithms.
Basic algorithm for prediction (FSC) from training samples.

This model is proposed for improving classification accuracy by combining the prediction of multiple classifiers. The different data mining classifiers such as Bayes, functions, lazy, MISC, rules and decision trees are used for classification. This model uses tenfold cross-validation as a test method. The classification models are evaluated using different performance metrics. A comparative study is carried out on the performances of the different classifiers and after carrying out different feature selection techniques the classifiers accuracy significantly improved. The performance of each features selection methods and classifiers model is evaluated by using statistical measures like accuracy, specificity and sensitivity. We proposed a different feature selection method in this model. The number of features obtained in the dataset is very large. We have applied the number of different techniques: CFS subset evaluator, consistency subset evaluator, gain ratio feature evaluator, information gain attribute evaluator, OneR attribute evaluator, principal components attribute transformer, ReliefF attribute evaluator and symmetrical uncertainty attribute evaluator.
This model found that the feature selection method attribute reduces a greater number of redundant and irrelevant attributes, thereby increasing the performance of classification methods. Figure 5 displays the block diagram for prediction (FSC) model of training samples. In this diagram, we can eliminate irrelevant features and evaluate all classifiers, thereby increasing the performance of classification accuracy and the efficiency of this model. All classifier techniques and different feature selection methods are applied in this model for large-scale dataset analysis.
Block diagram for prediction (FSC) model.

4.0 EXPERIMENTAL RESULTS AND DISCUSSION
The main contribution here is the study of the classification performance in terms of accuracy with different feature selection methods. A comparison of different classifiers based on the performance metrics (TP rate, FP rate, precision, recall, F-measure, kappa statistic, means absolute error and root mean squared error) on reduced features by different feature selection methods also found that the results are reliable.
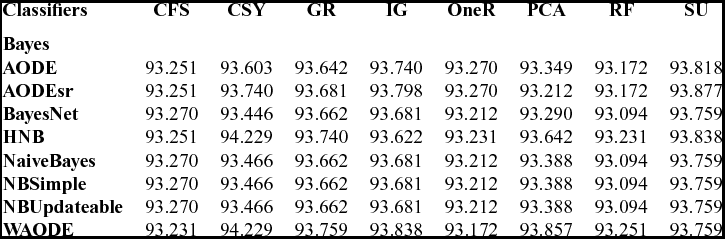
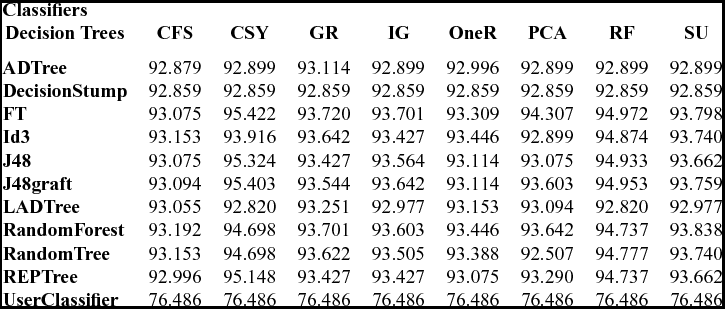
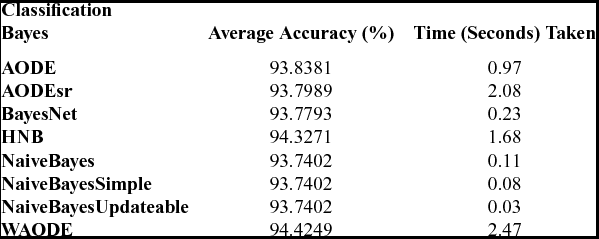
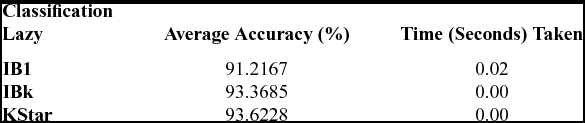
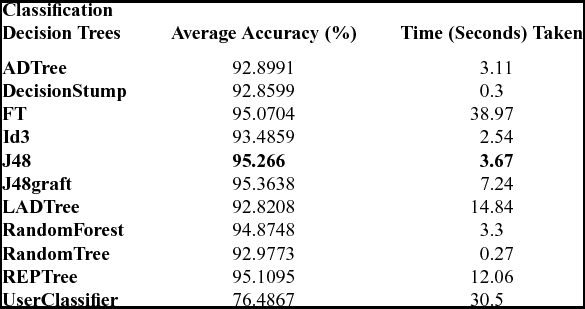
Table 1 shows the performance of different Bayes classifiers such as Aode, Aodesr, BayesNet, HNB, naïve Bayes, naïve Bayes simple and naïve Bayes updatable on an aviation large-scale dataset. Table 2 shows the performance of different function classifiers with different feature selection methods. Table 3 shows the performance different lazy classifiers with different feature selection methods. Table 4 shows the performance of different MISC classifiers with different feature selection methods. Table 5 shows the performance different rules classifiers with different feature selection methods. Table 6 shows the performance different decision tree classifiers with different feature selection methods.
Performance of different Bayes classifiers on reduced features by different feature selectors

Performance of different function classifiers on reduced features by different feature selectors

Performance of different lazy classifiers on reduced features by different feature selectors

Performance of different MISC classifiers on reduced features by different feature selectors

Performance of different rules classifiers on reduced features by different feature selectors

Performance of different decision tree classifiers on reduced features by different feature selectors

Performance of different Bayes classifiers on an aviation accident large-scale dataset

Performance of different function classifiers on aviation accident large-scale dataset

Performance of different lazy classifiers on an aviation accident large-scale dataset

Performance of different MISC classifiers on an aviation accident large-scale dataset

Performance of different rules classifiers on an aviation accident large-scale dataset

Performance of different decision tree classifiers on an aviation accident large-scale dataset

The performance comparison of different Bayes classifiers, functions classifiers, lazy classifiers, MISC classifiers, rules classifiers and decision tree classifiers are shown in Tables 7–12, respectively.
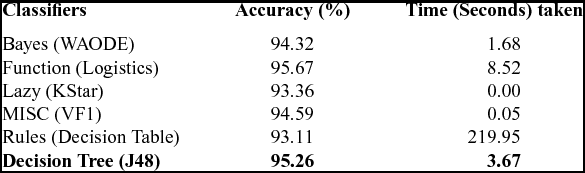
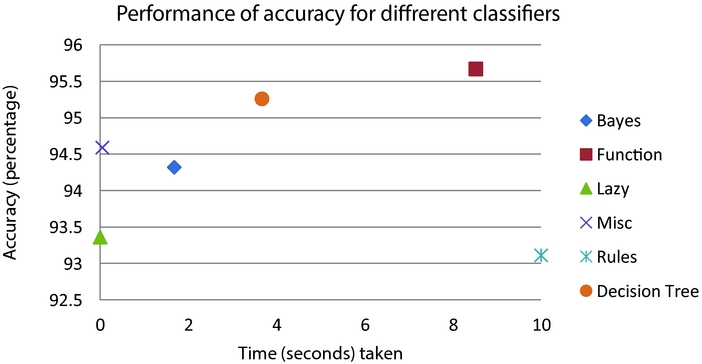
Table 13 shows the performance of accuracy with minimum time (in seconds) taken for different classifiers on an aviation accident large-scale dataset. Decision Tree (J48) will be considered in this large-scale aviation dataset with high accuracy and minimum time (seconds) taken. In this table, both function (logistics) and decision tree (J48) classifiers have accuracy greater than 95%, but function classifiers will take a longer time to execute. Thus, we find that the decision tree classifier will perform better than other classifiers on an aircraft accident dataset with an accuracy of 95.266% with a minimum of time taken. The decision tree classifier accuracy and efficiency of the performance will therefore be increased. Figure 6 displays the accuracy of different classifiers on an aviation large-scale dataset. The decision tree classifier is better than other classifiers because of its high accuracy and minimum time required for execution.
Performance of accuracy for different classifiers on an aviation accident large-scale dataset

Performance of accuracy with minimum time execution for different classifiers on an aviation large-scale dataset.

5.0 CONCLUSIONS
In this study, we have explored the use of different feature selection methods and classification techniques on aviation accident large-scale datasets. We have studied the performance of different feature selection methods and classification algorithms. The main contribution of this study is to evaluate the performance of different feature selection methods such as information gain, gain ratio, symmetrical uncertainty, ReliefF and OneR attribute evaluation on aviation component data. We found that the different feature selection methods reduce more redundant and irrelevant attributes and thereby improve the performance of classifiers. We found that the decision tree classifier proved to be better than other classification techniques by having better classification accuracy and lower misclassification rates. The proposed work is used to predict a component's warning level in aircraft accidents. The rules that were found by this analysis will be helpful for experts in the aviation industry to provide safety recommendations to airline companies.
ACKNOWLEDGEMENT
The authors wish to acknowledge the anonymous reviewers for their kind suggestions and comments for improving this paper.