Introduction
Substantial within-person changes in risk for emotional eating (e.g. overeating in response to negative emotions) and binge eating have been observed across the menstrual cycle. Studies revealed peaks in both behaviors during post-ovulation (particularly the mid-luteal phase) (Lester et al. Reference Lester, Keel and Lipson2003; Edler et al. Reference Edler, Lipson and Keel2007; Klump et al. Reference Klump, Keel, Culbert and Edler2008, Reference Klump, Keel, Racine, Burt, Neale, Sisk, Boker and Hu2013b ) that are driven by higher levels of both estradiol and progesterone (Edler et al. Reference Edler, Lipson and Keel2007; Klump et al. Reference Klump, Keel, Culbert and Edler2008, Reference Klump, Keel, Racine, Burt, Neale, Sisk, Boker and Hu2013b ). These hormone/emotional/binge eating associations are independent of body mass index (BMI) (Edler et al. Reference Edler, Lipson and Keel2007; Klump et al. Reference Klump, Keel, Culbert and Edler2008, Reference Klump, Keel, Burt, Racine, Neale, Sisk and Boker2013a , Reference Klump, Keel, Racine, Burt, Neale, Sisk, Boker and Hu b ), negative affect (Edler et al. Reference Edler, Lipson and Keel2007; Klump et al. Reference Klump, Keel, Culbert and Edler2008, Reference Klump, Keel, Burt, Racine, Neale, Sisk and Boker2013a , Reference Klump, Keel, Racine, Burt, Neale, Sisk, Boker and Hu b ; Racine et al. Reference Racine, Keel, Burt, Sisk, Neale, Boker and Klump2013), dietary restraint (Klump et al. Reference Klump, Keel, Burt, Racine, Neale, Sisk and Boker2013a ), weight concerns (Hildebrandt et al. Reference Hildebrandt, Racine, Keel, Burt, Neale, Boker, Sisk and Klump2014) and impulsive traits (Racine et al. Reference Racine, Culbert, Larson and Klump2009), and they have been observed in community samples (Edler et al. Reference Edler, Lipson and Keel2007; Klump et al. Reference Klump, Keel, Culbert and Edler2008, Reference Klump, Keel, Racine, Burt, Neale, Sisk, Boker and Hu2013b ) and women with clinical binge eating (Edler et al. Reference Edler, Lipson and Keel2007; Klump et al. Reference Klump, Racine, Hildebrandt, Burt, Neale, Sisk, Boker and Keel2014).
However, to date, nothing is known about the mechanisms driving these associations and changes in risk. One mechanism that has been proposed (Klump et al. Reference Klump, Keel, Racine, Burt, Neale, Sisk, Boker and Hu2013b , Reference Klump, Racine, Hildebrandt, Burt, Neale, Sisk, Boker and Keel2014) is changes in genetic risk. Menstrual cycle changes in ovarian hormones have been proposed to lead to changes in gene expression that translate into differential phenotypic risk for emotional eating and binge eating across the cycle. The known function of ovarian hormones within the central nervous system (CNS) (i.e. to regulate gene transcription via nuclear receptors) has served as the foundation for this hypothesis, as: (1) ovarian hormones regulate neural systems that are disrupted in eating disorders (e.g. the serotonin system; Becker, Reference Becker1999; Ostlund et al. Reference Ostlund, Keller and Hurd2003; Hildebrandt et al. Reference Hildebrandt, Alfano, Tricamo and Pfaff2010); and (2) changes in gene expression drive ovarian hormone-induced changes in food intake (i.e. decreased intake with higher estradiol levels; increased intake when both estradiol and progesterone are high) in a variety of species. Interestingly, these changes in gene expression have been shown to occur within 1–2 days in rodents (Graves et al. Reference Graves, Hayes, Fan and Curtis2011) and probably account for changes in food intake across the rat estrous cycle (Asarian & Geary, Reference Asarian and Geary2013). Emerging data suggest that ovarian hormones can induce gene expression changes in human (non-brain) tissue in 1–10 days (Logan et al. Reference Logan, Ponnampalam, Steiner and Mitchell2012).
Nonetheless, no study has investigated whether changes in gene expression underlie ovarian hormone/emotional eating/binge eating associations across the menstrual cycle. The absence of such data is probably due to difficulties measuring gene expression in human brain tissue and the lack of identified risk genes for binge eating (Scherag et al. Reference Scherag, Hebebrand and Hinney2010; Wade et al. Reference Wade, Gordon, Medland, Bulik, Heath, Montgomery and Martin2013). One indirect method for examining changes in gene expression and changes in emotional eating/binge eating is to investigate changes in heritability across the menstrual cycle. Because changes in heritability reflect changes in the influence of genetic factors, this approach allows for a straightforward way to rule in (or out) changes in genetic risk (and potentially gene expression) for binge phenotypes before embarking on more expensive and invasive procedures for directly indexing gene expression. In addition, changes in heritability index genetic risk at the latent, aggregate level, and thus, analyses are not contingent upon selection of a particular candidate gene(s) or system for analysis. Finally, menstrual cycle phases are coded based on estrogen and progesterone profiles (e.g. high estradiol and low progesterone during pre-ovulation; high levels of both hormones following ovulation); consequently, changes in genetic risk across the cycle probably reflect changing profiles of hormones and their effects on emotional eating.
Given the above, the aim of the current study was to examine within-person changes in the heritability of emotional eating in a community-based sample of female twins using daily measures of emotional eating and ovarian hormones across the menstrual cycle. We focused on emotional eating rather than binge eating due to the small number of twins (n = 33) with clinical binge eating. However, past data suggest that the phenotypic effects of ovarian hormones are similar across community and clinical samples, and that the pattern of hormone effects is identical for emotional eating scores and clinically diagnosed binge eating (Edler et al. Reference Edler, Lipson and Keel2007; Klump et al. Reference Klump, Keel, Culbert and Edler2008, Reference Klump, Keel, Racine, Burt, Neale, Sisk, Boker and Hu2013b , Reference Klump, Racine, Hildebrandt, Burt, Neale, Sisk, Boker and Keel2014). Thus, although we cannot say for certain that changes in heritability for emotional eating reflect changes for binge eating, our study provides an important first step in identifying shifts in genetic risk for binge-related phenotypes that can be examined more fully in clinical populations.
Method
Participants
Participants were 230 [138 monozygotic (MZ), 92 dizygotic (DZ)] same-sex female twin pairs aged 16–25 years (mean = 17.74, s.d. = 1.83 years) who participated in the Twin Study of Hormones and Behavior across the Menstrual Cycle (HBMC) project (Klump et al. Reference Klump, Keel, Racine, Burt, Neale, Sisk, Boker and Hu2013b ) within the Michigan State University Twin Registry (MSUTR; for MSUTR details, see Klump & Burt, Reference Klump and Burt2006; Burt & Klump, Reference Burt and Klump2013). The primary aim of the HBMC is to examine phenotypic and genetic associations between changes in ovarian hormones and changes in binge eating across the menstrual cycle. Study inclusion/exclusion criteria were: (1) menstruation every 22–32 days for the past 6 months; (2) no hormonal contraceptive use within the past 3 months; (3) no psychotropic or steroid medications within the past 4 weeks; (4) no pregnancy/lactation within the past 6 months; and (5) no genetic or medical conditions known to influence hormones or appetite/weight. Despite these criteria, the HBMC twins are representative of the recruitment region (79.5% white, 14.3% black, 0.6% Asian, 0.3% native American, 5.3% more than one race, 7.8% Hispanic), and they do not differ from other MSUTR twins on measures of emotional eating, binge eating or other symptoms (e.g. weight preoccupation) (average d = 0.12).
The current study included a subsample of the HBMC twins with daily emotional eating data for one menstrual cycle (n = 460 twins, 230 pairs; 78% of the HBMC sample; n = 585). We excluded 84 pairs in which one or both co-twins had missing emotional eating scores or menstrual cycle phase data (15/84 pairs; 18%), and pairs in which at least one co-twin was anovulatory (69/84; 82% of those excluded). Although some of our analyses (e.g. twin models) could account for missing data in one co-twin, other analyses could not (e.g. twin correlations). To ensure that all results included the same pairs, we focused on pairs that had full data for both co-twins. Notably, results were identical when we included incomplete pairs in the models (data not shown), and our final sample was highly representative of the larger HBMC group in terms of racial/ethnic diversity (83.9% white, 10.9% black, 0.4% Asian, 0.4% native American, 4.3% more than one race, 7.4% Hispanic). Twins from complete pairs also did not significantly differ from those from incomplete pairs in emotional eating or other disordered eating characteristics (e.g. weight preoccupation; average d = 0.12).
Procedures
Participants collected data for 45 consecutive days. Ratings of emotional eating were made each evening after 17.00 hours. Participants completed three in-person visits: one at the start of data collection, one mid-way through (about day 23) and one at the end (about day 45). Each visit included a reassessment of eligibility and collection of samples. Staff also contacted participants once per week to answer questions and confirm adherence. These procedures were effective for minimizing drop-outs (7%) and identifying twins who were no longer eligible (3%).
Measures
Emotional eating
We used the emotional eating scale of the Dutch Eating Behavior Questionnaire (DEBQ) (Van Strien et al. Reference Van Strien, Frijters, Bergers and Defares1986) to assess eating in response to negative emotions (e.g. ‘Did you have a desire to eat when you were depressed?’) on a five-point scale (i.e. ‘not at all’ to ‘very often’). Eating in response to negative emotions is a core feature of binge eating (McManus & Waller, Reference McManus and Waller1995), and the emotional eating scale has demonstrated validity in differentiating between individuals who binge eat versus those who are overweight versus college students (Wardle, Reference Wardle1987; Deaver et al. Reference Deaver, Miltenberger, Symth, Meidinger and Crosby2003). Emotional eating scores correlate with established measures of binge eating (r's = 0.55–0.69) (Van Strien, Reference Van Strien2000; Racine et al. Reference Racine, Culbert, Larson and Klump2009) as well as with palatable food intake (i.e. ice cream) (Van Strien, Reference Van Strien2000) in adults as well as in adolescents (Lluch et al. Reference Lluch, Herbert, Mejean and Siest2000; Nguyen-Michel et al. Reference Nguyen-Michel, Unger and Spruijt-Metz2007; Snoek et al. Reference Snoek, van Strien, Janssens and Engels2007; van Strien et al. Reference Van Strien, Snoek, van der Zwaluw and Engles2010; Laghi et al. Reference Laghi, Pompili, Baumgartner and Baiocco2015). The instructions for the scale were modified with permission to ask about emotional eating over the current day (45-day average α = 0.90) (Klump et al. Reference Klump, Keel, Culbert and Edler2008).
Menstrual cycle phase
Participants recorded days of menstrual bleeding in a daily log book (see Lester et al. Reference Lester, Keel and Lipson2003). Participants provided daily saliva samples within 30 min of waking, using published methods (Klump et al. Reference Klump, Keel, Culbert and Edler2008, Reference Klump, Keel, Racine, Burt, Neale, Sisk, Boker and Hu2013b ). Saliva samples were assayed for estrogen and progesterone by Salimetrics, LLC (State College, PA) using enzyme immunoassays that show excellent intra- and inter-assay coefficients of variation (see Klump et al. Reference Klump, Keel, Racine, Burt, Neale, Sisk, Boker and Hu2013b ).
Menstrual cycle phase was coded by trained raters (see training procedures below) after aggregating each twin's cycle and hormone data into a single graph. The first day of bleeding served as the graph anchor, and phase days were coded based on this anchor, hormone levels and the overall length of each cycle. Raters began by examining hormone levels about 15 days prior to the anchor to find each twin's peak in estradiol and ovulatory phase. The day with the highest estradiol peak, as well as the days prior to and after, were coded as the ovulatory phase (about 3 days). The mid-luteal phase (about 7 days) was coded after ovulation based on a secondary peak in estradiol and rising (and then falling) progesterone levels. The premenstrual phase (about 4 days) was coded based on falling levels of both progesterone and estradiol. The follicular phase (about 10 days) was coded based on low progesterone levels and low (and then rising) levels of estradiol that occurred after menstruation but before ovulation.
All raters underwent extensive training, including review of coding rules and practice coding sessions. Each rater had to achieve an inter-rater reliability of ⩾ 0.80 with senior raters. All graphs were coded by two raters, and the codes were compared for consistency. Discrepancies were resolved via weekly meetings.
Statistical analyses
Emotional eating scores were averaged and log transformed (to account for positive skew) within each phase prior to analyses. We calculated twin intraclass correlations within phase to provide an initial indication of additive genetic influences (A; genetic influences that add across genes), shared environmental influences (C; environmental influences that are shared by twins and are a source of similarity) and non-shared environmental influences (E; environmental influences that are not shared by twins and are a source of dissimilarity, including measurement error) on emotional eating scores. We then fit biometric models to the raw data using the maximum likelihood option in Mx (Neale et al. Reference Neale, Boker, Xie and Maes2003). Comparisons of fit between different models were made by taking the difference in minus twice the log-likelihood (−2lnL) (for nested models) and by comparing Akaike's information criterion (AIC; Akaike, Reference Akaike1987) and the Bayesian information criterion (BIC) (Schwarz, Reference Schwarz1978). Large (statistically significant) differences in −2lnL values led to a rejection of the nested model in favor of the full model, and models with lower AIC and BIC values were preferred. Following previous recommendations (Purcell, Reference Purcell2002), we present standardized parameter estimates in tables and unstandardized estimates in figures.
Ethical standards
All procedures contributing to this work comply with the ethical standards of the relevant national and institutional committees on human experimentation and with the Helsinki Declaration of 1975, as revised in 2008.
Results
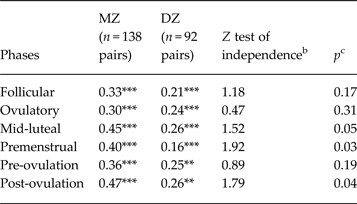
Twin correlations by phase are presented in Table 1. In all cases, the individual MZ and DZ twin correlations (see ‘MZ’ and ‘DZ’ columns) were statistically significant, suggesting that there is familial resemblance for emotional eating scores across all phases of the menstrual cycle.
Twin correlations for emotional eating scores by menstrual cycle phase a
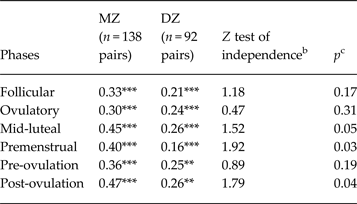
MZ, Monozygotic; DZ, dizygotic; Pre-ovulation, the follicular and ovulatory phases combined; Post-ovulation, the mid-luteal and premenstrual phases combined.
a Emotional eating scores were log transformed prior to analysis.
b The Z test of independence tests for significant differences between the MZ and DZ twin correlations.
c All p values are one-sided, as we would expect MZ twin correlations to be greater than DZ twin correlations.
Correlation is significantly different from zero: ** p < 0.01, *** p < 0.001.
Nonetheless, the magnitude of the difference between the MZ and DZ twin correlations varied across phase (see the Z test of independence and p values in Table 1). During the follicular and ovulatory phases, the MZ and DZ twin correlations were not significantly different from each other (i.e. p's = 0.17 and 0.31), suggesting that shared environmental influences play an important role in emotional eating during the follicular and ovulatory phases of the menstrual cycle. However, additive genetic and non-shared environmental influences were probably present as well, given that the MZ twin correlation was larger than the DZ correlation, and the MZ twin correlation was less than 1.00.
By contrast, in the mid-luteal and premenstrual phases, the MZ twin correlation was almost double the DZ twin correlation, and the correlation differences were statistically significant (p = 0.03) or of trend-level significance (p = 0.05). This pattern suggested genetic and non-shared environmental influences, with little evidence of shared environmental effects. Analyses examining pre-ovulation (follicular and ovulatory) and post-ovulation (mid-luteal and premenstrual) phase variables produced very similar results with significant differences in MZ/DZ twin correlations in post-ovulation only.
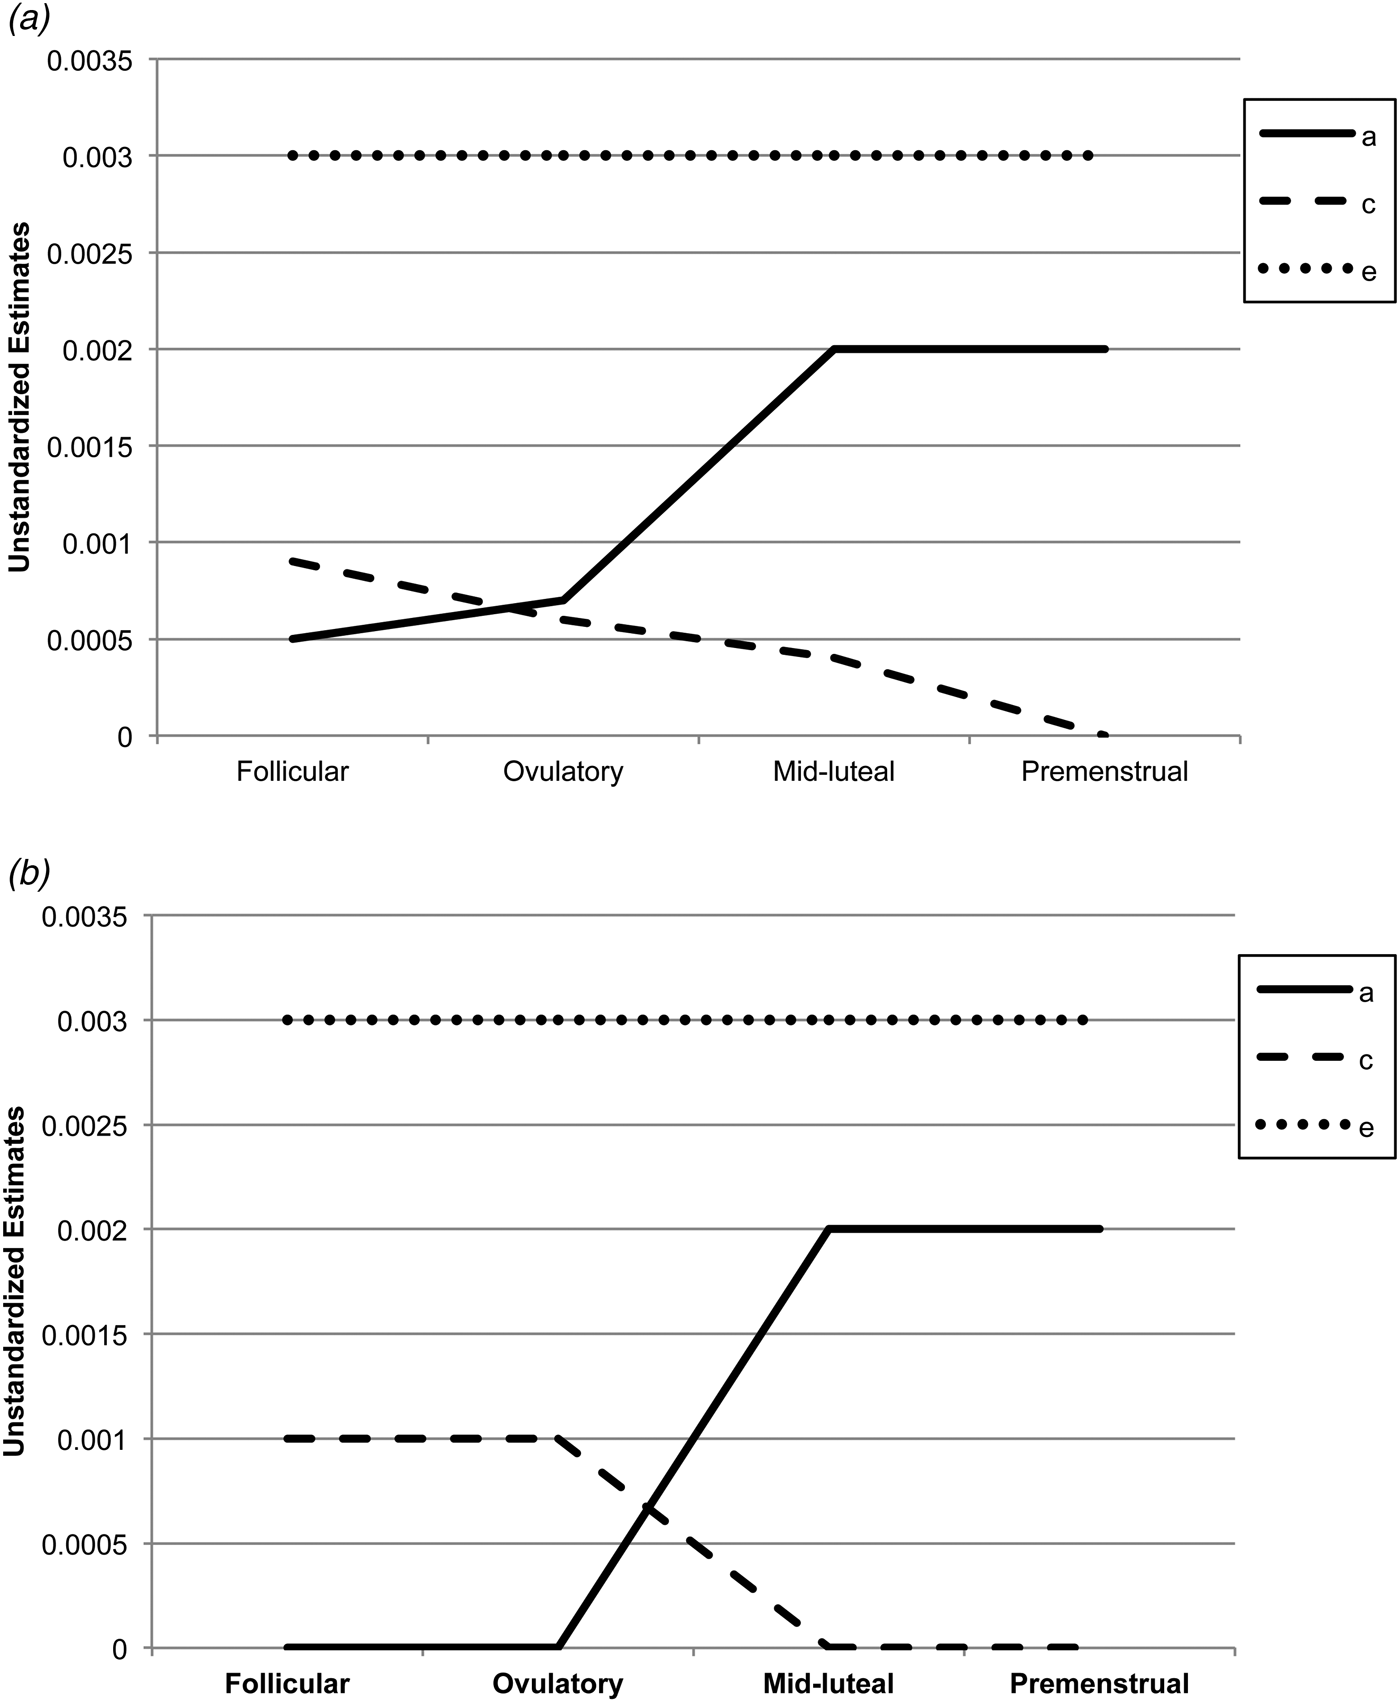
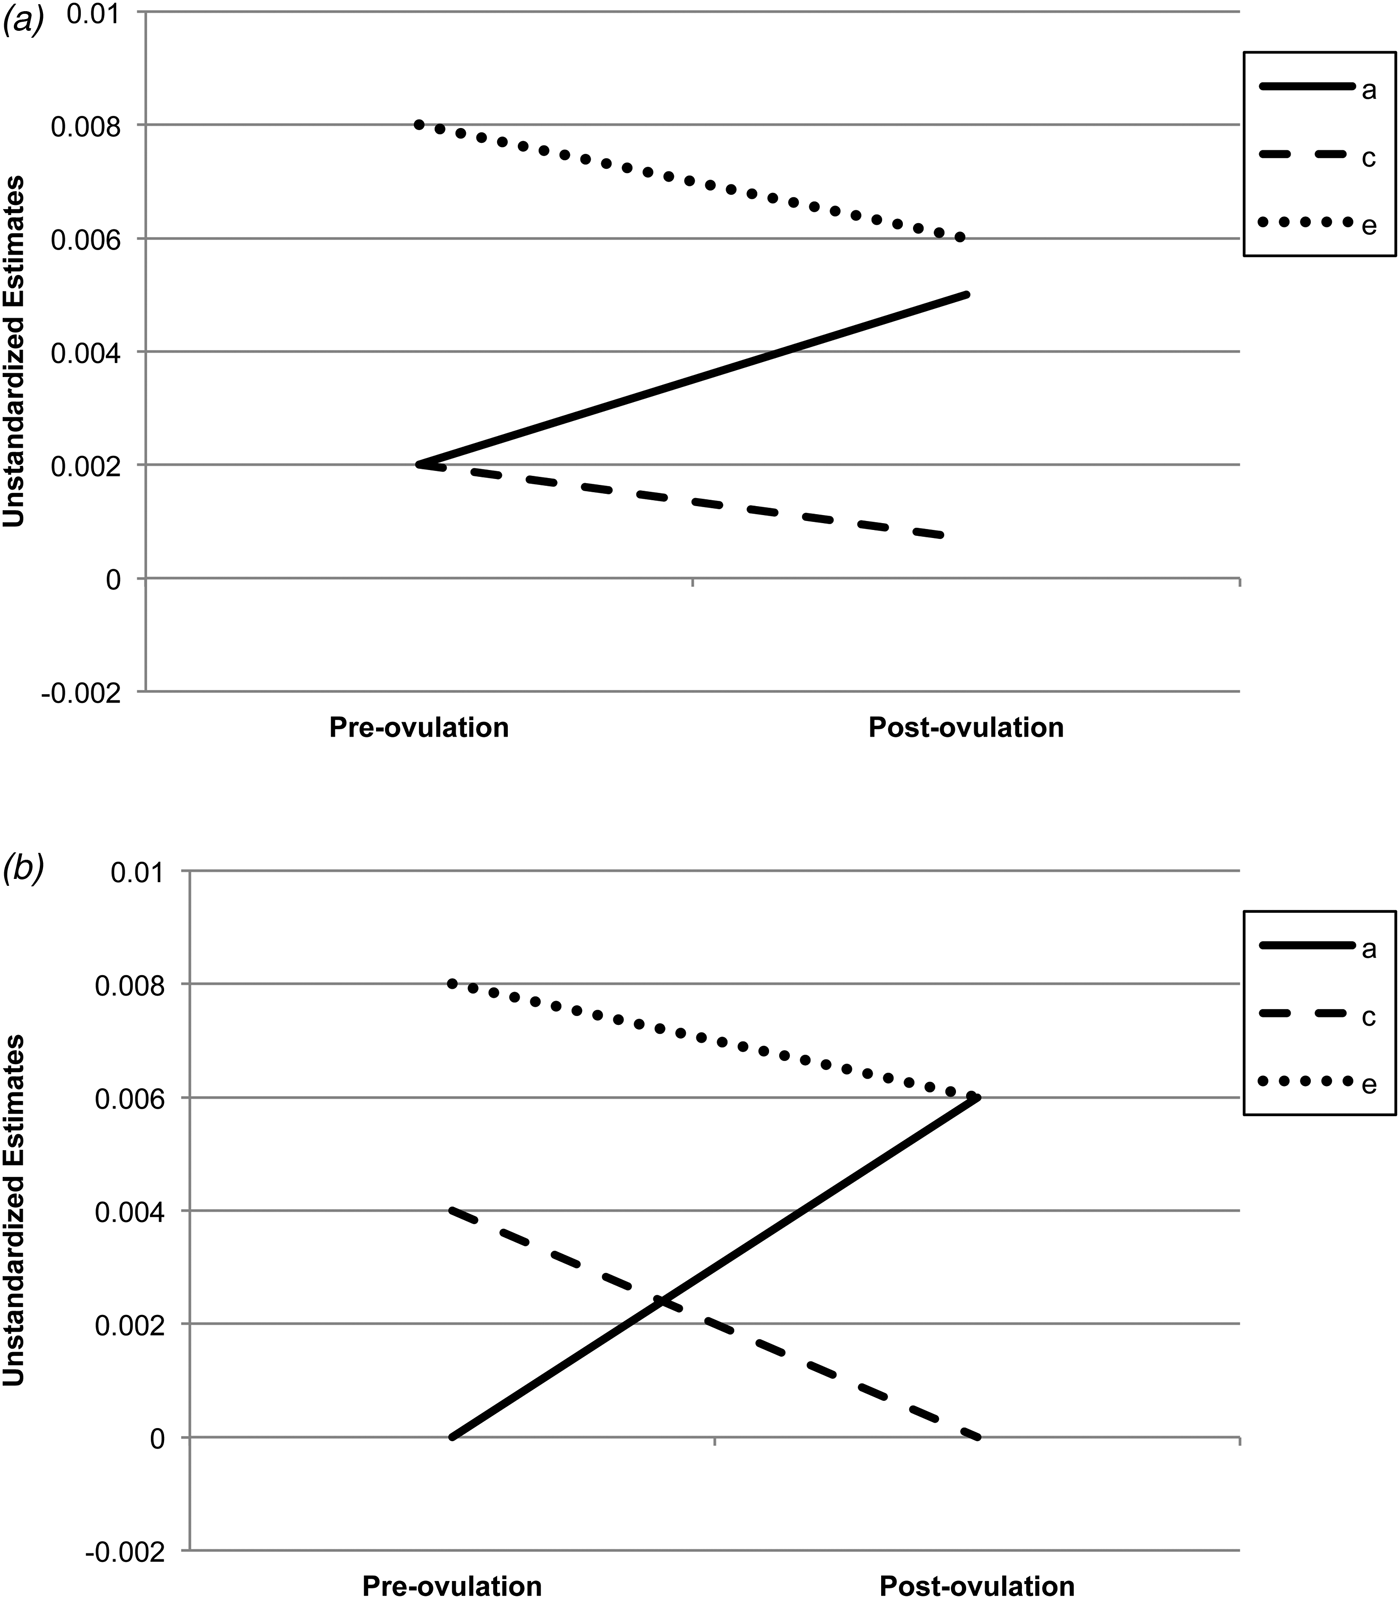
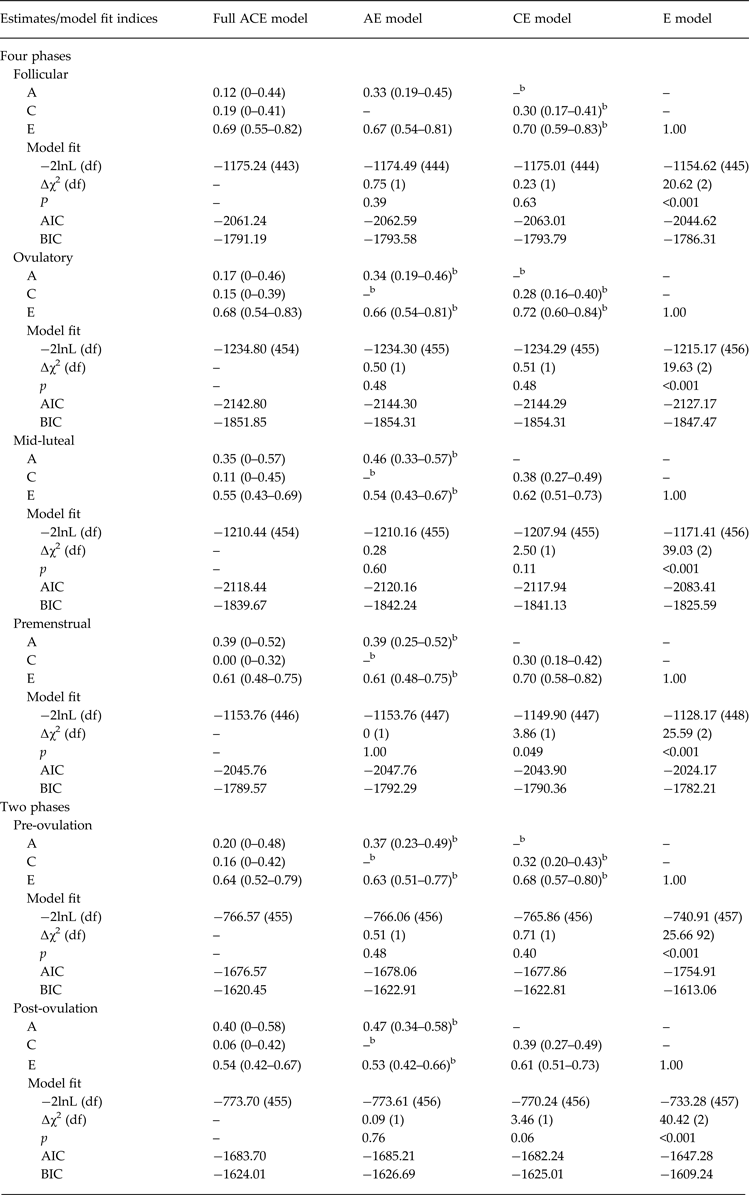
Biometric models confirmed these preliminary results. We initially fit the full model containing all three etiologic effects (i.e. A, C and E) and then compared this model with reduced models that contained A and C only, C and E only, or E. Standardized estimates from these models are presented in the A, C and E rows in Table 2, while the unstandardized estimates (i.e. a, c, e) are depicted in Figs 1 and 2 Footnote 1 Footnote †. For the full ACE models, there were strong non-shared environmental influences (61–69%) and more modest levels of additive genetic (12–20%) and shared environmental (15–19%) influences in the pre-ovulatory phases (i.e. follicular phase, ovulatory phase and combined pre-ovulation phase). By contrast, in the post-ovulatory phases (i.e. mid-luteal phase, premenstrual phase and combined post-ovulation phase), genetic influences were much more substantial (35–40%) and were much larger than the shared environmental contributions (0–11%). Perhaps not surprisingly, model fit comparisons showed that the best-fitting models during post-ovulation were the AE models that contained only additive genetic and non-shared environmental influences. These models had non-significant changes in −2lnL values and low AIC and BIC values. Overall, these models showed substantial additive genetic (39–47%) and non-shared environmental influences (53–61%) on emotional eating in the post-ovulatory phases.
Unstandardized parameter estimates from the (a) full ace models and (b) best-fitting models for the four phases separately. a, Additive genetic effects; c, shared environmental effects; e, non-shared environmental effects; full models, models with a, c and e. The best-fitting model for the mid-luteal and premenstrual phase was the ae model, while the ce model was best fitting for the follicular phase. Model-fitting results were equivocal for the ovulatory phase, with the ae and ce models showing equivalent fits. Because the ce model showed a slightly better fit for the other pre-ovulatory phases (i.e. the follicular phase and the combined pre-ovulation variable), we show the ce model for the ovulatory phase as well.
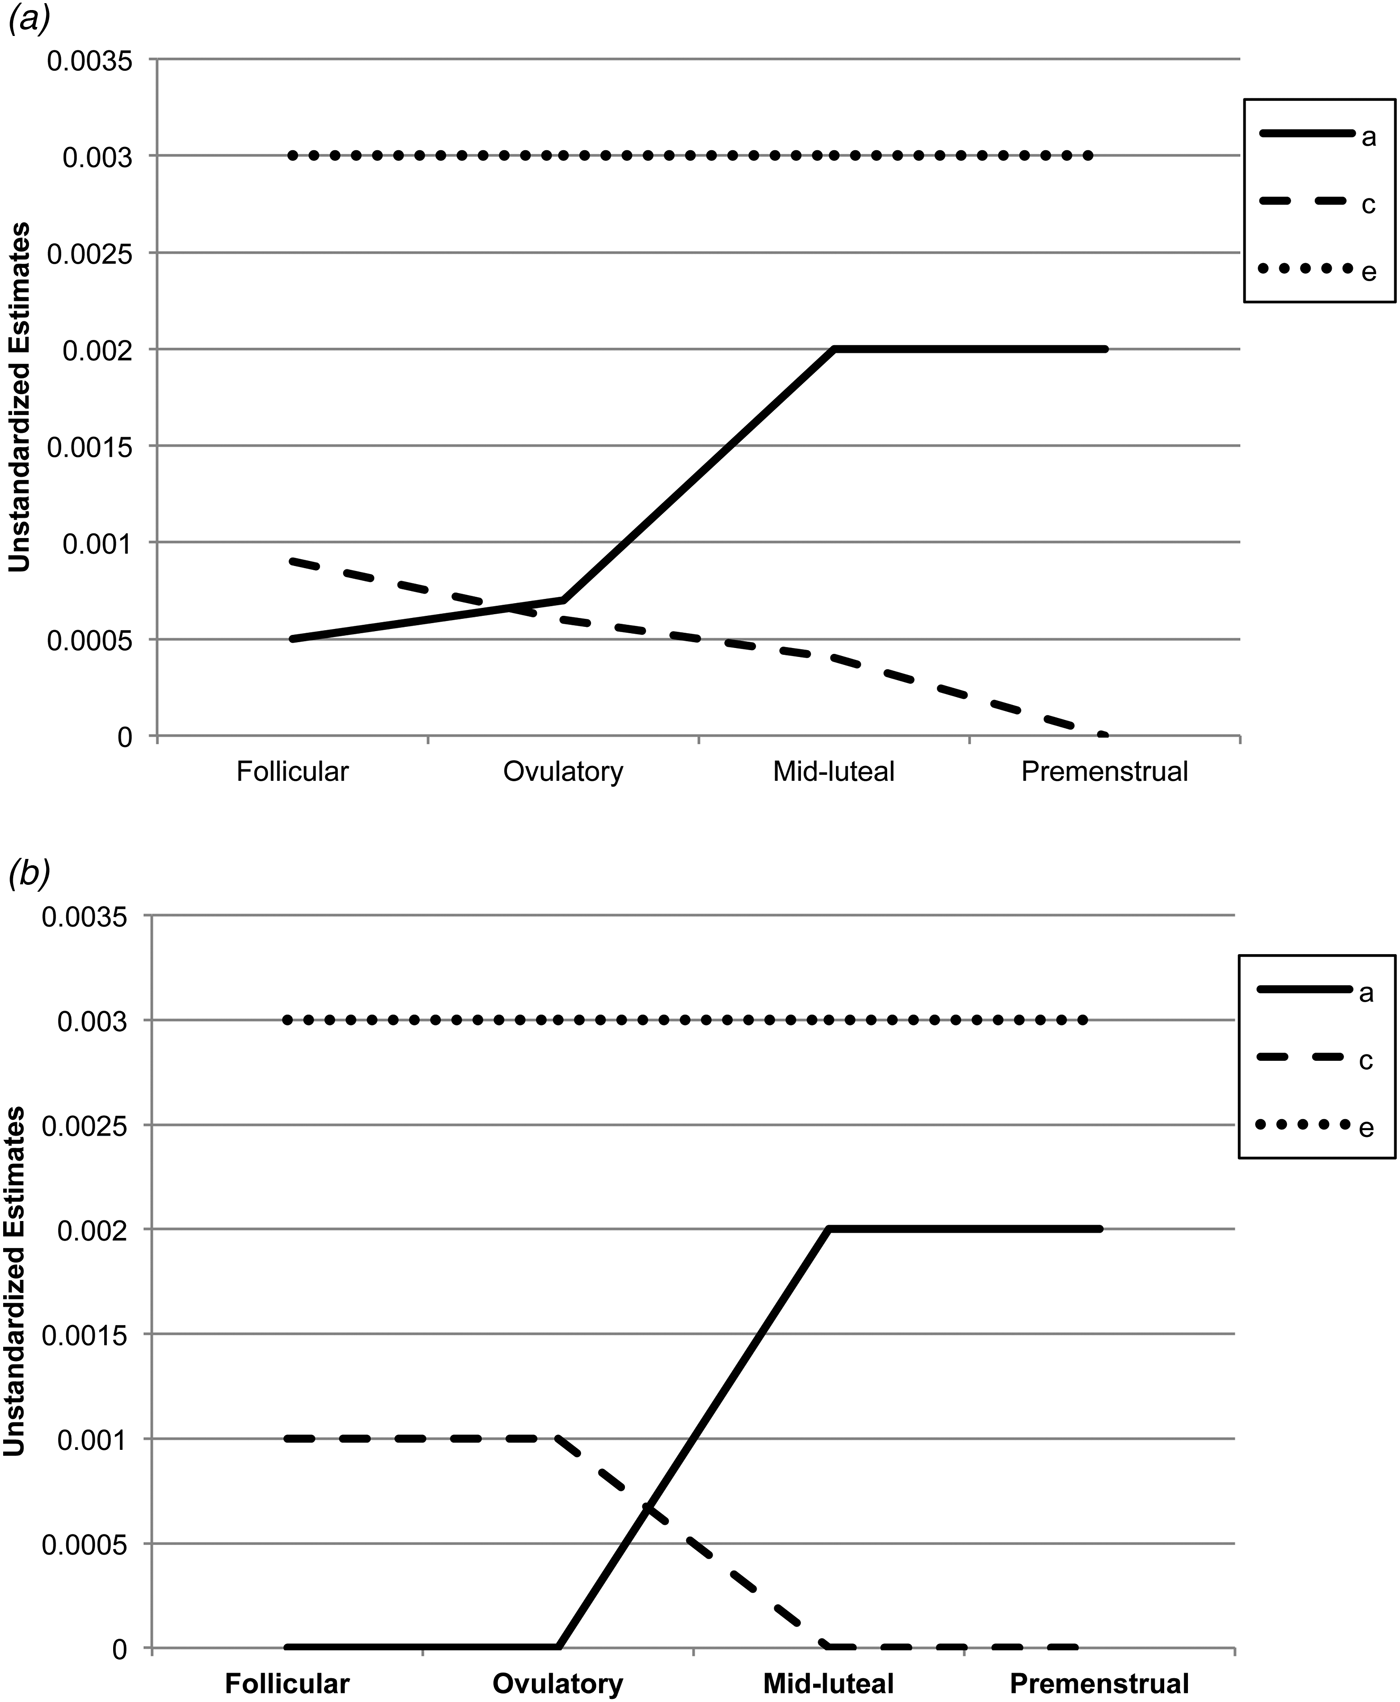
Unstandardized parameter estimates from the (a) full ace models and (b) best-fitting models for the pre-ovulation (i.e. follicular and ovulatory) versus post-ovulation (i.e. mid-luteal and premenstrual) phases. a, Additive genetic effects; c, shared environmental effects; e, non-shared environmental effects; full models, models with a, c and e. The best-fitting model for the pre-ovulation phase was the ce model, while the ae model was best fitting for post-ovulation.

Parameter estimates and model fit indices from the univariate models a
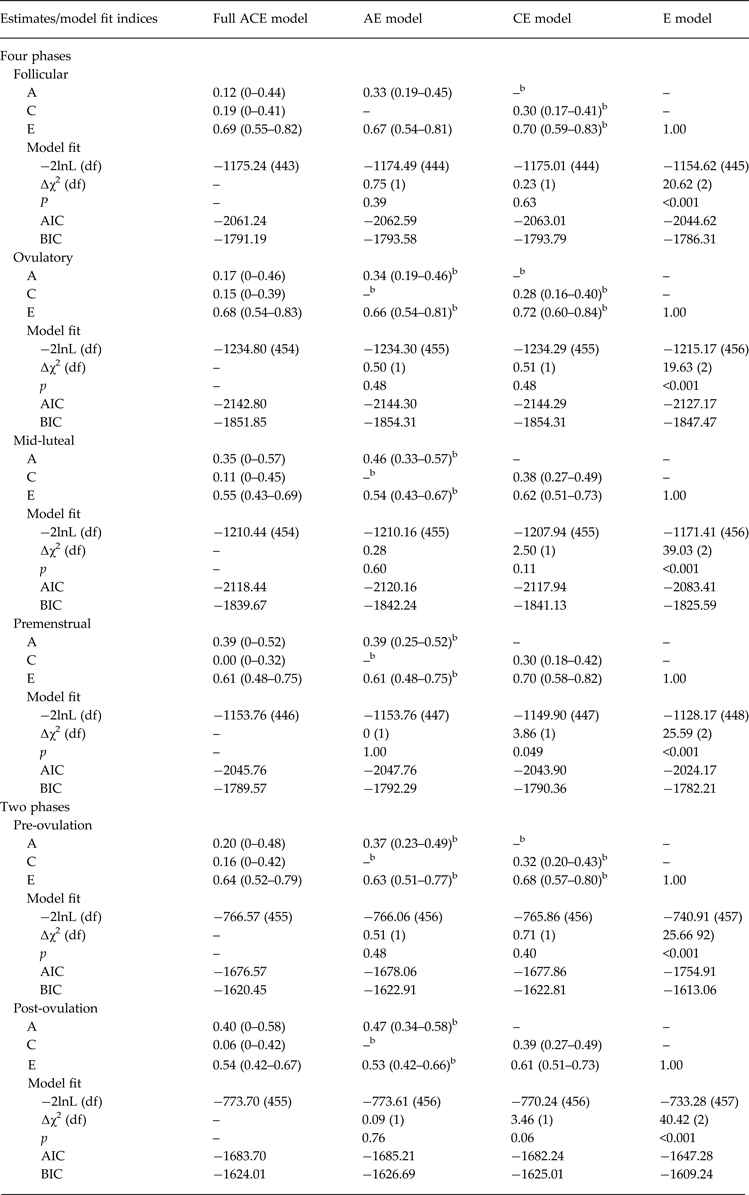
A, Additive genetic effects; C, shared environmental effects; E, non-shared environmental effects; −2lnL, minus twice the log-likelihood; df, degrees of freedom; ∆χ2, the difference in −2lnL values between the full model and the nested model, which is χ2 distributed under the null hypothesis implied by the reduced model; AIC, Akaike's information criterion; BIC, Bayesian information criterion; Pre-ovulation, the follicular and ovulatory phases combined; Post-ovulation, the mid-luteal and premenstrual phases combined.
a Emotional eating scores were log transformed prior to analysis.
b The best-fitting model(s).
Model comparisons for the pre-ovulatory phases were more complicated. In most cases, the AE and CE models provided equal fits to the data, with non-significant changes in −2lnL values and AIC/BIC values that were nearly identical (see Table 2). This situation often occurs when there are similar degrees of additive genetic and shared environmental influences (like we have here – see A, C and E estimates for the full ACE model in Table 2, and a, c and e unstandardized estimates in Figs 1a and 2a ). In these cases, very large sample sizes (in the thousands – see Martin et al. Reference Martin, Eaves, Kearsey and Davies1978) are needed to detect significant A and C parameters and/or to differentiate between the two. Although our sample of 230 pairs is quite large for a study of 45 days, it is insufficient for detecting significant A and C effects, and we therefore obtained equivocal evidence for the best-fitting model. In this case, the most conservative interpretation is that there is familial aggregation of emotional eating scores, but the models are unable to determine if the aggregation is due to A, C or both. However, differences in twin correlations (see Table 1) and results from the full ACE models make it clear that both genetic and shared environmental factors probably contribute to familial aggregation in pre-ovulation and that the degree of genetic influence is less than in post-ovulation.
Discussion
This study was the first to examine within-person shifts in etiologic risk for disordered eating across the menstrual cycle. Results highlighted changes in both the magnitude and type of genetic and environmental influences on emotional eating scores. Twin correlations and univariate models provided consistent evidence for stronger genetic influences during post-ovulation and greater environmental (particularly shared environmental) influences during pre-ovulation. The identification of these shifts is rather remarkable given that they occur over a span of just days and correspond with distinct and robust changes in the reproductive axis that occur on a monthly basis. Taken together, results highlight a critical role for changes in genetic and environmental effects on recurring phenotypic risk for emotional eating across the menstrual cycle.
Although our longitudinal results are unique, they were nonetheless constrained by (unexpected) power limitations. When this study was designed, power analyses assumed that there would be no shared environmental influences on emotional eating scores in our sample of late adolescent/early adult twins. This assumption was based on extensive twin data suggesting no shared environmental influences on binge eating, binge-related disorders (e.g. bulimia nervosa, binge eating disorder) or any other form of eating pathology or symptom after puberty (Bulik et al. Reference Bulik, Sullivan and Kendler1998, Reference Bulik, Sullivan, Wade and Kendler2000; Sullivan et al. Reference Sullivan, Bulik and Kendler1998; Klump et al. Reference Klump, McGue and Iacono2000, Reference Klump, McGue and Iacono2003, Reference Klump, Burt, McGue and Iacono2007, Reference Klump, Burt, McGue, Iacono and Wade2010a ). The finding of shared environmental influences was thus entirely unexpected. However, it did lead to several intriguing hypotheses about etiologic influences on binge eating in adulthood and across the menstrual cycle. Broadly, these data suggest that the complete lack of shared environmental effects observed in past studies of post-pubertal twins may be due to the failure to control for menstrual cycle phase at the time of assessment. Twins would have been assessed randomly across the different menstrual cycle days, and would therefore produce genetic and environmental estimates that are an average of the effects across the cycle. Given that we observed genetic effects in both pre- and post-ovulation (they were just lower in pre-ovulation), and shared environmental effects were only observed in pre-ovulation, this averaging would produce significant estimates of genetic effects but non-significant and low estimates of the shared environment. Although on average, such results broadly reflect the type of etiologic influences on emotional eating, they do not reflect the factors that may drive emotional eating on a daily basis and at different points of the menstrual cycle. It is often these proximal, daily triggers that are critical treatment targets (Fairburn, Reference Fairburn2008) and should be targets of etiological research aimed at understanding specific risk factors for emotional eating and binge eating. Clearly, additional research is needed to replicate our findings, and a good start to this process would be to control for menstrual cycle phase in twin studies of binge-related phenotypes.
Our data also provide new leads in thinking about phenotypic risk for emotional eating. Rates of emotional eating and binge eating are lowest in the pre-ovulatory phase (Edler et al. Reference Edler, Lipson and Keel2007; Klump et al. Reference Klump, Keel, Culbert and Edler2008, Reference Klump, Keel, Racine, Burt, Neale, Sisk, Boker and Hu2013b , Reference Klump, Racine, Hildebrandt, Burt, Neale, Sisk, Boker and Keel2014) when, according to our findings, environmental influences exert a stronger influence on emotional eating risk than genetic effects. This suggests either that environmental factors decrease/protect against emotional eating during the pre-ovulatory phase, and/or that phenotypic risk is lower because genetic factors are less prominent. We think that both of these processes are probably at play, and that changes in ovarian hormones contribute to these protective and risky effects. The pre-ovulatory phase is marked by high levels of estradiol and near-absent levels of progesterone. As shown in our previous work (Klump et al. Reference Klump, Keel, Culbert and Edler2008, Reference Klump, Keel, Racine, Burt, Neale, Sisk, Boker and Hu2013b ) and decades of animal research (Asarian & Geary, Reference Asarian and Geary2006), high levels of estradiol are associated with decreased food intake, emotional eating and binge eating, particularly when progesterone levels are low. Although we were unable to directly model ovarian hormones in the current study (see more on this below), collectively, our findings suggest that estrogen's protective effects during pre-ovulation may be environmentally, rather than genetically, mediated.
Precisely how or why these effects would be environmentally mediated remains unknown, but one possibility is that estrogen acts through membrane receptors that affect behavior through non-genomic pathways. Membrane receptor activation produces rapid molecular signals that change the excitability of neurons within seconds to minutes via processes that do not require changes in gene expression (Santollo et al. Reference Santollo, Marshall and Daniels2012). It is possible that high levels of estradiol during pre-ovulation activate these membrane receptors and decrease food intake and emotional eating via non-genomic pathways in all women, regardless of genetic risk. Mechanisms underlying hormone membrane receptor effects on behavior are still poorly understood; however, new data in animals suggest that their effects can be produced via non-genomic and genomic pathways (Roepke, Reference Roepke2009; Roepke et al. Reference Roepke, Qiu, Bosch, Ronnekleiv and Kelly2009). For example, activation of membrane estrogen receptors decrease food intake in ovariectomized rats, but the longer time course of the behavioral changes (i.e. 11 h after administration of estrogen agonists) suggests that rapid membrane effects on intra-cellular signaling pathways may have ultimately led to changes in gene expression (Graves et al. Reference Graves, Hayes, Fan and Curtis2011; Santollo et al. Reference Santollo, Marshall and Daniels2012). To date, no other studies have differentiated genomic versus non-genomic effects of estrogen on food intake. Clearly, more research is needed to understand the effects of nuclear and membrane hormone receptor effects on phenotypic and genetic risk for food intake and binge-related phenotypes across species.
However, if estrogen is protective via environmental pathways, than the increased phenotypic and genetic risk for binge eating during the mid-luteal phase (when both estradiol and progesterone are high) seemingly contradicts these results. Interestingly, there was some indication of shared environmental influences during the mid-luteal phase (see full model results in Table 2), suggesting that higher estradiol may have increased shared environmental risk during this phase. Nonetheless, genetic effects were still more prominent, and our phenotypic data (Edler et al. Reference Edler, Lipson and Keel2007; Klump et al. Reference Klump, Keel, Culbert and Edler2008, Reference Klump, Keel, Racine, Burt, Neale, Sisk, Boker and Hu2013b , Reference Klump, Racine, Hildebrandt, Burt, Neale, Sisk, Boker and Keel2014) and decades of animal research (Asarian & Geary, Reference Asarian and Geary2006) suggest that this might be due to the high levels of progesterone that are present during the mid-luteal phase. Extant data show that progesterone antagonizes the effects of estrogen and leads to increased food intake (Asarian & Geary, Reference Asarian and Geary2006), emotional eating (Klump et al. Reference Klump, Keel, Culbert and Edler2008, Reference Klump, Keel, Racine, Burt, Neale, Sisk, Boker and Hu2013b ) and binge eating (Klump et al. Reference Klump, Keel, Racine, Burt, Neale, Sisk, Boker and Hu2013b , Reference Klump, Racine, Hildebrandt, Burt, Neale, Sisk, Boker and Keel2014) in humans and animals. Our findings add to this literature by suggesting that these antagonizing effects may be genetically mediated, although again, the how and why of these potential processes need to be elucidated. Progesterone has genomic effects within the CNS via its regulation of gene transcription (Wilson et al. Reference Wilson, Foster, Kronenberg and Larsen1998), and these genomic effects have been shown to drive changes in food intake in animals (Asarian & Geary, Reference Asarian and Geary2013). Unfortunately, progesterone is studied less frequently than estrogen, and so very little is known about the particular neurobiological systems involved or how the genomic effects of progesterone may antagonize/interact with estrogen. Regardless of the precise mechanisms, our data suggest that the presence of progesterone during the second half of the cycle increases phenotypic and genetic risk for binge eating via processes that are in need of additional exploration.
One final note is warranted on hormone effects. We previously found estrogen to be associated with an increased genetic risk for disordered eating during puberty, with little to no contribution from progesterone (Klump et al. Reference Klump, Keel, Sisk and Burt2010b ). The key difference between our current findings and this past study is developmental stage and the probable organizational versus activational effects of hormones. We (and others – see Sisk & Zehr, Reference Sisk and Zehr2005) have argued that estrogen's effects during puberty are primarily organizational in nature (Klump, Reference Klump2013), whereby estrogen causes permanent changes in brain structure/function that then set the stage for the brain to respond to the activational effects of hormones in adulthood. By contrast, the hormonal effects that are present in adulthood and are studied herein would be considered activational in nature, i.e. transient effects that are due to circulating and changing levels of both estrogen and progesterone in adulthood. It is not uncommon for the mechanisms (i.e. genetic, non-genetic) underlying organizational versus activational effects of hormones to be different (Romeo, Reference Romeo2003; Sisk & Zehr, Reference Sisk and Zehr2005), or for the two hormones to operate differently across developmental stage (Schwarz et al. Reference Schwarz, Nugent and McCarthy2010; Klump, Reference Klump2013). In the case of emotional eating, our data suggest that estrogen activation during puberty may lead to genetically mediated (Klump et al. Reference Klump, Keel, Sisk and Burt2010b ), organizational changes in risk that are then differentially activated in adulthood by changes in both estrogen and progesterone across the menstrual cycle – changes that are environmentally and genetically mediated. Clearly, additional data are needed to confirm these hypotheses, but they provide one framework for conceptualizing the differential effects of ovarian hormones on eating disorder risk across development.
Although this study had many strengths (e.g. the within-person, longitudinal design), the study also had limitations. Our sample was underpowered to detect both genetic and shared environmental effects. The decreased power somewhat limited the strength of conclusions that could be drawn and also prohibited us from fitting more sophisticated twin models (e.g. constraint and Cholesky decomposition models). We attempted to fit these models in post-hoc analyses, but, in all cases, results produced non-significant parameter estimates (particularly for shared environment and genetic/environmental correlations) and no significant phase changes in etiologic effects. These results do not align with the twin correlations or results from the biometric models described above and are probably due to difficulties with detecting all three etiologic effects in pre-ovulation. Clearly, much larger samples are needed to replicate our results and confirm the presence of significant differences in genetic and environmental effects across menstrual cycle phase.
We focused on changes across cycle phase rather than ovarian hormone levels. Because phases were defined by hormone levels, our results implicate ovarian hormones in patterns of effects. Nonetheless, confirmation awaits the development of twin models that can examine daily couplings of hormones with changes in emotional eating. These types of multivariate, repeated-measures models do not exist for twin data, although our investigative team is in the process of developing analytic tools (see Boker et al. Reference Boker, Neale, Klump, Molenaar, Lerner and Newell2014). We should note that we attempted to address this issue by individually coding high/low hormone phases (using median splits, tertile splits, etc.) and examining changes across hormonal ‘phases’ rather than menstrual cycle phases. Perhaps not surprisingly, these high/low hormone phases completely overlapped with the cycle phases already examined. This would be expected given that menstrual cycle phases were coded based on high/low hormone values across the menstrual cycle (see Method). Consequently, these analyses were neither informative nor illustrative for confirming that menstrual cycle changes were due to ovarian hormone effects. However, the complete replication of menstrual cycle phase from hormone phases further supports our belief that the changes in genetic effects are due to changing levels of ovarian hormones across the cycle.
Finally, our sample was community based, and we examined a continuous measure of emotional eating instead of clinical binge eating. Although past data strongly suggest that phenotypic effects of ovarian hormones are similar across community and clinical samples, and results are identical for emotional eating and clinically diagnosed binge eating (Edler et al. Reference Edler, Lipson and Keel2007; Klump et al. Reference Klump, Keel, Culbert and Edler2008, Reference Klump, Keel, Racine, Burt, Neale, Sisk, Boker and Hu2013b , Reference Klump, Racine, Hildebrandt, Burt, Neale, Sisk, Boker and Keel2014), confirmation of changes in etiologic effects in women with clinical pathology awaits additional research.
Acknowledgements
This work was supported by the National Institute of Mental Health (NIMH; R01 MH082054 to K.L.K., P.K.K., M.M., C.L.S., S.B. and S.A.B. ). The content is solely the responsibility of the authors and does not necessarily represent the official views of the NIMH.
Declaration of Interest
None.