


I. INTRODUCTION
Severe predeformation by a series of passes of equal channel angular pressing (ECAP) at ambient temperature generates a fairly homogeneous ultrafine-grained (UFG) structure. Reference Valiev, Islamgaliev and Alexandrov1 Due to its high level of stored energy, this structure is susceptible to restoration of the microstructure by recovery, grain growth, and recrystallization. Hael Mughrabi and his co-workers were among the first to report grain coarsening at ambient temperatures. Impressive pictures were presented of discontinuously coarsened regions that had formed during cyclic deformation. Reference Höppel, Brunnbauer, Mughrabi, Valiev and Zhilyaev2,Reference Höppel, Zhou, Mughrabi and Valiev3 With increasing temperature T, restoration by static and dynamic grain coarsening becomes more and more pronounced. Reference Molodova, Gottstein, Winning and Hellmig4–Reference Ivanov and Naydenkin6 The present work uses the same in situ observation techniques (electron microscopy and stress relaxation) applied to microcrystalline Cu at 573 K = 0.425 T m, Reference Blum, Dvorak, Kral, Petrenec, Eisenlohr and Sklenicka7 where T m is the melting point of Cu, Reference Frost and Ashby8 to follow the dynamic coarsening of UFG Cu at 373 K = 0.275 T m and at the same time characterize the kinetics of the mechanisms of deformation, in particular the dislocation glide and recovery. We will demonstrate dynamic grain coarsening and report and discuss the strong, commonly neglected influence of deviations from the condition of the constant defect structure on the apparent activation volumes of deformation measured in stress relaxation.
II. EXPERIMENTAL DETAILS
Coarse-grained (CG) polycrystals of pure Cu (99.99% purity, mean grain intercept d CG ≈ 10−3 m) were subjected to predeformation by p passes of ECAP on route BC (pressing angle 90°, arc of edge curvature 20°, pressing speed 10 mm/min). In the following, we designate the so predeformed material as pCu.
To investigate microstructure changes during deformation and relationships between microstructure and tensile behavior, small specimens were prepared with 2.5 mm gauge length and initial cross section of width 3 mm and thickness (1.60 ± 0.05) mm. Additional grinding and electrolytic polishing of the surface led to reduction of the thickness to an estimated value of 1.35 mm so that the initial cross section was S o ≈ 3 × 1.35 mm2. Deformation in tension inside a scanning electron microscope (MIRA 3 XL FE, TESCAN, Brno, Czech Republic) occurred in a Gatan microtester (Microtest 2000EW with heated grips EH 2000 operating up to 773 K with load ≤2 kN, Gatan Inc., Pleasanton, California; see Ref. Reference Petrenec, Kral, Dvorak, Svoboda and Sklenicka9 for more details). In the transition zones between the gauge and head (gripping) portions, the specimen’s width symmetrically increased with a constant radius of curvature up to 10 mm. To compensate elongations from outside the gauge length, an effective gauge length l 0 = 6 mm was defined. This choice provides agreement between the true strains calculated from the total elongation and from ten pairs of surface markings on the specimen surface observed in situ (see below). Up to true strains of 0.04, the two agreed within 0.01. We note that the uncertainty of the absolute magnitude of strain has only minor influences on the strain rates and their ratios on which the present results are built.
The test temperature was 373 K = 0.275 T m. Deformation began 20 min after the start of heating at a constant rate dl tot/dt ≈ 10−4 s−1 × l 0 of length change imposed by the motor driven machine. Intermediate stops of deformation for ≤2405 s were used to take micrographs of the grain structure [electron back scatter diffraction (NordlysNano EBSD detector, Oxford Instruments, Abingdon, England) and color contrast on the basis of inverse pole figures].
During the stops at constant total length l
tot, any elastic and inelastic length changes cancel each other. Therefore the inelastic strain rate
 ${\dot \varepsilon _{{\rm{inel}}}}$
of the specimen can simply and accurately be determined from the elastic strain rate
 ${\dot \varepsilon _{{\rm{el}}}}$
. Assuming linear elasticity,
 ${\dot \varepsilon _{{\rm{el}}}}$
is proportional to the rate
 $\dot F$
at which the force F relaxes:
 $${\dot \varepsilon _{{\rm{inel}}}} = \left| {{{\dot \varepsilon }_{{\rm{el}}}}} \right| = \left| {\dot \sigma } \right|\,\,{E_{{\rm{eff}}}} = {k_i}\,\,\left| {\dot F} \right|\,\, \quad {k_i} = {{{E_{{\rm{eff}}}}} \mathord{\left/ {\vphantom {{{E_{{\rm{eff}}}}} {{S_i}}}} \right. \kern-\nulldelimiterspace} {{S_i}}} ,$$
where S
i
is the cross section of the specimen at relaxation i and E
eff is the effective elastic modulus in tension comprising the elastic length changes of the specimen and the relevant parts of the machine. In the limited strain interval covered in the in situ test, the changes of k
i
are so small that they can be neglected, and k
i
can be regarded constant for each i. k
i
is obtained from the condition that the rates of inelastic deformation just before and just after the start of stress relaxation must be equal. Before the stress relaxation, the inelastic strain rate is the difference of the total strain rate
 ${\dot \varepsilon _{{\rm{tot}}}}$
and the elastic strain rate
 ${\dot \varepsilon _{{\rm{el}}}} = \dot \sigma {\rm{/}}{E_{{\rm{eff}}}}$
. A sufficiently exact value E
eff is obtained when the σ − εinel curves start vertically after the stress relaxation (Fig. 1) because
 ${\dot \varepsilon _{{\rm{inel}}}}$
initially is vanishingly small. This yields E
eff ≈ 8 GPa. It is distinctly less than the modulus of Cu because the machine is relatively soft. It should be noted that the results are rather insensitive to the choice of E
eff.
Stress–strain curve of in situ test at
 ${\dot \varepsilon _{{\rm{tot,0}}}} \approx 9 \times {10^{ - 5}}\;{{\rm{s}}^{ - 1}}$
with intermediate stops i = 1, …, 10, where σ is relaxing; gray: in situ tests at 573 K with (solid) and without (dashed) intermediate stops.
Reference Blum, Dvorak, Kral, Petrenec, Eisenlohr and Sklenicka7

III. RESULTS
A. Deformation strength
Figure 1 shows the stress–strain curve of the in situ test with intermediate stops i for the microstructure observation. Within a strain of εinel ≈ 0.05, the flow stress saturates indicating that strengthening and softening processes are approaching a state of dynamic equilibrium; the equilibrium is generally a floating one as some microstructural parameters evolve extremely slowly. This state of floating dynamic equilibrium is called quasistationary (qs). The maximal qs strength lies close to the curve for the maximal qs strength derived from a large set of data obtained mainly in compression of UFG Cu produced by ECAP. Reference Blum, Li, Zhang and Wang10 This proximity allows us to draw two conclusions: (i) the present material has the usual UFG character at the start of deformation and (ii) tensile necking is excluded as the main cause of the flow stress maximum.
B. Microstructure
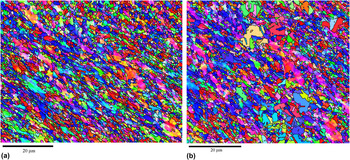
Figure 2 shows the same area (a) after ECAP and (b) in relaxation stop i = 7. The grain size d (mean grain intercept) measured along similar test line paths remains near 10−6 m throughout the test, confirming the UFG character of the material. In spite of the relative constancy of d during deformation, drastic local changes of the grain structure do occur. They are evident from the comparison of Figs. 2(a) and 2(b). It seems that a nucleation process is involved. In this case the observed grain coarsening may be addressed as discontinuous dynamic recrystallization (dDRX). This terminology is supported by our in situ observations at 573 K done with the same equipment used in the present work. The gray curves in Fig. 1 show those results of in situ tests on 8Cu at 573 K. Rapid local coarsening of grains was observed to set in already before the maximal flow stress had been reached, the same as found here for 373 K. In the test without interruptions, strength oscillations were seen (compare the solid light gray curve in Fig. 1). These are indicative of successive waves of dDRX.
Grain structure (OIM) of 8Cu (a) after ECAP and (b) at the end of stress relaxation i = 7, where the dynamically coarsened grains are seen.

In the present test at 373 K, ductility is not large enough to clearly observe oscillations before tensile fracture. However, the continuation of the stress–strain curve of Fig. 1 at 373 K with a slightly lowered flow stress is in fact an indication of a relative maximum. Discontinuous grain growth without nucleation of new grains is an alternative to dDRX. We neglect the subtle differentiation between dDRX and discontinuous grain growth. Independent of the question of nucleation, the discontinuous coarsening will provide new grain volume with low defect density and thereby influence the strength. The dDRX events are found to occur predominantly in and at the border of the micro shear bands where strain is concentrated.
C. Stress relaxation
Figure 3 shows the schematic of stress relaxation. The start at σ = σrel,0 was chosen to lie in the qs state of maximal strength. Subfigure (a) lists the relations following directly from the relaxation condition of zero length change (compare Sec. II). Subfigure (b) shows the decline of
 ${\dot \varepsilon _{{\rm{inel}}}}$
with relaxing stress. If the structure were exactly constant during the relaxation and only one thermally activated process of strain generation were existing, σ would relax along the dotted line down to the point where the athermal stress would be reached. As Fig. 3 displays, this is not found. This is no surprise as deformation and recovery are continuing during stress relaxation and lead to continuous changes of the microstructure.
Schematic of stress relaxation (thick arrow) at a constant total strain rate
 ${\dot \varepsilon _{{\rm{tot}}}}$
starting from σ = σrel,0: (a) stress–strain curve and (b)
 ${\dot \varepsilon _{{\rm{inel}}}} - \sigma$
at an exactly constant microstructure (including internal stresses) and in the presence of dynamic recovery.

Figure 4 shows the results of the stress relaxations in the form of Fig. 3(b). The variations of the rates
 $\dot F$
of stress decrease at the start of relaxation at σrel,0 reflect differences in the starting values
 ${\dot \varepsilon _{{\rm{inel}},0}}\left( {{\sigma _{{\rm{rel}},0}}} \right)$
. They are mainly due to differences in elastic strain rate. Figure 5 shows the curves of Fig. 4 in a normalized form at higher resolution. Based on slopes at the upper right corner of the normalized diagram, the apparent activation volume
 $${V^ * }\left( \sigma \right) \,\,\equiv\,\, M{k_{\rm{B}}}T{\left[ {{{\partial \ln {{\dot \varepsilon }_{{\rm{inel}}}}} \mathord{\left/ {\vphantom {{\partial \ln {{\dot \varepsilon }_{{\rm{inel}}}}} {\partial \sigma }}} \right. \kern-\nulldelimiterspace} {\partial \sigma }}} \right]_{\sigma = {\sigma _{{\rm{rel,0}}}}}}$$
was calculated, where M is the Taylor factor for conversion of the resolved shear stress into σ and k
B is Boltzmann’s constant. The partial derivative indicates the assumption of negligible microstructural changes. This assumption is justified as the intervals of time, inelastic strain, and stress Δσ needed to approximate the slope
 $\partial \ln {\dot \varepsilon _{{\rm{inel}}}}{\rm{/}}\partial \sigma$
by
 $\Delta \ln {\dot \varepsilon _{{\rm{inel}}}}{\rm{/}}\Delta \sigma$
are very short. So the stress change Δσ should equal the change Δσ* of the thermal stress component and be virtually free from changes of the associated athermal stress component. Figure 6 shows
 ${V^ * }$
in units of b
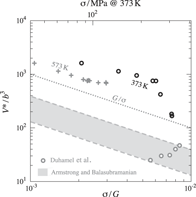
3 as a function of flow stress. For the relaxations i = 1 to 7, the apparent activation volumes are in the order of 3b
3
G/σ, where b = 2.56 × 10⁻¹⁰ m is the magnitude of the Burgers vector at room temperature.
Reference Frost and Ashby8
They will be discussed below in terms of a thermally activated glide of free dislocations. Later parts of the curves at σ < σrel,0 and the correspondingly increasing time period of decelerating stress relaxation must be discussed under consideration of the microstructural changes that have occurred within this period.
Relaxation rate
 $\dot F \propto {\dot \varepsilon _{{\rm{inel}}}}$
of tensile force F as function of stress σ derived in interruptions i of in situ test of Fig. 1 plotted versus stress σ; dotted line: stress dependence of the qs strain rate at
 ${\dot \varepsilon _{{\rm{inel}}}} \approx {10^{ - 4}}\;{{\rm{s}}^{ - 1}}$
; upper abscissa scale: stress normalized by shear modulus G = 40.9 GPa of Cu at 373 K.
Reference Frost and Ashby8

Inelastic strain rate versus R
σ in stress relaxations i normalized by the starting values (σrel,0,
 ${\dot \varepsilon _{{\rm{inel,0}}}}$
); dashed line shows average slope at R
σ = 1 for i ≤ 7.

Activation volume
 ${V^ * }$
in units of b
3 at 373 K derived from slopes of curves in Fig. 5 at σ = σrel,0 as a function of normalized stress; with data from σ-relaxation at 573 K
Reference Blum, Dvorak, Kral, Petrenec, Eisenlohr and Sklenicka7
; the data from Ref. Reference Duhamel, Brechet and Champion27 were calculated from the qs data of UFG Cu at 373 K plotted in Fig. 7; the dashed lines represent the master curve of
 ${V^ * }$
as a function of thermal shear stress component of Armstrong et al.
Reference Armstrong25
if the thermal shear stress component equals σ/M (upper dashed line) and (1/3) σ/M (lower dashed line).

IV. DISCUSSION
A. Deformation strength and microstructure at constant elongation rate
At the maximum flow stress σ ≈ 300 MPa, coarse-grained Cu would develop cells/subgrains of size w qs ≈ 14 b G / σ = 5 × 10⁻⁷ m. Reference Blum, Mughrabi, Cahn, Haasen and Kramer11 This is half the mean grain size of our UFG Cu. Therefore, a substantial fraction of the grains is not large enough to form subgrains with cell or low-angle boundaries at the given flow stress. This means that only free dislocations need to be supplied in most of the volume. Generation and storage of free dislocations is fast (compare, e.g., the estimate in Ref. Reference Li, Mueller, Höppel, Göken and Blum12). That explains the rather fast increase of flow stress at a nearly constant inelastic strain rate to a saturation level within a strain interval εinel ≈ 0.05 (Fig. 1).
We note that the strength remains fairly constant with strain εinel > 0.03 even though, according to our in situ observations (Fig. 2), dynamically coarsened grains are formed that fill with low-angle subgrain/cell boundaries of spacings similar to the former high-angle boundaries in the microcrystalline structure. We infer that replacement of high-angle by low-angle boundaries has little effect on the qs strength under the present deformation conditions. Such insensitivity to boundary character has been observed before Reference Blum, Li, Zhang and Wang10,Reference Li, Zeng and Blum13 and was explained by the compensation of strengthening and softening effects; compared to low-angle boundaries, high-angle boundaries have higher obstacle strength, but also higher recovery efficiency in reaction with free dislocations; under certain deformation conditions, these opposing effects cancel each other in the qs state. At lower/higher rates or stresses, a net softening/strengthening by high-angle boundaries has been observed in UFG Cu at 373 K. Reference Li, Zeng and Blum13
B. Deformation kinetics
The stress relaxations during stops of deformation are useful to study the deformation kinetics at a constant strain rate along the stress–strain curve. We differentiate between the thermally activated glide of free dislocations across the crystallites and thermally activated recovery processes at the crystallite boundaries.
1. Activation volume of bulk dislocation glide
At the beginning of each stress relaxation, the microstructural state, including the internal stresses coupled with the local arrangement of lattice defects, is still close to the one established just before the start of relaxation. Therefore, the experimental activation volume
 ${V^ * }$
as determined in this work at the starting stress σ = σrel,0 of each relaxation may be regarded as a signature of the major strain-generating process. This is supposed to be the glide of free dislocations across the (sub)grains. The activation volume of the thermally activated glide is:
 $$V_{{\rm{gl}}}^ * = b\lambda _{{\rm{gl}}}^ * \,\,\Delta x_{{\rm{gl}}}^ * \,\, ,$$
where
 $\lambda _{{\rm{gl}}}^ *$
and
 $\Delta x_{{\rm{gl}}}^ *$
are spacing and width of the discrete obstacles in the state established at σrel,0, i.e., at the beginning of σ-relaxation. The experimental result for
 ${V^ * }$
can be explained in terms of the thermally activated glide of free dislocations of density ρ when the obstacle width
 $\Delta x_{{\rm{gl}}}^ *$
is in the order of b and the obstacle spacing is in the order of the mean dislocation spacing ρ−0.5, approximated by bG/σ. This is usually found for pure materials regardless of grain size. The data from our in situ tests at 573 K on microcrystalline Cu (Fig. 6) confirm this statement.
The product
 $V_{{\rm{gl}}}^ * \tau _{{\rm{gl}}}^ *$
of the activation volume and the thermal stress component is the mechanical work done during activation of the obstacle. If we tentatively set the thermal shear stress component
 $\tau _{{\rm{gl}}}^ *$
equal to the full applied shear stress σ/M and use the experimental value
 ${\rm{\Delta }}V^{\rm{*}} ({\rm{\sigma }}) \approx 3b^3 G{\rm{/\sigma }}$
from Fig. 6, we get an activation work of 9 Gb
3. This value by far exceeds the typical strength of discrete obstacles in pure materials 0.5 Gb
3.
Reference Frost and Ashby8
Therefore, it turns out, as usual for thermally activated glide of pure materials (see e.g. Ref. Reference Nes14), that the thermally activated glide of free dislocations is so easy that just a small fraction of the applied shear stress σ/M needs to be supplied as the shear stress component
 $\tau _{{\rm{gl}}}^ *$
required for thermally activated overcoming of the obstacles. We conclude that there is essentially no difference between our UFG Cu and the other, including coarse-grained, pure materials regarding the process of thermally activated glide on close-packed lattice planes. A difference is expected to show up when the (σ-dependent) spacing of free dislocations, that governs the obstacle spacing, exceeds the grain size.
For relaxations i > 7, the activation volume
 ${V^ * }$
drops significantly (Fig. 5), much stronger than G/σ does. This may be related with the fracture. Nonuniform tensile deformation due to necking and crack/cavity formation causes the local stress in the fast deforming regions to exceed the σ-value calculated from uniform tension. As the
 $V^{\rm{*}} ({\rm{\sigma }})$
-values for i > 7 may be systematically wrong, we neglect them in the following discussion.
At first sight, our conclusion, that the glide of dislocations in UFG Cu occurs in qualitatively the same manner as in coarse-grained Cu, seems to be in strong contrast to common reports in the literature. However, this impression is unfounded as the literature data on activation volumes are usually based on qs deformation with σ-dependent microstructure and not on deformation at constant structure. The qs strengths are not controlled by the thermally activated glide of free dislocations because dynamic recovery controls the speed with which free dislocations may glide. We will give two examples in Sec. IV.B.3.
2. Dynamic recovery
Due to the continuous inelastic forward deformation in σ-relaxation, the microstructure changes progressively during the relaxation. This distinguishes stress relaxation from sudden, active σ-reductions, where the initial structure has less time to change, and large variations of the initial strain rates are observed, reaching even negative values for sufficiently large stress reductions. Continuous recovery during stress relaxation tends to keep
 $\tau _{{\rm{gl}}}^ *$
≥ 0 so that
 ${\dot \varepsilon _{{\rm{gl}}}}$
may also remain positive. This is one reason why
 ${\dot \varepsilon _{{\rm{inel}}}}$
does not follow the “constant structure” line with the slope
 ${V^ * }$
. Another reason lies in the direct contribution
 ${\dot \varepsilon _{{\rm{rec}}}}$
of dynamic recovery to inelastic strain:
 $${\dot \varepsilon _{{\rm{inel}}}} = {\dot \varepsilon _{{\rm{gl}}}} + {\dot \varepsilon _{{\rm{rec}}}}\,\, .$$
While
 ${\dot \varepsilon _{{\rm{rec}}}}$
is commonly neglected, it becomes significant and detectable, when
 ${\dot \varepsilon _{{\rm{gl}}}}$
is suppressed by reduction of its driving stress
 $\tau _{{\rm{gl}}}^ *$
. A detailed description of
 ${\dot \varepsilon _{{\rm{rec}}}}$
is beyond the scope of this paper. Different thermally activated mechanisms in control of dynamic recovery have been proposed (see overview in Ref. Reference Nes14), in particular cross slip,
Reference Mecking, Nicklas, Zarubova and Kocks15–Reference Kocks and Mecking17
climb of edge dislocations (e.g., Refs. Reference Nes14 and Reference Mukherjee, Bird and Dorn18–Reference Kassner and Perez-Prado20), and glide on noncompact lattice planes.
Reference Caillard21,Reference Caillard and Martin22
They all are reasonably supposed to act in the dislocation-dense, hard regions near the crystallite boundaries, where the total stress is concentrated by a factor k
h ≥ 1 to a value k
h = k
hσ. So the activation volume of recovery is:
 $${V_{{\rm{rec}}}} \,\,\equiv\,\, M{k_{\rm{B}}}T\Delta \ln {{{{\dot \varepsilon }_{{\rm{rec}}}}} \mathord{\left/ {\vphantom {{{{\dot \varepsilon }_{{\rm{rec}}}}} {\Delta {\sigma _{\rm{h}}}}}} \right. \kern-\nulldelimiterspace} {\Delta {\sigma _{\rm{h}}}}}.$$
As
 ${\dot \varepsilon _{{\rm{qs}}}}$
is recovery controlled, we expect
 ${\dot \varepsilon _{{\rm{qs}}}} \propto {\dot \varepsilon _{{\rm{rec}}}}$
. Hence, the apparent activation volume of the qs deformation,
 $${V_{{\rm{qs}}}} \,\,\equiv\,\, M{k_{\rm{B}}}T\Delta \ln {{{{\dot \varepsilon }_{{\rm{qs}}}}} \mathord{\left/ {\vphantom {{{{\dot \varepsilon }_{{\rm{qs}}}}} {\Delta \sigma }}} \right. \kern-\nulldelimiterspace} {\Delta \sigma }},$$
can be expected to be related to V
rec. However, V
qs and V
rec differ due to the microstructural changes related with the transition from one qs state to another. For instance, if the local stress σh = k
hσ is concentrated in the qs state by a factor k
h > 1, the change Δσh in the local stress σh is not equal to the change Δσ in the applied stress σ, but exceeds it by the factor k
h so that V
rec results to be k
h times smaller than V
qs. From the slope of the doted qs strength curve in Fig. 4, the qs activation volume V
qs at
 ${\dot \varepsilon _{{\rm{inel}}}} \approx {10^{ - 4}}\;{{\rm{s}}^{ - 1}}$
is obtained as 55b
3. The dash-dotted curves in Fig. 7 show what one would expect for qs stress concentration factors k
h = 1, 2, and 5, i.e., activation volumes V
rec/b
3 of 55, 27.5, and 11.
Normalized
 ${\dot \varepsilon _{{\rm{inel}}}} - \sigma$
diagram for in stress relaxation i = 7 (black) in comparison to
 ${\dot \varepsilon _{{\rm{gl}}}}$
and
 ${\dot \varepsilon _{{\rm{rec}}}}$
at a constant structure for three stress concentration factors k
h (see text).

The curves are based on the assumption that
 ${\dot \varepsilon _{{\rm{rec}}}}$
is about
 $0.2\,\,{\dot \varepsilon _{{\rm{qs}}}}$
at qs conditions, i.e., at R
σ = 1. This assumption is supported by dedicated stress reduction tests (see e.g. Refs. Reference Blum, Rosen, Cegielska and Martin23 and Reference Sun, Van Petegem, Cervellino, Durst, Blum and Van Swygenhoven24). The experimental curve in Fig. 7 lies in between the dash-dotted lines for stress concentration factors of 1 and 2.
Concluding this section, we state that dynamic recovery explains the observation that
 ${\dot \varepsilon _{{\rm{inel}}}}$
remains much larger during stress relaxation than would be expected from the exclusive activity of the thermally activated glide in soft regions. The present results cover only a relatively small R
σ-range, so it is not possible to decide whether the soft (glide of free dislocations) or the hard regions (recovery at boundaries with direct strain contribution) make the dominant contributions to the consistently high values of
 ${\dot \varepsilon _{{\rm{inel}}}}$
at R
σ < 1 found in stress relaxations after qs deformation. However, numerous stress reduction tests with a large R
σ-coverage suggest the latter.
3. Comparison with literature
In the literature, the distinction between different but cooperating thermally activated processes is frequently missing. Often an unspecified activation volume is determined by comparing different, possibly qs, states. We mention two examples:
-
(i) Armstrong and coworkers Reference Armstrong25,Reference Armstrong and Balasubramanian26 reported a common, approximately inverse proportionality between the activation volume and the thermal component τ* of shear stress for a number of different materials tested under different conditions, including fast deformation by shock loading. This master curve was transferred to Fig. 6. The unknown fraction τ*/σ was estimated to be constant and lie between the boundaries 1 and 1/3. The resulting range of activation volumes (gray area) lies significantly below our data. The probable reason is that our activation volumes
 ${V^ * }$
refer to the constant microstructure whereas the data of Armstrong and Balasubramanian were collected at quite different microstructural states. In that case, both the thermal and the athermal stress components are changing from one qs state to another. In other words, Δσ is larger than Δσ* in contrast to the constant structure assumption Δσ = Δσ* made in determining the activation volumes
${V^ * }$
from Eq. (2). This implies that
${V^ * }$
is systematically measured too low.
-
(ii) Duhamel et al. Reference Duhamel, Brechet and Champion27 investigated nanostructured Cu produced by a powder metallurgical technique. Stepwise increases of the total strain rate led to corresponding increases in flow stress. The strains per step were 0.02 < Δεinel < 0.06. This is large enough to allow a qs state to be approximately established with corresponding saturation in each step. Figure 8 shows the qs strength measured in four rate change tests at different temperatures. The strain rates were normalized with the activation energy 70 kJ/mol for the deformation of UFG Cu. There is a large offset between the strength line for room temperature and the ones at an elevated temperature. This softening is interpreted to indicate significant grain coarsening prior to deformation at T = 353 K. Comparison with the reference line for pCu with p ≥ 8 shows that the softening effect of high-angle boundaries at low stresses is even more pronounced in the nanostructured Cu of Duhamel et al. than in 8Cu, consistent with somewhat smaller grains. Figure 6 shows the V qs-data following from our own evaluation of the published curves with M = 3; the data are consistent with those reported in Ref. Reference Duhamel, Brechet and Champion27. So it seems that the “macroscopic” activation volumes of Duhamel et al. simply characterize the local slopes of the qs strength curves in Fig. 8. They do not characterize the dislocation glide at a constant structure. This explains the large difference to the values of the thermally activated glide of free dislocations measured in the present work with regard to the magnitude and variation with σ. The increase of the V qs-values of Duhamel et al. with increasing stress, is qualitatively the same as observed for nanostructured Ni. Reference Li, Mueller, Höppel, Göken and Blum12


qs strength of nanostructured Cu derived from rate change tests reported in Ref. Reference Duhamel, Brechet and Champion27; left ordinate: T-normalized strain rate
 ${\dot \varepsilon _{298}} \equiv \dot \varepsilon \left( T \right)\exp \left[ { - \left( {Q{\rm{/}}R} \right)\left( {{T^{ - 1}} - T_0^{ - 1}} \right)} \right]$
, T
0 = 298 K, Q = 70 kJ/mol, right ordinate: strain rate at 373 K.

The question arises as to why the microstructural changes occurring in the transition between qs states are commonly neglected. Such neglection is justified only if the thermally activated events controlling dynamic recovery are insensitive to the dislocation structure. Quite possibly, this may actually be the case. For instance, the elementary controlling processes in cross slip or in the migration of crystallite boundaries may be the same under different conditions and may depend only on the applied stress. An argument in favor of the reinterpretation of measured activation volumes in terms of recovery, rather than in terms of the glide of free dislocations, is the remarkable universality of the kinetics of qs deformation of pure materials that has led to successful normalizations, making the stress and temperature dependences of the qs deformation relatively independent of the (pure, crystalline) material see, e.g., Dorn and coworkers Reference Mukherjee, Bird and Dorn18 , Kocks and Mecking Reference Kocks and Mecking17 . However, interpretation of experimental activation volumes is not a straightforward matter and deserves more attention.
V. CONCLUSIONS
In situ tests have demonstrated discontinuous dynamic grain coarsening in pure UFG Cu at the relatively low temperature of 373 K = 0.275 T m. From the stress relaxations occurring during the periods of microstructural observation, the activation volumes associated with glide of free dislocations have been determined to lie in the same range near b 3 G/σ as found for coarse-grained pure materials. This indicates that the average spacing of free dislocations is determining the spacings of thermal obstacles to glide also in UFG materials. As the glide of free dislocation rapidly slows down with decreasing stress, dynamic recovery takes control of the stress relaxation rate. Conventional strain rate change tests usually do not fulfill the condition of constant microstructure, so the activation volumes derived from such tests result from a mixture of different thermally activated processes associated with glide and recovery and have no simple meaning.
ACKNOWLEDGMENTS
This research has been financially supported by the Ministry of Education, Youth and Sports of the Czech Republic under the project CEITEC 2020 (LQ1601). Stimulating discussions with Prof. Ron Armstrong are gratefully acknowledged.