I. INTRODUCTION
Chalcones are present in edible plants and constitute one of the major classes of natural products with wide distribution in fruits, vegetables, tea, and soy-based food (Dimmock et al., Reference Dimmock, Kandepu, Hetherington, Wilson, Pugazhenti, Sudom, Chamankhah, Rose, Pass, Allen, Halleran, De Clercq and Balzarini1998). They are readily synthesized in the laboratory by various synthetic methods (Jang et al., Reference Jang, Jung and Oh2007). Most of them are prepared by the condensation of ketone with aromatic aldehyde following the Claisen–Schmidt reaction.
Chalcones are stable in two forms, a ketone or an enone, which form the central core for a variety of important biological compounds. Recent investigations show that chalcones are interesting for their biological activity (To et al., Reference To, Tang, Vessieres, Carrez, Provot and Jaouen1996; Nguyen et al., Reference Nguyen, Vessieres, Hillard, Top, Pigeon and Jaouen2007; Patel et al., Reference Patel, Karthikeyan, Moorthy, Deora, Lee and Trivedi2012). The main functions of chalcone are to purify blood, strengthen the immune system, monitor the cholesterol level, regulate blood pressure, prevent thrombus, suppress acid secretion, prevent cancer, and promote metabolism. The present investigation is a continuation of our broad program work on the synthesis, biological evaluation, and structural study of coumarin chalcones and its derivatives to understand the geometrical features and the underlying intermolecular interactions, which hold the assembly of the molecules in the crystalline lattice (Mechi et al., Reference Mechi, Chtiba, Hamdi and Ben Hassen2009; Ghouili and Ben Hassen, Reference Ghouili and Ben Hassen2011; Ghouili et al., Reference Ghouili, Dusek, Petricek, Ben Ayed and Ben Hassen2014). In this paper, we report the crystal structure of the title compound determined from the laboratory X-ray powder diffraction data and characterized by Fourier transform infrared microscopy (FTIR), proton nuclear magnetic resonance (1H NMR), 13C NMR, and UV–vis spectroscopy.
II. EXPERIMENTAL
A. Synthesis and methods
The acetylation of 4-hydroxycoumarin to give 3-acetyl-4-hydroxycoumarin 1 was carried out by the method of Dholakia et al. (Reference Dholakia, Parekh and Trivedi1968) by using glacial acetic acid in the presence of POCl3. The chalcone was synthesized using the Claisen–Schmidt (Claisen and Claparède, Reference Claisen and Claparède1881; Schmidt, Reference Schmidt1881) reaction by the condensation of 3-acetyl-4-hydroxycoumarin 1 and 4-hydroxy-3-methoxy benzaldehyde (vanillin) 2 in chloroform with an appropriate quantity of piperidine (mild organic base). This led to vanillin coumarin chalcone 3 (4-hydroxy-3-[(E)-4-hydroxy-3-methoxyphenylprop-2-enoyl]-2H-chromen-2-one) demonstrated in the scheme (see Scheme 1). The mixture was refluxed in a water bath. After cooling at room temperature, an orange solid was obtained in good yield (70%), filtered, washed with ethanol, and dried in air. The melting point 488 K was measured by the Kofler–Bench apparatus. All chemicals and solvents were of analytical grade and were used without further purifications. The 4-hydroxy-3-methoxy benzaldehyde was purchased from Sigma-Aldrich Company and the 4-hydroxycoumarin from Acros Organics.
B. Characterization
The synthesized compound was recrystallized by slow evaporation of acetone at room temperature for several days. The IR spectrum was recorded in the wave number range 400–4000 cm−1 by the KBr pellet technique on a Bruker Tensor 27 FTIR spectrometer. 1H NMR spectrum was recorded on a Bruker AV-300 NMR spectrometer in CDCl3 and TMS as an internal standard. The chemical shifts are expressed in δ-units. UV–vis electronic absorption spectra were recorded on a Hewlett Packard Model 8453.
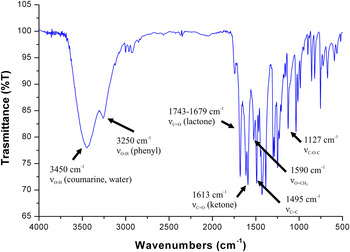
The IR spectrum (see Figure 1) of the title compound shows a broad absorption band at 3450 cm−1 which indicates OH stretching vibration that may be attributed to coumarin hydroxyl. It can also be attributed to water molecules from air or moist KBr. The shoulder at 3250 cm−1 could be assigned to the stretching vibration of phenyl hydroxyl groups. The spectrum also shows an intense stretching band at 1743–1679 cm−1 for the typical lactone carbonyl group. The band at 1613 cm−1 is assigned to the C = O stretching for the ketone group corresponding to the prop-2-en-1-one bond in the structure of the synthesized chalcone. This band becomes less intense compared to the analogous band in the spectra of the starting compound 3-acetyl-4-hydroxycoumarin (Manaev et al., Reference Manaev, Chibisova, Lyssenko, Antipin and Traven2006a). All of absorption bands are comparable to those in related structures (Hamdi et al., Reference Hamdi, Saoud, Romerosa and Ben Hassen2008, Reference Hamdi, Bouabdallah, Romerosa and Ben Hassen2010; Naseema et al., Reference Naseema, Sujith, Manjunatha, Kalluraya, Umesh and Rao2010; Naruka and Mahajan, Reference Naruka and Mahajan2011). In addition to the stretching vibration of C = C and methoxy group O–CH3 in the chalcone unit, corresponding to the bands at 1590 and 1495 cm−1, respectively, the C–O–C band is observed at 1127 cm−1.
(Colour online) Infrared spectra of the novel coumarin chalcone.

NMR spectrum was recorded for diluted solutions in CDCl3 at 300 MHz for 1H and at 75 MHz for 13C. Multiplicities of proton resonance in the 1H NMR spectrum are designated as singlet (s), doublet (d), triplet (t), quartet (q), and multiplet (m): d (ppm) 6.98–8.36 (m, 9H, HAr + H–C=), 6.05, 4.01 (2s, 2H, 2OH), 5.27 (s, 3H, OCH3). 13C NMR (ppm): 192 (C(O)–C = ; enol); 181.83 (C(O) = C) 149.48 (C(O)–O); 148.10 (C = C–Ar) 110.15 (C(O) = C), 114–125, (CAr); 124.33 (C(O)–C=); 56.14 (C(O)–CH3).
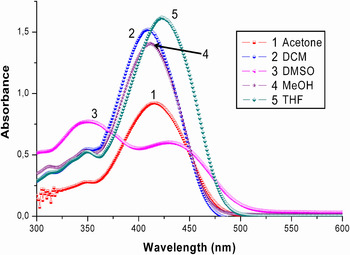
Typical UV–vis absorption spectra of the title compound was measured at room temperature in different solvents (see Figure 2), such as acetone, dichloromethane (DCM), tetrahydrofurane (THF), dimethylsulphoxide (DMSO), and methanol (MeOH), which differ considerably in polarity and also in ability to form hydrogen bonds. The measurements were taken at low concentration (5 × 10⁻⁵ M) to reduce the effect of self-absorption and aggregation in absorption.
(Colour online) UV–vis absorption spectra of title compound taken in different solvents at the concentration of 5 × 10⁻⁵ mol l−1.

We find that the spectra for all solutions are broad and their peak positions are sensitive to the solvent polarity. Moreover, the compound displays in different solvents intense and wide absorption bands. An electron-withdrawing substituent such as hydroxyl and methoxy group at the phenyl group in the positions 4 and 3, respectively, of the benzaldehyde coumarine chalcone (Manaev et al., Reference Manaev, Chibisova and Traven2006b; Ghouili et al., Reference Ghouili, Dusek, Petricek, Ben Ayed and Ben Hassen2014) induces a remarkable red shift of the absorption maximum. Two absorption regions are recognized, a broad absorption band with low intensity in the 320–360 nm region and an absorption band with medium intensity covers the 360–450 nm region. The long-wavelength band undergoes a marked red shift at about 21 nm on going from DCM to DMSO increasing the solvent polarity, whereas the position of the second band shows no solvent dependence. Furthermore, solvent polarity has a pronounced effect on the intensities of these two absorption bands.
It was observed that the absorption spectra of the title compound in THF and DMSO were red shifted compared with that in DCM, MeOH, and acetone. Moreover, the weak peak has dramatically no solvatochromic shift than the absorption maximum in more polar solvents. The weak peak is centered at 350 nm in all solvents due to π–π* transitions characteristic for the basic coumarin skeleton (Sun and Cui, Reference Sun and Cui2008), while absorption maximum is at 409 and 430 nm in DCM and DMSO, respectively. The absorption bands in the region 405–450 nm exhibit an absorption maximum at 430 nm, which can be attributed to π–π transition involving the whole electronic system of the compound with a considerable charge-transfer character originating mainly from the phenyl ring and pointing toward the coumarin system, which is characterized by a high electron-accepting character (Donovalova et al., Reference Donovalova, Cigan, Stankovicova, Gaspar, Danko, Gaplovsky and Hrdlovic2012).
C. Crystal structure determination and refinement
For the powder diffraction experiment the sample was ground and placed into the 0.3 mm borosilicate glass capillary. After that it was measured in transmission mode on the PANalytical Empyrean powder diffractometer from 4° to 80° 2Θ with CuKα 1,2 radiation (λ = 1.541 84 Å, focusing mirror, PIXCel3D detector, step size was 0.013° 2Θ, irradiated length of the capillary was 20 mm).
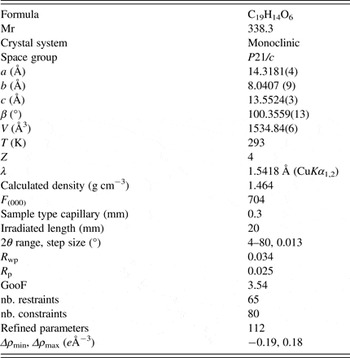
The indexation in Crysfire2004 (Shirley, Reference Shirley2000) and subsequent Le Bail fitting in JANA2006 (Petricek et al., Reference Petricek, Dusek and Palatinus2006) software found the monoclinic unit-cell a = 14.3181(4) Å, b = 8.040 71(9) Å, c = 13.5524(3) Å, β = 100.356 (2)°, and V = 1534.84(6) Å3. After that we used the direct space method called parallel tempering implemented in the program FOX (Favre-Nicolin and Černý, Reference Favre-Nicolin and Černý2002) to determine the crystal structure from powder diffraction data. The starting model of the asymmetric part of the unit cell was built from an existing crystal structure with CSD ref. code EVOPAH (Ghouili and Ben Hassen, Reference Ghouili and Ben Hassen2011) where only the missing parts were placed in the theoretical positions using the usual bond distances and bond angles.
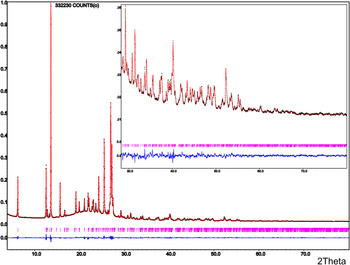
The suggested crystal structure by FOX was refined in JANA2006 software. The final refinement allowed removing the rigid body model and allowed refining positions and one isotropic ADP parameter of all non-hydrogen atoms (hydrogen atoms were kept in their theoretical positions) together with profile parameters, zero-shift, background, and unit-cell parameters. The model had to be restrained with all bonds and bond-angles soft restraints (tolerance was set to 0.001 for bonds and 0.01 for angles) to get the result with reasonable geometry. We used the Mogul (Bruno et. al, Reference Bruno, Cole, Kessler, Luo, Motherwell, Purkis, Smith, Taylor, Cooper, Harris and Orpen2004) software to get the most realistic values of the bonds and the bond angles that are not participating in aromatic rings. For aromatic rings we used bond and bond angles of two existing crystal structures with CSD ref. codes EVOPAH and AVABEE (Arrieta and Mostad, Reference Arrieta and Mostad2004). Hydrogen atoms of two hydroxyl groups were placed in the direction of possible hydrogen bonds. The final agreement profile factors were: R p = 2.40%, R wp = 3.38%, GOF = 3.47 with details of measurement and refinement given in Table I and with the final plot shown in Figure 3. The supplementary crystallographic data are available free of charge from the Cambridge Crystallographic Data Centre 12, Union Road, Cambridge CB2 1EZ, UK; fax: +44 1223 336033 (http://www.ccdc.cam.ac.uk, CCDC 959959).
(Colour online) Final Rietveld plot showing the measured data (red thin-cross), calculated data (black line), and difference curve (blue line). Calculated Bragg positions are shown by vertical bars.

Refined structural parameters of 4-hydroxy-3-methoxyphenyl-4-hydroxycoumarin.

III. CONCLUSION
The final bond distances and bond angles are strongly affected by geometrical restraints, which had to be applied during the Rietveld refinement process. On the other hand, removing all geometrical restraints from the Rietveld refinement results in a deformed molecular shape, but still with all atoms close to their restrained positions. Even if using bond and bond angle restraints disallow us to study the real values of bond and angles, it still allows us to study the final molecular shape and molecular packing.
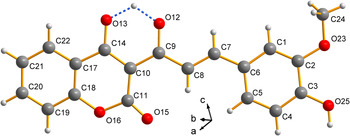
The crystal structure of [(2E) 4-hydroxy-3-[(E)-4-hydroxy-3-methoxyphenylprop-2-enoyl]-2H-chromen-2-one] is illustrated in Figure 4. The asymmetric part of the unit cell contains one molecule of the title compound. The molecule is elongated and approximately flat with only small angle of 9.73° between two planes created by the coumarin and benzene rings. Based on the donor–acceptor distances it is possible that there are two types of hydrogen bonds. One of them is intramolecular, which is between O13 and O12 atoms and the second one is intermolecular between O25 and O15 atoms; see Table II. However, hydrogen atoms participating in these interactions could not be located in the difference Fourier map, so their final directions were restrained by torsion angle restraints to provide their correct orientation to the acceptors.
(Colour online) The molecular structure of the title compound 4-hydroxy-3-methoxyphenyl-4-hydroxycoumarin chalcone with atomic labels.

Hydrogen-bond geometry (Å, °).

Symmetry codes: (i) −x, y−1/2, −z − 1/2.
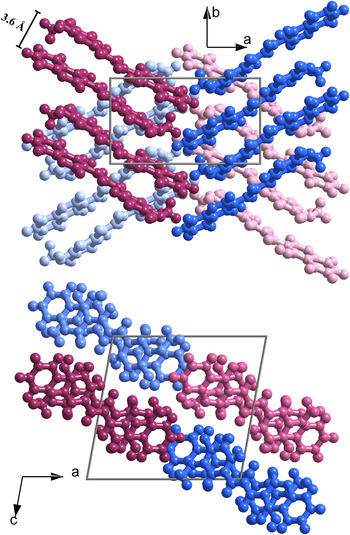
Molecules are partially overlapped in face-to-face stacking indicating the π–π interactions between phenyl ring and conjugated system in between the coumarin and the phenyl rings of the adjacent molecules. The inter-planar distance is approximately 3.6 Å; see Figure 5. The edge-to-face interaction between the coumarin rings is responsible for the final zigzag packing of the molecules in the crystal (angle value between two molecular planes is 63°).
(Colour online) π–π stacking between molecules of title compound. On the top is the view along the c-axis and bottom along the b-axis.

Synthetic route for title compound.

The final proposed type of OH and C = O groups (on atoms O12, O13 and O15, O25) could not be assigned using powder diffraction data, because the hydrogen atoms were not located in the difference map and the final bond and bond angle values were set by restraints. Hence we could not use these values to reconstruct the final type of OH and C = O groups. Also, the final Rietveld refinements of the both possible configurations led to the comparable agreement factors. As mentioned in the Characterization section, the shoulder at 3250 cm−1 could be assigned to the stretching vibration of the phenyl hydroxyl groups; hence we set the hydrogen atom to oxygen O25. The second speculative position of the hydrogen atom is between O12 and O13 atoms. As mentioned, the band at 1613 cm−1 was assigned to the C = O stretching in the prop-2-en-1-one, but this band is less intense compared with the analogous band in the spectra of the starting compound. Moreover, the broad absorption band at 3450 cm−1 indicates the OH stretching vibration that may be attributed to coumarin hydroxyl. For that reason we decided placing the hydrogen atom in the middle of bond O12 and O13 atoms.
The X-ray powder pattern of this material has been accepted by the editors of the ICDD and will appear in the earliest possible set of the powder diffraction file.
ACKNOWLEDGEMENT
The authors gratefully acknowledge the ICDD for financial support (grant number 09-04) and Praemium Academiae project of the AS CR for supporting the crystallographic part of the work.
SUPPLEMENTARY MATERIALS AND METHODS
The supplementary material for this article can be found at http://www.journals.cambridge.org/PDJ