Introduction
In 1998, Louis DeSipio described Latinos as the new American electorate, a statement that engendered a multitude of studies on Latino turnout, vote choice, and partisanship. Many of these works are built upon the high expectations set for the possible influence that Latinos could have in determining the outcome of future elections. Whether or not Latino voters have influence in elections is predicated upon whether members of this sector of the American electorate will vote in the same way that Black Americans have, as a unified Democratic voting bloc. Recently, post-election narratives regarding the 2020 General Election revealed that many were perplexed by the one in three Latino support for Republican candidates, especially in the presidential race, even though think tanks like Pew Research Center have consistently found that one in three Latinos identify with the Republican Party since the 1990s (Lopez et al. Reference Lopez, Gonzalez-Barrera, Krogstad and López2016).
There is still much to learn about the factors related to Latino partisanship. While Latino politics scholars know full well that Latino communities across the nation are very diverse, two factors that remain underexplored in relation to Latino partisanship are racial identity and racial attitudes. Party identification in the United States has long been tied to the history of slavery, racial identity, and the fight for civil rights for racial and ethnic minorities.Footnote 1 Furthermore, studies of partisanship in the United States show that party identity among whites and Black Americans is linked to racial identityFootnote 2 and to racial attitudes.Footnote 3 Yet, in spite of the fact that the color line and its connection to party identification is well established, the role of racial identity (for exception, see Stokes-Brown Reference Stokes-Brown2012) and of racial attitudes in determining Latino party identity has been examined by very few (Alvarez and Garcia Bedolla Reference Alvarez and García Bedolla2003; Nicholson and Segura Reference Nicholson and Segura2005; Samson Reference Samson2017).
Racial identity is a form of social group identity that is based on an individual’s sense of belonging to a group that is defined by shared race, which typically refers to shared physical characteristics and skin tone among people of shared ancestry. Latinos, in general, are rarely thought of in racial terms because for the most part they do not neatly fit the binary racial system that has dominated American society for over two centuries.Footnote 4 At a minimum, they are seen as “not white” and treated as such in the United States. However, governmental institutions, like the United States Census Bureau, recognize the racial diversity of Latinos by defining “Hispanic”Footnote 5 as a label that may be applicable to individuals of any race (Cobas, Duany and Feagin Reference Cobas, Duany and Feagin2015; Rodriguez Reference Rodriguez2000; Telles Reference Telles2018). Racial attitudes can be defined as affective (positive/negative) evaluations that individuals hold regarding specific racial and ethnic minority groups, and when these attitudes are negative they are reflective of racial prejudice. Still, the homogenization of Hispanics in the United States through the use of pan-ethnic terms has aided the erasure of the racial prejudices they have inherited from Latin American cultures (Chavez-Dueñas, Adames and Organista Reference Chavez-Dueñas, Adames and Organista2014; Hunter Reference Hunter2007, Reference Hunter2012; Telles Reference Telles2018; Wade Reference Wade2010), which are reinforced in the United States.
Since partisanship in the United States has been historically tied to race and racial attitudes, we should expect the same to be true for Latinos. I test this proposition by using data from six consecutive surveys of the Cooperative Election Study (CES, formerly Cooperative Congressional Election Study). Analysis shows that self-identified Hispanics who racially identify as white are on average unlikely to identify as Democrats and more likely to identify as Republicans even when accounting for negative racial attitudes and controlling for ideology. I also find that Latinos who are more racially resentful and express strong color-blind racial attitudes are on average substantially less likely to identify as Democrats and more likely to identify as Republicans.
Race and Partisanship in the United States
American politics is inexorably tied to race (Hutchings and Valentino Reference Hutchings and Valentino2004) and consequently tied to partisanship. Linkages between the issue of racial equality and individual partisan affiliations can be traced from the Reconstruction era to the decade following the passage of the Civil Rights Act and the Voting Rights Act (Carmines and Stimson Reference Carmines, Stimson, Pierce and Sullivan1980). Furthermore, political parties in the United States are seen as organizations that represent the interests of particular social groups (Westwood and Peterson Reference Westwood and Peterson2020; Mason and Wronski Reference Mason and Wronski2018; Valentino and Sears Reference Valentino and Sears2005). Specifically, the Democratic Party is currently seen as representing the interests of racial and ethnic minorities, and the Republican Party is seen as representing the interests of whites. This association is evidenced by current patterns of partisanship among Black and white Americans, where upward of 70% of Black voters identify as Democrats (Dawson Reference Dawson1994; Kinder and Sanders Reference Kinder and Sanders1996; Tate Reference Tate1994; Weiss Reference Weiss1983).
The connection between race and partisanship is not only expressed through its association with racial identity groups but also through an association with racial attitudes. Negative racial attitudes, like racial resentment, among whites have been found to result in a greater likelihood of voting for Republican candidates (Abramowitz and McCoy Reference Abramowitz and McCoy2019; Highton Reference Highton2011; Hooghe and Dassonneville Reference Hooghe and Dassonneville2018; Knuckey Reference Knuckey2005, Reference Knuckey2011; Knuckey and Kim Reference Knuckey and Kim2015; Tesler and Sears Reference Tesler and Sears2010) and of identifying with the Republican Party (Dancey and Goren Reference Dancey and Goren2010; Giles and Hertz Reference Giles and Hertz1994; Layman and Carsey Reference Layman and Carsey2002; Morales Reference Morales1999; Sears and Funk Reference Sears and Funk1999; Tesler Reference Tesler2013, Reference Tesler2016; Westwood and Peterson Reference Westwood and Peterson2020). However, Latinos are not a subject of research in most studies about the relationship between racial identity, racial attitudes, and partisanship.
Latino Partisanship
Historically, a majority of Latinos have identified with the Democratic Party with the exception of Cuban Americans who identify as Republicans, while most newly arrived Latino immigrants tend to be non-identifiers. Political science research on Latino partisanship has in great measure focused on identifying the demographic factors that determine Hispanics’ identification as Democrats, Republicans, or Independents. This work has relied on adapting classic partisanship acquisition theories (Campbell et al. Reference Campbell, Converse, Miller and Stokes1960; Green, Palmquist, and Schickler Reference Green, Palmquist and Schickler2002) to the complexities of the Latino experience in the United States. As a result, studies of Latino partisanship have demonstrated that national origin identity,Footnote 6 social/political incorporation into American society,Footnote 7 and religionFootnote 8 are all associated with Latino party identification. Additionally, policy positions, especially views on immigration, have also been found to influence Latino partisanship (Abrajano and Alvarez Reference Abrajano and Alvarez2019; Alvarez and García Bedolla Reference Alvarez and García Bedolla2003; Nicholson and Segura Reference Nicholson and Segura2005).
It is through studies of the link between policy positions and partisanship that we can find some direct evidence for the possible influence of racial attitudes on Latino party identification. For instance, Alvarez and García Bedolla (Reference Alvarez and García Bedolla2003) find that support for affirmative action makes Latinos more likely to identify as Democrats and less likely to identify as Republicans. However, what has yet to be fully examined is the impact of white racial identity on Latino partisanship. By white racial identity I mean, self-identification as white or with whites as a social group independent of one’s phenotype. While Stokes-Brown (Reference Stokes-Brown2012) studied the link between Latino’s racial identities and partisanship, her analysis focuses on the effect of self-identification as Black, multiracial, and “some other race” on partisan identity. This approach recognizes the racial diversity of Latinos but does not account for the fact that many members of Latino communities self-identify as white or as multiracial whites.
Mestizaje and Racial Identity in Latin America and among Latinos in the United States
There is growing academic research and social commentary on the prevalence of colorism and racial discrimination in Latin America (Chavez-Dueñas, Adames and Organista Reference Chavez-Dueñas, Adames and Organista2014; Torres-Saillant Reference Torres-Saillant1998; Wade Reference Wade2010), and within Latino communities in the United States (Adames, Chavez-Dueñas and Organista Reference Adames, Chavez-Dueñas and Organista2016; Haywood Reference Haywood2017; Hernández Reference Hernández2003; Hunter Reference Hunter2007, Reference Hunter2012; Quiros and Dawson Reference Quiros and Dawson2013). The ideological narrative promoted by cultural and governmental institutions surrounding mestizaje, the intermixing of “Spaniards, creoles,Footnote 9 indigenous people, free blacks and slaves” (Wade Reference Wade2010, p. 27), is the foundation for the practice of colorism among Latinos—“a process that privileges light-skinned people of color over dark in areas such as income, education, housing, and the marriage market” (Hunter Reference Hunter2012, p. 247).
The Latin American Studies literature is in consensus that mestizaje ideology has a central role in determining how Latin Americans and Latinos identify racially and form racial attitudes (Duany Reference Duany1998; Hunter Reference Hunter2007, Reference Hunter2012; Itzigsohn and Dore-Cabral Reference Itzigsohn and Dore-Cabral2000; Newby and Dowling Reference Newby and Dowling2007; Quiros and Dawson Reference Quiros and Dawson2013; Telles Reference Telles2018; Roth Reference Roth2012; Torres-Saillant Reference Torres-Saillant1998). Ideologically, mestizaje functions in similar ways to color-blind racismFootnote 10 (Adames, Chavez-Dueñas and Organista Reference Adames, Chavez-Dueñas and Organista2016; Bonilla-Silva Reference Bonilla-Silva2006) because it makes Afro-descendant and Indigenous peoples disappear from the collective conscious in the region and erases their experiences of racial discrimination by affirming the myth that all Latin Americans are mixed. It also drives people to racially self-identify as white (or with an intermediate category), no matter their skin tone, in order to place themselves higher in the socioracial hierarchy, away from blackness—dark skin and sub-Saharan African phenotypes, while privileging whiteness—light skin and European phenotypes (Duany Reference Duany1998; Itzigsohn and Dore-Cabral Reference Itzigsohn and Dore-Cabral2000; Ostfeld and Yadon Reference Ostfeld and Yadon2022; Torres-Saillant Reference Torres-Saillant1998).
Unlike the United States, which has operated under a binary racial system throughout most of its history, Latin American societies operate under racial hierarchies with multiple categories based on skin tone and economic class where Black and Indigenous peoples occupy the bottom rung (Chavez-Dueñas, Adames and Organista Reference Chavez-Dueñas, Adames and Organista2014; Ostfeld and Yadon Reference Ostfeld and Yadon2022; Roth Reference Roth2012; Wade Reference Wade2010). Thus, when Latin American immigrants come to the United States, they are faced with new definitions of race and undergo a process of race acculturation that challenges their existing racial self-identifications (Roth Reference Roth2012). Consequently, many Latinos in the United States self-identify as white or choose to say they are “some other race” in the Decennial Census, while very few identify as Black (Roth Reference Roth2012; Telles Reference Telles2018). In fact, 64% of Hispanics self-identified as white in the 2010 U.S. Census (Ennis, Rios-Vargas and Albert Reference Ennis, Rios-Vargas and Albert2011), and 58% of Hispanics in the 2020 U.S. Census identified as white, or white in combination with other races.
It is important to note that in survey research Latinos tend to choose “Hispanic” as their racial identification because of questionnaire construction. Most surveys employ a series of two questions to measure respondents’ race and ethnicity. The first question, as in the data used in this study, asks respondents to select “which racial or ethnic group best describes” them from a discrete number of options that typically includes the category “Hispanic,” even though it is not a racial category, but a pan-ethnic one (Beltrán Reference Beltrán2010; Itzigsohn and Dore-Cabral Reference Itzigsohn and Dore-Cabral2000; Landale and Oropesa Reference Landale and Oropesa2002; Le Espiritu Reference Le Espiritu2016; Oboler Reference Oboler1995; Padilla Reference Padilla1984). Then respondents are given a follow-up question that asks those who did not initially identify as Hispanic if they are of “Spanish, Latino or Hispanic origin or descent.”Footnote 11 The tendency to select Hispanic in the “race question” may be the result of confusion on behalf of respondents who may not be aware a follow-up question is embedded in the survey. Telles (Reference Telles2018) argues that they identify as “Hispanic” in the race question not because this represents a meaningful racial category for them, but because the other available categories do not match cultural definitions of race they are familiar with.
Racial Attitudes among Latinos
The steady growth of the Latino population in the United States has stimulated the examination of Anglo whites’ racial attitudes toward Latinos (Abrajano and Hajnal Reference Abrajano and Hajnal2015; Stein, Post and Rinden Reference Stein, Post and Rinden2000) and of anti-Black racial attitudes expressed by Latinos (Bobo Reference Bobo, Smelser, Wilson and Mitchell2001; Hutchings Reference Hutchings2009; McDermott Reference McDermott2011a; Moberg, Krysan and Christianson Reference Moberg, Krysan and Christianson2019). Of course Latin American and Latino notions of race, color, and mestizaje along with evidence of Latinos engaging in practices of colorism all suggest that Latinos may acquire and express negative racial attitudes that are more aligned with the dynamics of race relations in the United States. This assumption is supported by evidence from studies that measure feelings of commonality with Black Americans (Jones-Correa, Wallace, and Zepeda-Millán Reference Jones-Correa, Wallace and Zepeda-Millán2016; Kaufmann Reference Kaufmann2003; McClain et al. Reference McClain, Junn and Haynie2010), especially those that find that Latino immigrants (McClain et al. Reference McClain2006; McDermott Reference McDermott2011a, Reference McDermott2011b; Ocampo and Flippen Reference Ocampo and Flippen2021), Latinos who are less acculturated (Jones Correa Reference Jones-Correa, Telles, Rivera-Salgado and Sawyer2011; Sanchez Reference Sanchez2008; Wilkinson Reference Wilkinson2014), and Latinos with light skin (Wilkinson and Earle Reference Wilkinson and Earle2013) are all less likely to feel a sense of commonality with Blacks. More importantly, some studies have started to examine the relationship between Latino’s negative racial attitudes toward Blacks and electoral politics with mixed results (Ditonto, Lau and Sears Reference Ditonto, Lau and Sears2013; Krupnikov and Piston Reference Krupnikov and Piston2016; Segura and Valenzuela Reference Segura and Valenzuela2010). Recently, Alamillo (Reference Alamillo2019) found that Latinos aligned with a color-blind view of racism in the American society were more likely to support Republican presidential candidates in 2012 and 2016. These studies indicate that racial attitudes among Latinos may have a significant role in relation to Latino partisan attachments.
Expectations
My first hypothesis is aligned with the social group identity approach used by Green, Palmquist, and Schickler (Reference Green, Palmquist and Schickler2002) in which partisanship is argued to be based on social group identity, meaning affinity with and self-categorization as a member of a social group. Huddy and Bankert (Reference Huddy and Bankert2017) explain that the central motivation in the social identity approach to partisanship is in-group bias, and a desire to advance one’s party along with one’s social group. Furthermore, recent work on the influence of partisanship on social group identities relies on the theory that political parties in the United States are made up of prototypical demographic groups that have sorted themselves into the two major parties (Egan Reference Egan2020; Margolis Reference Margolis2018; Mason Reference Mason2016; Mason and Wronski Reference Mason and Wronski2018). While research by Egan (Reference Egan2020) has put into question the directionality of the relationship between identities and partisanship, it also shows that racial and ethnic identities are among the most stable and least likely to be shifted to align with an individual’s partisan identity.Footnote 12 Thus, if Latinos identify as white and/or with whites as their social group, then this racial identity should be related to their partisanship because whites are seen as a social group typically represented by Republicans. To be sure, this measure of racial identity is not a measure of white group consciousness as is established in the study of white identity politics among Americans of European heritage (Jardina Reference Jardina2019).
Hypothesis 1: Latinos who racially identify as “white” are more likely to identify as Republicans, and less likely to identify as Democrats.
Hypothesis 2: Latinos who express negative racial attitudes are more likely to identify as Republicans, and less likely to identify as Democrats.
My second hypothesis connects this article to a long line of research on racial attitudes and partisanship in American politics (Dancey and Goren Reference Dancey and Goren2010; Giles and Hertz Reference Giles and Hertz1994; Knuckey Reference Knuckey2005; Morales Reference Morales1999; Sears and Funk Reference Sears and Funk1999; Tesler Reference Tesler2016; Westwood and Peterson Reference Westwood and Peterson2020). This body of work focuses particularly on how negative affect felt by whites toward Blacks is related to their partisan identity while at times engaging theories of intergroup conflict and at others theories of prejudice. Sociocultural prejudice theory (Allport Reference Allport1954), the central theory underpinning symbolic racism theory (Sears Reference Sears1988), holds that individuals are socialized into having negative feelings toward Black Americans. Similarly, scholarship on mestizaje ideology argue that it promotes beliefs about racial intermixing in Latin America that target Black and Indigenous peoples in the region for discrimination (Chavez-Dueñas, Adames and Organista Reference Chavez-Dueñas, Adames and Organista2014). Therefore, if Latinos can hold color and race-based prejudices due to the inheritance of mestizaje, then negative racial attitudes acquired in the United States should influence their partisan attachments in similar ways to other Americans.
Data and Methodology
To examine the relationship between racial identity, racial attitudes, and partisanship among Latinos, I use data from six consecutive CES surveys from 2010 to 2020 (Ansolabehere and Schaffner Reference Ansolabehere and Schaffner2013, Reference Ansolabehere and Schaffner2017; Schaffner and Ansolabehere Reference Schaffner and Ansolabehere2015; Schaffner, Ansolabehere and Luks Reference Schaffner, Ansolabehere and Luks2019, Reference Schaffner, Ansolabehere and Luks2021).Footnote 13 The CES is a biennial online nationally representative large sample survey conducted by over 50 colleges and universities and administered through YouGov. The CES includes a pre-election questionnaire that mainly collects information about the demographic characteristics of respondents, and a post-election questionnaire that collects data on respondents’ political behavior, and racial attitudes. Most importantly, the CES includes large subsamples of Latinos, having over 4,000 self-identified Hispanics in each survey year. Latinos are defined here as respondents who self-identified as Hispanic in one of two questionnaire items, the “race question” and the “Hispanic heritage question” discussed earlier in the paper (see Supplemental Index for question wording).
Partisanship, the dependent variable in this study, is measured by a four category variable that is recoded from the seven-point party self-identification question (see Table 1). The first category combines strong Democrats, not very strong Democrats and Democratic leaners. The second includes those who were “not sure” about their partisan identity, and the third includes Independents without partisan leanings (Klar and Krupnikov Reference Klar and Krupnikov2016). The fourth category combines strong Republicans, not very strong Republicans and Republican leaners. Partisan “leaners” are included among identifiers because non-identifiers have been found to be qualitatively different from identifiers, especially among Latinos (Lee and Hajnal Reference Lee and Hajnal2011). As seen in Table 1, the majority in every survey year identify with the Democratic Party, between 48% and 60%, and between 22% and 27% identified with the Republican Party. Note that there is no indication that Latinos are fleeing the Democratic Party to become Republicans.
Latino partisanship by survey year, CES 2010–2020

Note: Values represent weighted total percent and number of Latinos by partisan self-identification by survey year.
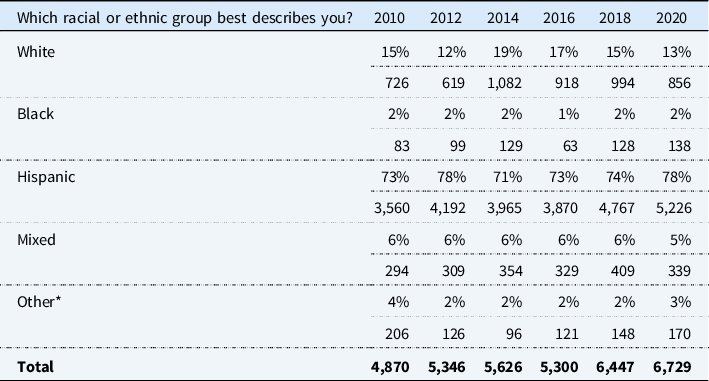
Over 70% of Latinos in each CES from 2010 to 2020 self-identified as Hispanic in the race question of the survey; however, the second most selected racial identity among them was “white,” between 12% and 19% (see Table 2). In each model, I include a dummy variable to indicate self-identification as white (1) in opposition to all other racial categories (0). An additional 27 text responses that included the words “white,” “Caucasian,” and “European” were also added to those who self-identified as white (all text responses are listed in the S.I.). It is important to note that immigrant generation is strongly related to Latinos’ likelihood to identify as white (see S.I. Figure A1).
Latinos by racial self-identification, CES 2010–2018

Note: Values represent weighted total and percent of Latinos by racial self-identification by survey year. *Other includes Latinos who identified as Other n = 443, Native American n = 228, Asian n = 173, and Middle Eastern n = 24.
Each CES survey from 2010 to 2020, with the exception of 2016, includes at least two of the four traditional racial resentment scale items developed by Kinder and Sanders (Reference Kinder and Sanders1996). Respondents were asked to indicate their level of agreement or disagreement with two statements: (1) “Irish, Italians, Jewish and many other minorities overcame prejudice and worked their way up. Blacks should do the same without any special favors,” and (2) “generations of slavery and discrimination have created conditions that make it difficult for Blacks to work their way out of the lower class.” In the 2016 CES, various individual participating institutions included variations on the racial resentment scale in their subsample questionnaires (Agadjanian Reference Agadjanian2022). I used these data to create a two-question index variable coded so that greater values indicate being more resentful. I expect this measure will be correlated with Latino partisanship even though it does not neatly map onto mestizaje ideology (Hypothesis 2), because Blacks are targets of racial prejudice both in the United States, Latin America, and also within Latino communities (Adames, Chavez-Dueñas and Organista Reference Adames, Chavez-Dueñas and Organista2016; Chavez-Dueñas, Adames and Organista Reference Chavez-Dueñas, Adames and Organista2014). Figure 1 shows that most Latinos can be found in the middle category of the racial resentment scale, but there are notably large percentages of Latinos who have high scores on racial resentment in 2010 (α = .66), 2012 (α = .65) and 2014 (α = .60). The low rates of high scores in 2016 may be an artifact resulting from the fact that only 707 of the 7,495 Latinos in that survey year were asked these questions (α = .47); thus one should expect larger margins of error for 2016 models using this independent variable. In 2018 (α = .73) and 2020 (α = .79), there is an observable increase in the proportion of Latinos who score in the least resentful category.
Racial resentment among Latinos by CES survey
Note: Values represent weighted percent of Latinos by scores on the two-item racial resentment index by survey year.

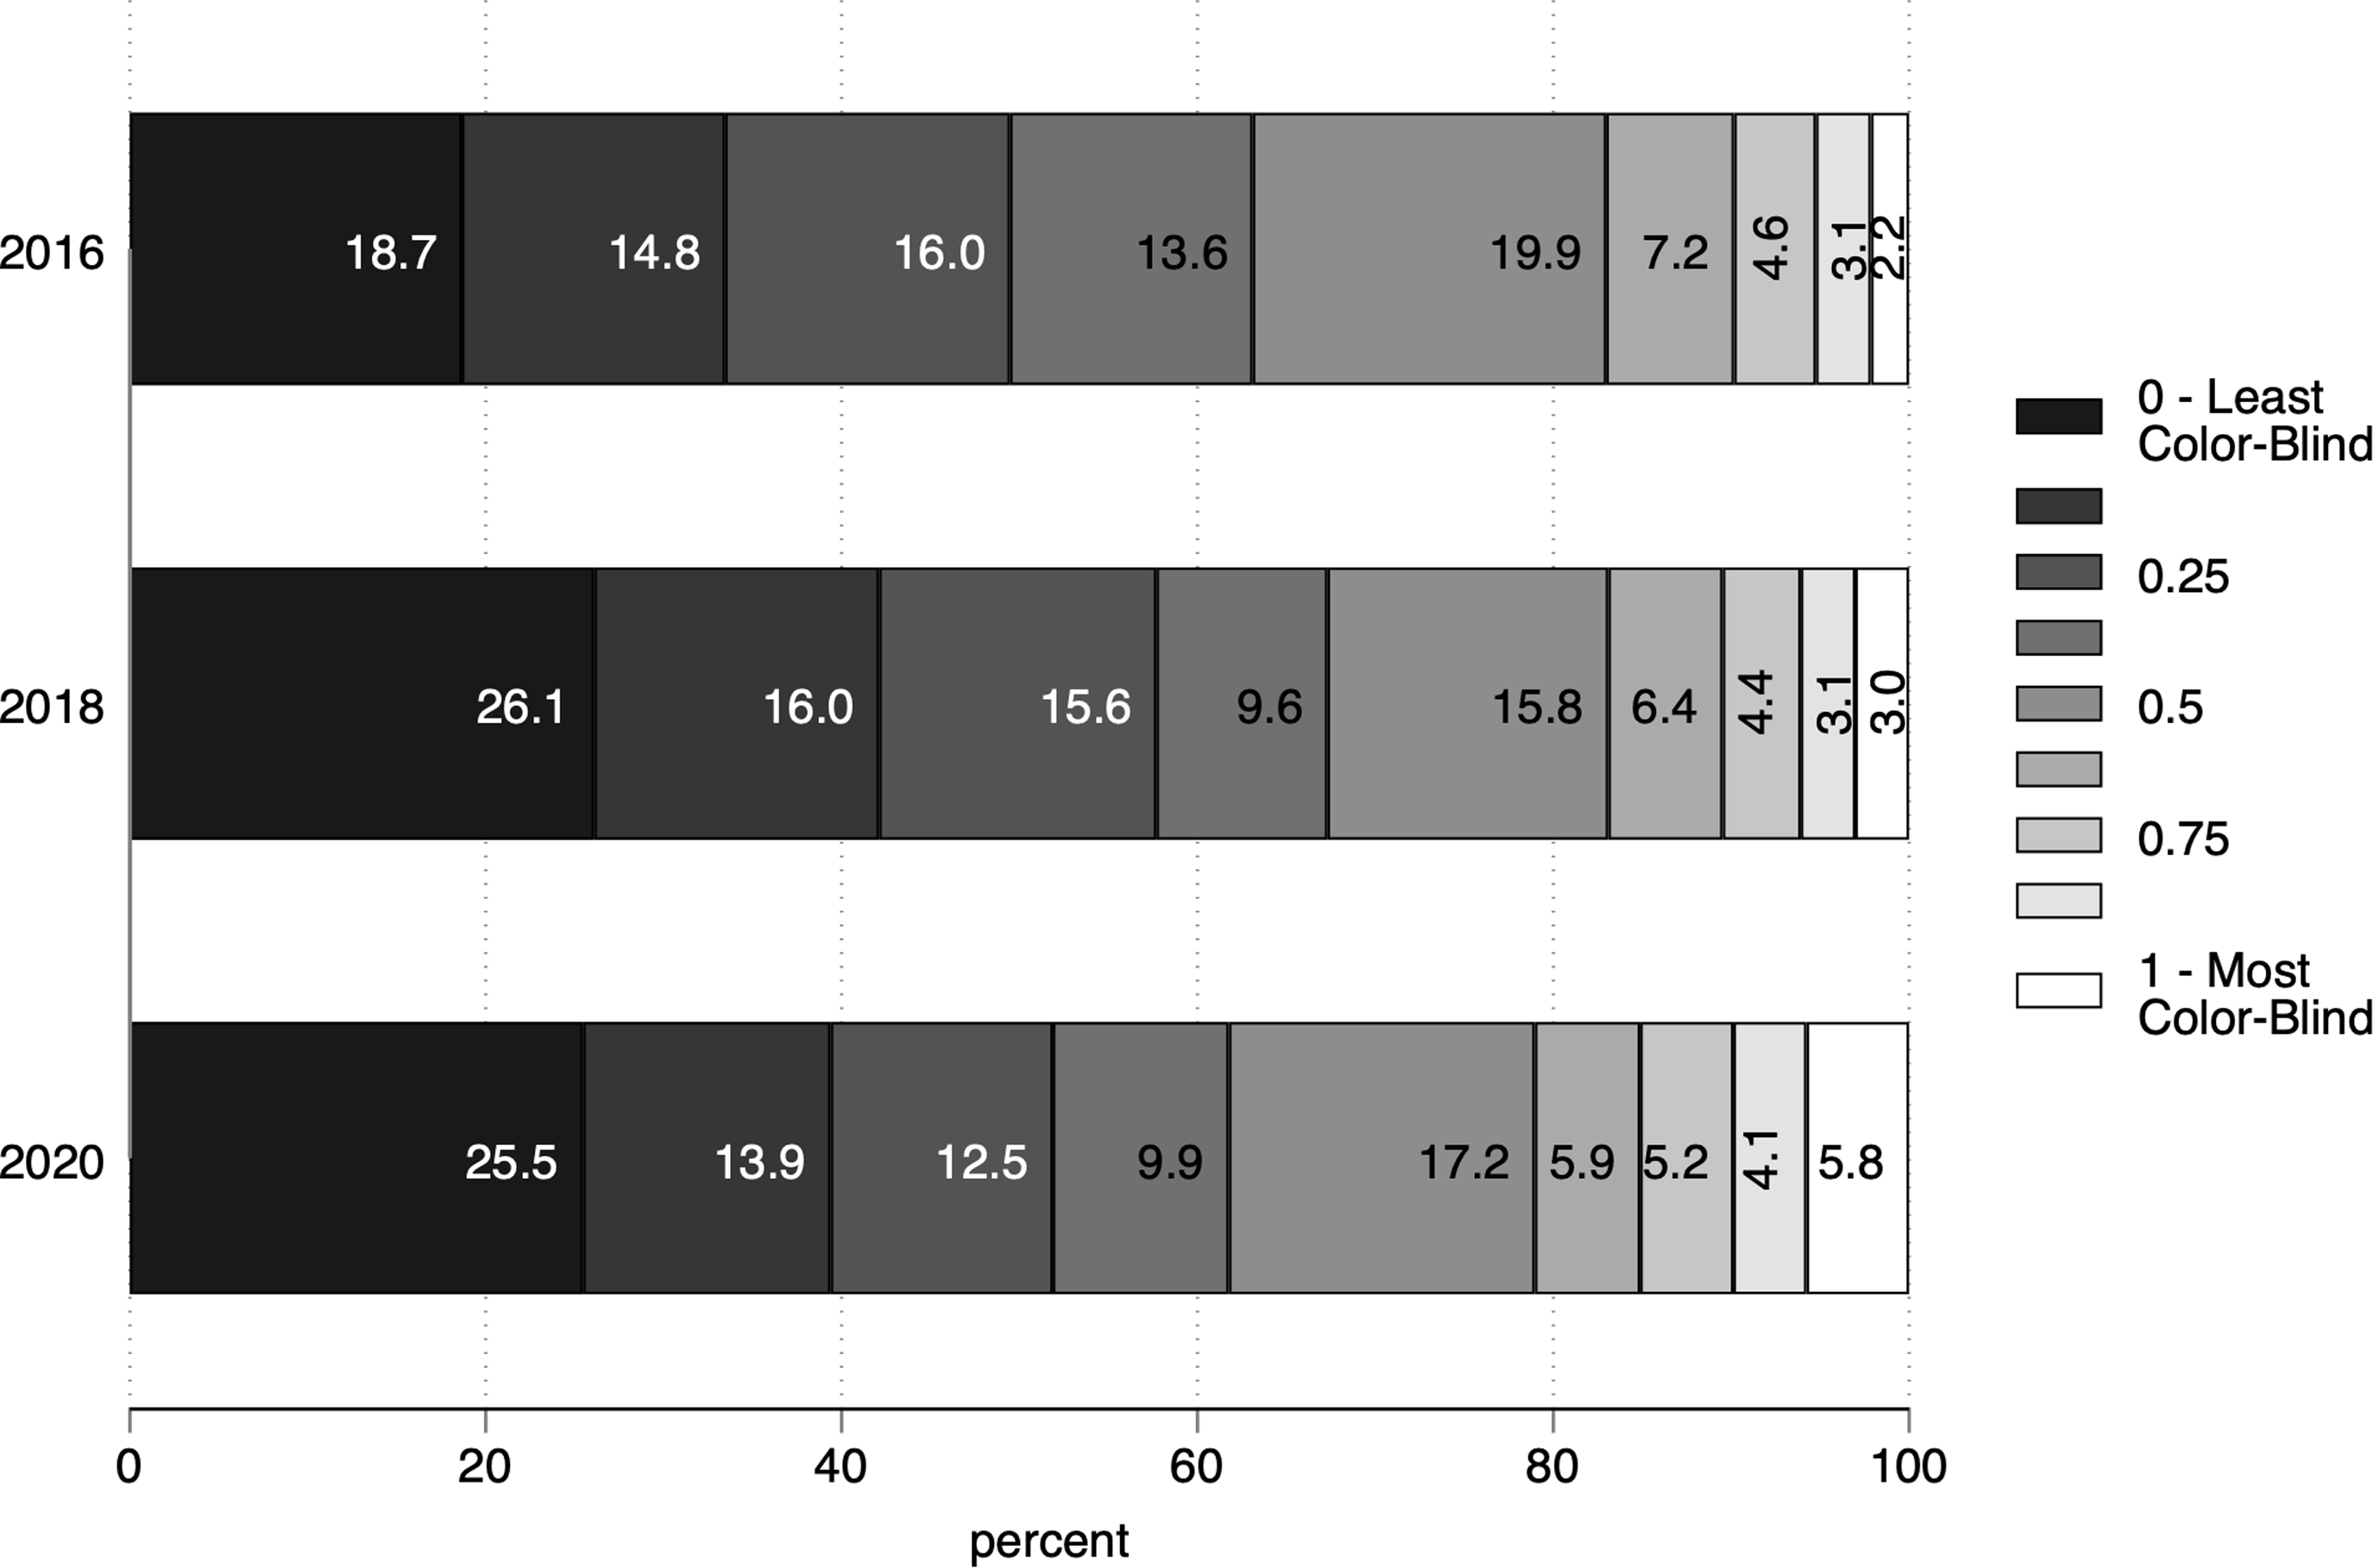
While the theoretical framework of this study relies on the Latin American and Latino concept of mestizaje, no questionnaire items measuring beliefs regarding this ideology have been developed yet. However, since mestizaje ideology is argued to be analogous to color-blind racism in its active erasure of the existence of racial prejudice among Latinos (Chavez-Dueñas, Adames and Organista Reference Chavez-Dueñas, Adames and Organista2014) I include the following items from the color-blind racial attitudes scale (CoBRAS) developed by Neville and colleagues (Reference Neville, Lilly, Duran, Lee and Browne2000) as a proxy measure of mestizaje ideology in my analysis: (1) Racial problems in the United States are rare, isolated situations, and (2) white people in the United States have certain advantages because of the color of their skin (reverse-coded). Only respondents from 2016 to 2020 were asked whether they agreed or disagreed with each statement on a five-point scale. Each variable was coded in such a way that larger values indicate greater alignment with color-blind ideology, and I expect that those with higher scores to be more likely to identify with the Republican Party (Hypothesis 2). Figure 2 shows that overall most Latinos do not express high levels of agreement with color-blindness. Nevertheless, a greater proportion of Latinos scored in the “least color-blind” category in 2018 (α = .62), and 2020 (α = .74) than in 2016 (α = .53).
Color-blind racial attitudes among Latinos by CES survey
Note: Values represent weighted percent of Latinos by alignment with color-blind ideology along the two-item index of color-blind racial attitudes by survey year.

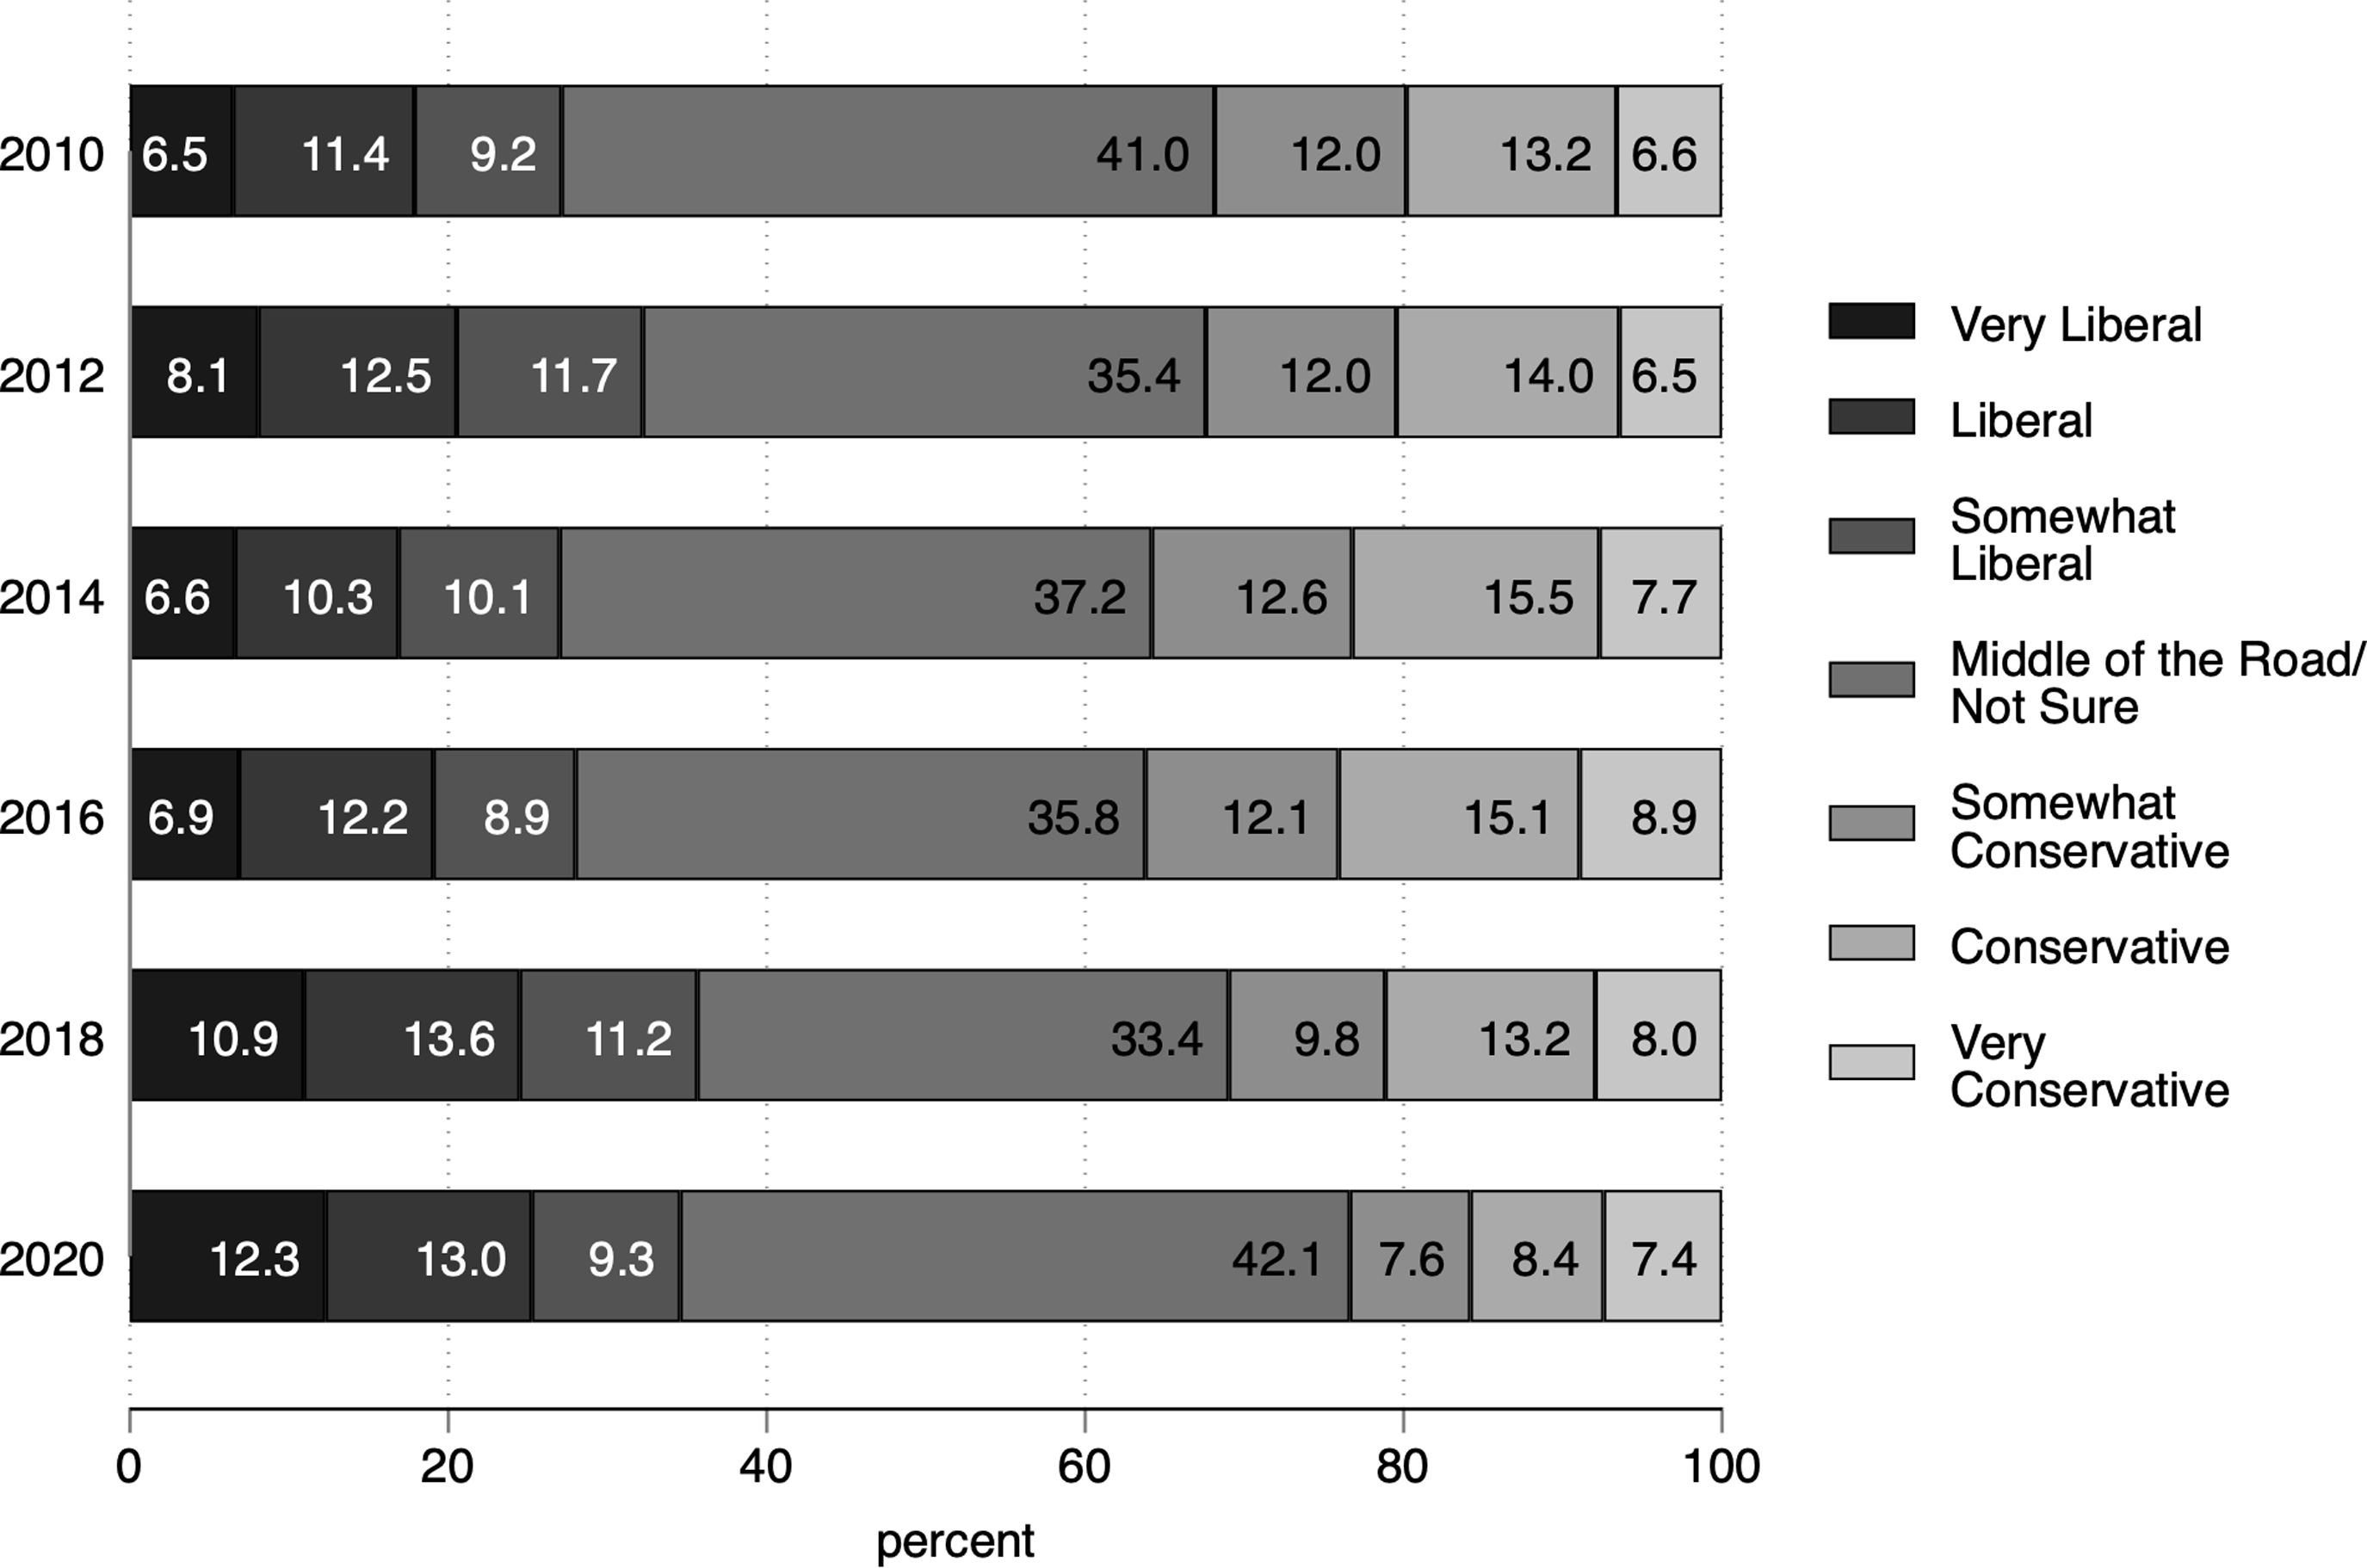
While ideology does not perfectly map onto partisanship, it has been found to be the central predictor of partisan identification in American politics where most conservatives identify with the Republican Party and most liberals identify as Democrats (Layman, Carsey and Horowitz Reference Layman, Carsey and Horowitz2006; Lloyd Reference Lloyd1995; Lupton, Smallpage and Enders Reference Lupton, Smallpage and Enders2020). This variable serves as a control or baseline for comparison with the effect of white racial identity and racial attitudes on Latino partisanship. Figure 3 shows that there is a somewhat normal distribution of ideological self-placement among Latinos in the CES along a seven-point scale going from very Liberal (1) to very conservative (7). Latinos who said they were “not sure” about their ideological views were coded to be in the same mid-point category as those who said their ideological views were “middle of the road” in order to avoid losing over 2,000 observations in the regression analysis presented below.
Ideology among Latinos by CES survey
Note: Values represent weighted percent of Latinos by ideological self-placement on a -point scale by survey year.

Modeling
I use multinomial logistic regression modeling for each survey year with Democratic partisanship as the base outcome to analyze these data. I then estimate and plot the average marginal effect (AME) of each key independent variable on Latino partisanship in order to provide a complete picture of the substantive association of racial identity and racial attitudes with all four partisan identities included in the dependent variable.Footnote 14 Three model specifications were constructed based on the two main hypotheses articulated above. The first racial identity model directly examines the relationship between white racial identity and Latino partisanship for all survey years individually.Footnote 15 The second model tests the effect of racial resentment alongside white racial identity on Latino partisanship. And, the final model assesses the relationship between Latino partisanship and color-blind racial attitudes along with white racial identity. Ideology is included in all models as a baseline variable to gauge if racial identity and racial attitudes are equal or stronger correlates of Latino partisanship. Control variables in each model include two demographic variables (age and gender), three social incorporation variables (education, family income, and immigrant generation) otherwise known as acculturation variables, and three religion variables including church attendance, being Protestant, and being Catholic (see S.I. Table A2 for descriptive statistics by partisanship).
Results
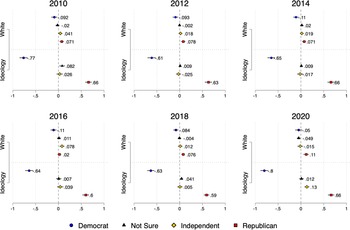
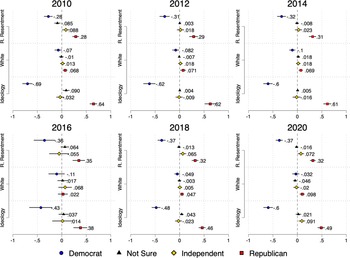
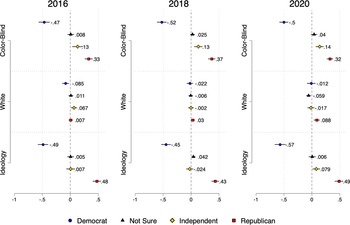
Each plot in Figs. 4–6 present the AMEs of each key independent variable on four Latino partisanship outcomes (full regression tables are available in the S.I.). This approach allows for simultaneous discussion of the substantive relationship of racial identity and racial attitudes with Latino partisanship holding all covariate values constant and avoids the use of a regression table in which results for one of the outcomes of interest are omitted. Circular markers in each plot correspond to the AME for identification as Democrat. Square markers represent the AME for the likelihood to identify as Republicans. Diamond shaped markers illustrate the AME on the likelihood that Latinos said they are Independents, and triangle shaped for those who said they are “not sure” about their partisanship. For ease of interpretation each marker is also accompanied by the value of the AME of each key independent variable on Latino partisanship. Further, since all variables were standardized on a zero (0) to one (1) scale each value can be interpreted as the average percentage increase or decrease in the likelihood to identify with one of the four partisanship outcomes in the dependent variable.
Average marginal effect of white racial identity on Latino partisanship
Note: Plotted values represent the average marginal effect of white racial identity and ideological self-placement on Latino partisan identification as Democrat, Republican, Independent, and Not Sure, by CES survey year, 95% confidence intervals.

Average marginal effects of racial resentment and white racial identity on Latino partisanship
Note: Plotted values represent the average marginal effect of racial resentment on Latino partisan identification as Democrat, Republican, Independent, and Not Sure, by CES survey year. Models include average marginal effects of white racial identity and ideological self-placement, 95% confidence intervals.

Average marginal effects of color-blind racial attitudes and white racial identity on Latino partisanship
Note: Plotted values represent the average marginal effect of color-blind racial attitudes on Latino partisan identification as Democrat, Republican, Independent, and Not Sure, by CES survey year. Models include average marginal effects of white racial identity and ideological self-placement, 95% confidence intervals.

Figure 4 shows that all else being equal there is an average decrease of 9.2% points in 2010 (p < .05), 9.3 points in 2012 (p < .01), 11 points in 2014 (p < .01), and 2016 (p < .01), and an average 8.4% points in 2018 (p < .01) on the probability to identify as Democrats among self-identified white Latinos. The AME of white racial identity on Democratic partisanship is not statistically significant in 2020; however, the regression coefficient is statistically significant at the p < .05 level. More importantly, Fig. 4 shows that white racial identity among Latinos leads to an average increase in Republican partisanship of 7.1% points in 2010 (p < .05), 7.8% points in 2012 (p < .01), 7.1 point in 2014 (p < .01), 7.6 points in 2018 (p < .01), and 11% points in 2020 (p < .01), with regression coefficients that are statistically significant at the p < .01 level (see Table A10 in the S.I.). The AME of white racial identity on Republican partisanship is not statistically significant for Latinos in the 2016 CES, but the regression coefficient is significant at the p < .05 level (see Table A10 in the S.I.). Interestingly, white racial identity is not a statistically significant factor for Latinos who said they were “not sure” about their partisanship in all survey years, and for Independents except in 2016.
Existing research demonstrates that Latinos and Latin Americans are socialized through the ideology of mestizaje into holding racial prejudice, denying the existence of racism, and privileging whiteness. Here, racial resentment serves as a measure of racial prejudice among Latinos, and results in this analysis show that this variable is strongly related to Latinos’ partisan identification even when accounting for white racial identity and ideology. Plots in Fig. 5 show that the two-item racial resentment index is consistently associated with an average increase in Latinos’ identification as Republicans at the p < .01 level. High scores on racial resentment are related to an average increase of 28% points in 2010, 29% points in 2012, 31 points in 2014, and 35 points in 2016. In both 2018 and 2020, racial resentment was related to a 32% point average increase in Latinos’ likelihood to identify as Republicans. This racial attitude measure has an equal or greater substantive relationship in the opposite direction with Democratic identification among Latinos in each survey year. Figure 5 shows an average decrease of 28% points in Latinos’ likelihood to identify as Democrats for those scoring high on racial resentment in 2010, 31 points in 2012, 32 points in 2014, 36 points in 2016 and 37 points in both 2018 and 2020. Moreover, even when controlling for racial resentment and ideology, regression coefficients for white racial identity are statistically significant in the expected direction for Republican identification for all survey years except 2016 (see Table A11 in the S.I.).
The color-blindness index used in this study measures Latinos’ views of the racial system in the United States, and analysis shows that it is strongly related to Latino partisanship. Figure 6 illustrates the AME of color-blind racial attitudes on Latino partisanship along with the effect of white racial identity. The expression of color-blind racial attitudes has a strong association with decreasing the likelihood of Latinos to identify as Democrats in all three survey years where this variable is available. So much so, that this index has a larger AME on decreasing Democratic identification among Latinos than ideology in 2018 (−52.0, p < .01). And, this racial attitude index has an almost equal relationship to that of ideology in 2016 (−46.0, p < .01) and in 2020 (−50.0, p < .01). Furthermore, the expression of color-blind attitudes also has a strong association with increasing Republican identification among Latinos in the CES. Scoring high on color-blind racial attitudes increased the likelihood of Latinos to identify as Republican by an average 33% points (p < .01) in 2016 and 32% points in 2020, while in 2018 it led to an average increase of 37% points (p < .01). In this model specification white racial identity had a statistically significant AME on decreasing Democratic identification among Latinos in 2016 (−8.5, p < .05) and on increasing their likelihood of Republican identification in 2020 (+8.8, p < .01). Also, the regression coefficient for the association of white racial identity with Republican identification is significant and the p < .05 level (see Table A12 in the S.I.).
Note that family income is related to an increased likelihood to identify as Republican almost every model in this analysis, except for the 2016 racial resentment model (see regression tables in the S.I.). As explained earlier in the paper, racial hierarchies in Latin America are constructed on a continuum that is based on both skin tone, phenotype and socioeconomic class. Thus, these results further align with the argument that mestizaje ideology may be central to understating Latino partisanship and political behavior more generally. Also, Cubans are either more likely to identify as Republicans or less likely to identify as Democrats in every model.
Discussion
The results described above align with the argument of this article that the inheritance of the ideology of mestizaje may be intertwined with partisanship acquisition among Latinos. In all models, white racial identity has a statistically significant AME on Latino partisanship even when controlling for ideology and accounting for the effect of racial resentment and color-blind racial attitudes. Moreover, even when controlling for the large and significant effect of racial attitudes, the independent, albeit weaker, effect of white racial identity underlines the importance of whiteness as a political identity for Latinos. To a greater extent, the large and independent effect of both racial resentment, a measure of attitudes toward African Americans, and color-blind racial attitudes, a measure of views regarding racism and white racial privilege, even when controlling for factors that are typically associated with party identification illuminates the importance of racial attitudes in determining Latino partisanship.
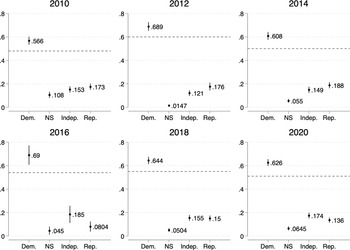
What’s more, if Latinos in the CES held racial attitude scores at similar levels to those of Black non-Hispanics respondents they would identify at higher rates with the Democratic Party in every survey year from 2010 to 2020. Figures 7 and 8 present post-estimation predicted probabilities for Latino partisanship calculated using the weighted average racial attitude score of Black non-Hispanic respondents in each year, including reference lines indicating the rate of Latino Democratic partisanship for the corresponding survey year of each plot. Predicted probabilities calculated at the weighted average racial resentment score of Black non-Hispanic CES respondents show that Latino respondents in each survey year would identify with the Democratic Party at 8.8% points higher in 2010, 8.9 points higher in 2012, 10.8 points higher in 2014, 15 points higher in 2016, 9.4 points higher in 2018, and 11.6 points higher in 2020 than the survey estimate (See Fig. 7). The predicted rate of Latino identification with the Democratic Party is also higher when calculated based on the weighted average color-blind racial attitudes score of Black non-Hispanic CES respondents (see Fig. 8). Latinos would identify with the Democratic Party at a rate of 66.3% in 2016, 63.3 % in 2018, and 63.0% in 2020. These figures are higher than their corresponding survey year estimates by 12.3% points in 2016, 8.3 points in 2018, and 12 points in 2020.
Predicted probability of Latino party identification based on average black CES racial resentment scores
Note: Plotted values represent the predicted probability of Latino partisan identification as Democrat, Republican, Independent, and Not Sure based on the average racial resentment scores of Black non-Hispanic CES respondents, 95% confidence intervals. Horizontal reference lines represent the rate of Latino Democratic partisanship for the corresponding survey year.

Predicted probability of Latino party identification based on average Black CES color-blind racial attitude scores
Note: Plotted values represent the predicted probability of Latino partisan identification as Democrat, Republican, Independent, and Not Sure based on the average color-blind racial attitude scores of Black non-Hispanic CES respondents, 95% confidence intervals. Horizontal reference line represents the rate of Latino Democratic partisanship for the corresponding survey year.

Conclusion
For decades, talk of Latinos as the sleeping giant in American politics has set the expectation that increasing numbers of eligible voters will make Latinos influential in electoral victories for the Democratic Party at all levels of government. These expectations are based on a lack of awareness regarding the current distribution of partisanship among Latinos and a lack of understanding of the diversity of Latino communities across the United States. For example, theories like electoral capture would suggest that Latinos should overwhelmingly identify with the Democratic Party, like Black Americans do, because it is the party that is widely perceived to support civil and voting rights for racial and ethnic minorities. However, a quarter of Latinos in six biennial surveys over a 10-year period included in this study identified with the Republican Party. This statistic requires highlighting the fact that Cubans Americans make up only 4% of all Latinos in the United States, the one Hispanic group that is traditionally seen as aligned with the Republican Party. Consequently, there is a multitude of Latinos across the country who identify as Republicans who are not Cuban Americans.
Analysis in this article has sought to account for the racial diversity of Latino communities in the United States in the study of Latino partisanship. Since the theory of electoral capture does not apply to Latinos, I have argued that those Latinos who identify racially as white are likely to break with the more than half of Hispanics in the United States who identify with the Democratic Party. Results show that white racial identity alone among Latinos consistently plays a role in defining their partisan attachments before and after Trump came on the political scene. More specifically, Latinos who racially identified as white were more likely to identify with the Republican Party and less likely to be Democrats in every survey year. This break with the Democratic majority among Latinos corresponds with Green, Palmquist and Schickler’s (2002) social group theory of partisanship because white Latinos tend to identify with the political party that is typically associated with representing the interests of whites as a social group, the Republican Party.
Moreover, I have also argued that Latino and Latin American definitions of race, color, and mestizaje (mixed race) underlie the acquisition and expression of negative racial attitudes among Latinos which at the same time are associated with their development of partisan attachments. Strong evidence emerged showing that negative racial attitudes are essential to determining Latino partisanship even when controlling for ideology. This was further confirmed by estimated predicted probabilities of Latino partisanship based on the average racial attitude scores of Black CES respondents. This result supports the argument made by Chavez-Dueñas, Adames and Organista (Reference Chavez-Dueñas, Adames and Organista2014) and Adames Chavez-Dueñas and Organista (Reference Adames, Chavez-Dueñas and Organista2016) that the cultural narrative and ideology of mestizaje, which they find is widely held among Latinos, is analogous to color-blind racism (Bonilla-Silva Reference Bonilla-Silva2006). Thus, future studies of Latino racial attitudes in connection with political behavior should focus on including measures of color-blind racial attitudes rather than other more traditional measures of affect toward Black Americans.
The results of this study are important not only because they provide a new explanation for why Latinos do not overwhelmingly identify as Democrats but also because they contribute to emerging studies on white identity and racial solidarity in American politics. Recent research on white identity politics contends that Hispanics could emerge as a new white ethnicity in American politics and that the growth of mixed race individuals in the United States may stunt the anxiously expected majority of color (Jardina Reference Jardina2019). While this article shows that most Latinos identify with non-white racial identities, those who do may be more likely to align themselves with a white identity politics agenda rather than a racial justice political agenda (for models using Hispanic race as a predictor see the S.I.). Additionally, research on Latinos’ solidarity, or lack thereof, with the Black Lives Matter movement reveals further cracks in the foundation for the possibility of coalition politics between Black Americans and Hispanics (Corral Reference Corral2020). Therefore, in view of the substantive relationship between white racial identity, racial attitudes, and Latino partisanship, political science research should continue to explore how the racial diversity of Latino communities affects their behavior in American politics.
Supplementary material
The supplementary material for this article can be found at https://doi.org/10.1017/rep.2023.28.
Acknowledgments
I am immensely grateful to Mia Costa, Brian F. Schaffner, Wouter Van Erve, Zach Albert, Mike Kowal, and Monika McDermott for their supportive input on early versions of this paper, and throughout the submission and review process. I am grateful to the reviewers and Editor-in-Chief Benjamin Gonzalez O’Brien, Ph. D., for their feedback which have led to the final version of this paper.
Financial support
No funding or financial support was received for the preparation of this article.
Competing interests
The author is unaware of any conflicts of interest that might impede the publication of this work.
Ivelisse Cuevas-Molina is Assistant Professor of Political Science at Fordham University Rose Hill College. She teaches courses in American politics, Racial and Ethnic Politics in the United States, Latino/a/x/e Politics, and Political Participation. Her research is focused on Latino/a/x/e Politics, Puerto Rican Politics in the US mainland, and survey methodology.