


1. Introduction
Prediction of man-induced climate change or natural climate variability depends on the knowledge of several key dataseis and models capable of correctly representing the major physical processes interacting in the climate system, i.e. the interaction between atmosphere, ocean, land and cryosphere. On the time-scale of years to centuries the ocean is believed to have the greatest impact on the evolution of the system, due to its ability to store and transport large amounts of heat and fresh water. in the Southern Ocean, 40% of the global water masses are formed, which on longer time-scales ventilate the deep ocean. These water-mass formation processes are also critical for the sequestering of tracers like carbon dioxide and other “greenhouse” gases in the deep ocean. It is widely accepted thai the seasonal expansion and retreat of the sea-ice cover in the Southern Ocean is a major factor in the global climate system. Extremely cold air temperatures and brine release during sea-ice formation combine to form one of the densest water masses of the global ocean. Anomalous production rates of deep and bottom water due to climate variability or change may find their expression in a global change of the conveyor-belt circulation. The distribution and behaviour of sea ice also has a profound effect on local atmospheric conditions (see, e.g., Reference Simmonds and BuddSimmonds and Budd, 1991). The realism of long-term climate predictions with coupled ocean/atmosphere models therefore depends to a high degree on the accuracy of the sea-ice simulation, i.e. the seasonally correct evolution of sea-ice cover and thickness distribution. This paper describes results from a coupled ocean/sea-ice model in the Southern Ocean.
2. Ocean Model
The Southern Ocean sector model used in this study is a slightly modified version of the “Hamburg Ocean Primitive Equation” (HOPE) model. This ocean general circulation model is based on the non-linear balance equations for momentum, the continuity equation for an incompressible fluid, and conservation equations for heat and salt (the “primitive equations") with the hydrostatic and Boussinesq approximations (for details see Wolff and others, 1996). Prognostic variables are the horizontal velocities, sea-surface elevation, potential temperature and salinity. Although the model has been developed for the global ocean, it can be used regionally and with multiple grid refinements. in this study we use the model at high resolution in a 60 sector of the Southern Ocean south of Australia (see Fig. 1). The total model domain covers the entire Southern Hemisphere, from the Equator to Antarctica. The model variables are com-puted on an Arakawa-E grid, with an effective resolution of
Grid resolution of the Southern Ocean sector model, showing the high-resolution sector between 120° E and the international date-line embedded in the lower resolution of the Southern Hemisphere.

60 km at 60° S in the high-resolution sector and 280 km in the coarse resolution area outside the sector. The grid distances are smoothly increased outwards from both sides of the sector until they match the coarse resolution. The vertical resolution comprises 15 layers, with 6 layers in the top 300 m. The model is driven by wind stresses from the Heller-man and Rosenstein (1983) climatology, air temperatures are from the atlas by Oberhuber (1988), and the initial density distribution (three-dimensional temperature and salinity) is from the Reference LevitusLevitus (1982) climatology. Surface temperature and salinity values are relaxed to climatology with a time-scale of roughly a month, and deeper layers are relaxed with a constant time-scale of 0.5 year. The model has been integrated for over a century and we will concentrate on results from the last decade. The ocean model is fully coupled to a sea-ice model which is different from the version described in Wolff and others (1996). The sea-ice component is therefore discussed in some detail in the following section.
3. Sea-Ice Model
The processes that govern the existence and behaviour of sea ice can be broadly categorized into thermodynamical effects (ice growth and decay) and dynamical effects (ice circulation and rheology). These processes and their numerical realization in this model are described in the following subsections.
3.1. Thermodynamics of ice growth and decay
The thermodynamic part of the sca-ice model is based on the energy conservation equation at the interfaces between sea ice and ocean or atmosphere and the heat conduction through the ice. For a more detailed description of sea-ice thermodynamics see, for example, Reference Maykut and UntersteinerMaykut and UNterstei-ner (1971), Reference HiblerHibler (1979), Reference Washington and ParkinsonWashington and Parkinson (1986), Reference FischerFischer (1995) and Reference Heil, Allison and LytleHeil and others (1996).
For the thermodynamic growth of sea ice we consider only the vertical energy conservation which can be formulated for the atmosphcrc-icc interface as

where FH is the sensible heat flux, FL is the latent heat flux, Fs is the net shortwave radiation, F1 is the net longwave radiation, I0 is the penetrating solar radiation, Ms is the energy flux due to snowmelt, Fc is the net conductive heat flux and FNet is the total net heat flux. in the current version of this model we do not consider snow and penetrating solar radiation.
The balance at the ice ocean interface can be written as

where F0 is the upward oceanic heat flux, qi is the heat of fusion of ice and hI is the ice thickness.
3.1.1. Shortwave radiation
The net shortwave radiation is composed of two parts, the incoming solar radiation  and the reflection of
 . at the ice surface, called outgoing solar radiation
 .
The shortwave radiative fluxes can be computed from astronomical parameters (solar constant, Earth orbit) and terrestrial variables (cloudiness, water-vapor pressure, albedo). We use a model based on work by Reference ZillmanZillman (1972) to compute the incoming solar radiation:

where S is the solar constant (S = 1353 Wm −2), Z is the water-vapor partial pressure of the atmosphere, z is the solar zenith angle and CI is the cloudiness 0 ≤ CI ≤ 1 (taken here to be constant at 0.6). The effect of clouds on the incoming solar radiation (loss through scattering) is taken into account with a correction after Reference LaevastuLaevastu (1961). Equation (3) is simplified to

due to a lack of water-vapor data. The cosine of the zenith angle can be computed from

where  is latitude, δ is solar declination and H is the hour angle.
The declination and the hour angle are given by


where H is the solar time in hours and J is thejulian day of the year.The reflection of the incoming shortwave radiation depends on the surface properties and is parameterized using a surface albedo value (here constant at 0.75 for ice)

See Heil and others (1996) for a more detailed treatment of the albedo for different ice/snow surface characteristics. Therefore the net shortwave energy flux is

The net shortwave fluxes have been computed as monthly mean fields and are used to force the sea-ice model.
3.1.2. Longwave radiation
The outgoing longwave radiation is computed from Stcfan-Boltzmann'S law under the assumption of the Earth as a grey body.

where  is the emissivity of ice (0.97),
 is the Stcfan-Bolt z-mann constant and Tice is the surface temperature of ice in K (constant).
The incoming longwave radiation  . can be computed as a function of air temperature following Reference Idso and JacksonIdso and Jackson (1969) with a correction for cloud cover (Reference Marshunova, Keller, Fletcher and OlenicoffMarshunova, 1966, cited in Fischer, 1995):

The effects of latent, sensible and oceanic heat fluxes are summarized in the four processes discussed below: melting of existing ice by oceanic heat fluxes; atmosphere ocean heat fluxes through ice-free areas; atmosphere-ocean heat fluxes through non compact ice; and growth of existing ice by atmospheric heat fluxes. The following processes are mutually exclusive and the activation of each process depends on the conditions described.
3.1.3. Meiling of existing ice by oceanic heat fluxes
In the case of existing sea ice, the upper-layer ocean temperature and salinity, the sea-ice thickness hI, and the sea-ice compactness A are modified as follows under the assumption of thermal equilibrium during a time-step:
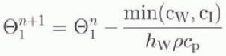


where  and
 are the potential temperature and salinity in the top ocean layer, respectively, p is the ocean density, qi
is the heat of fusion of ice, Cp is the specific heat of sea water and hw
is the thickness of the top ocean layer. Superscripts “N” and “N + 1” indicate the old and new time-step, and min(a, b) is the smaller value of either a or b. The available oceanic heat content for melting Cw (J) is given by

The heat capacity of the ice q is given by

and  is the freezing temperature of sea water.
3.1.4. Atmosphere-ocean heatfluxes through ice-free areas
In ice-free areas, atmospheric heat fluxes lead to changes in the upper-layer oceanic temperatures:

where  is the time-step (1 hour),
 is a relaxation time constant and TAir is the air temperature. If oceanic temperatures are cooled to temperatures below the freezing point, new ice is formed according to a growth law by Reference StefanStefan (1889) and the ocean is kept at its freezing temperature. Ice formation according to Stefan is given by

where kI
is the thermal conductivity of sea ice and  is the temperature difference between the air and surface ocean layer. Assuming constant thermal conductivity in the ice during the time-step, the effective time to create new ice is

Integrating Equation (17) over the effective time teff yields

Ocean temperature, salinity and ice compactness are then adjusted according to


where h0 is a fixed demarcation thickness between thin and thick Lee (taken to be 0.5 m as in Hibler, 1979). The sea ice in this model has no capacity to store heat or salt. in a multilayer sea-ice/snow model, ice temperatures and remaining salinities could be computed, an obvious improvement that will be incorporated in future work.
3.1.5. Atmosphere-ocean heat fluxes through non-compact ice
In cases of non-compact (only partly ice-covered) areas, the oceanic temperatures are allowed to adjust to atmospheric heating in proportion to the ice-free area of the cell (only for  ).

3.1.6. Growth of existing ice by atmospheric heat fluxes
In cases of existing ice and atmospheric temperatures below the freezing point of sea water, sea-ice thickness, compactness and internal ice pressure Pi (sec Equation (30)) are computed as


where

3.2. Dynamics of ice circulation
The computation of the dynamics is divided into two parts, the ice momentum equations and the ice continuity equations. These two parts are described in the following. For further details the reader is referred to Hibler (1979) and references therein.
3.2.1. Ice momentum equations
The dynamical part of the sea-ice model consists of the following momentum equation

Here is the two-dimensional ice velocity, kisa vertical unit vector, f is the Coriolis acceleration, g is the gravitational constant,
 , and Tw are wind and water stresses,
 are the forces due to variations in the internal ice stress and
 is the sea-surface elevation.
The internal ice stress is modelled in analogy to a nonlinear viscous compressible fluid obeying the constitutive law

where  is the two-dimensional stress tensor,
 is the strain-rate tensor, PI
is an ice-pressure term,
 and
 are non-linear bulk and shear viscosities and
 is the Kronccker
 and where

Using this constitutive law, the force components due to internal ice stress  are

Following Hibler (1979), we define

The ice pressure Pi is taken to be a function of compactness and thickness to couple the ice strength to the ice-thickness characteristics

where p* =5 X 10³ Nm −2and c = 20.0 are empirically derived constants, ey is the ratio of lengths of the principal axes of the yield ellipse and set to the value of 2.
The momentum equations (29) are solved implicitly because of the large viscosities  and
 . The solution is achieved with a successive over-relaxation technique and Chebyshev acceleration.
3.2.2. Ice continuity equations
The following continuity equations are used to compute changes in ice thickness and compactness


The thermodynamic source functions indicated here only by Sh and SA are computed in the thermodynamic part of the sea-ice model. The continuity equations are solved numerically with an upstream scheme.
4. Results
The horizontal stream function shows the topographic steering of the Antarctic Circumpolar Current (ACC) in the Southern Ocean (see Fig. 2). Strong flow convergences can be seen near the Campbell Plateau southwest of New Zealand and in Drake Passage. Flow divergence is most prominent just east of the Campbell Plateau and on encountering the Southwest Indian Ridge. The maximum transport through Drake Passage is about 130 Sv (1 Sv = 106 m3 s−1) with a seasonal variation of 5 Sv. The time mean transport is close to recently observed transports on WOCE (World Ocean Circulation Experiment) section SR3 (from Tasmania to Antarctica at 140° (personal communication from S. Rin-toul, 1997)), and in good agreement with earlier measurements in Drake Passage (Reference Whitworth and R. G.Whitworth and Peterson, 1985). The transport variability is much smaller in the model due to the coarse resolution, the monthly mean forcing fields and the relaxation of the density throughout the water column with a time-scale of half a year. Both the Weddell Sea Gyre and Ross Sea Gyre have transports of around 30Sv. The density relaxation ("robust-diagnostic simulation") in deeper layers of the ocean can also lead to a suppression of vertical motion and overturning (Toggwciler and others, 1989) by enhancing the deep stratification. This effect does not seem to have a strong impact on the results presented here.
Instantaneous barotropic stream function in southern winter. Units are Sverdrup (1Sv= 106m3s-1).

Time evolution of sea-ice area in the sector model (solid line) compared to satellite estimates (dashed line). The area (ordinate) is given in m2, and the time (abscissa) indicates the month.

The seasonal evolution of the sea-iee area is shown in Figure 3. Compared to a typical annual cycle of sea-ice area from Scanning Multichannel Microwave Radiometer (SSMR) satellite observations (Reference Gloersen, Campbell, Cavalieri, Comiso, Parkinson and ZwallyGloersen and others, 1992) the model results compare quite well, except for a too small maximum injuly-August. This difference in maximum ice cover probably results in a smaller than observed minimum in austral summer. Besides the restricted ice growth around July, the gradients of the time evolution are similar to the observed gradients. The detailed horizontal sea-ice distributions for the times of maximum and minimum sea-ice area I see Fig. 4), however, differ quite considerably from the satcl-lite observations (see Gloersen and others, 1992). The model creates a relatively thin ice cover of around 0.5 m, except for the thicker ice in theWcddcll Sea (~2.2m) and Ross Sea (~1.9m). The average sea-ice thickness produced by the model compares reasonably well with the limited observations of undeformed Antarctic sea ice (e.g. Reference Allison and WorbyAllison and Worby, 1994)
Sea-ice thickness distribution at times of (a) maximum and (b) minimum sea-ice area. Units are cm. Contour interval is 10 cm.

Unrealistically large open-ocean polynyas are most likely the result of a too strong vertical mixing, i.e. the sea-ice/ocean system exhibits a thermal-mode behaviour (see, e.g., Reference Gordon and HuberGordon and Huber, 1990; Reference MartinsonMartinson, 1990; Reference Marsland and WolffMarsland and Wolff, 1998). in contrast to the stable mode, where a thin mixed layer of cooler, fresher water is separated from the warmer, saltier deeper waters by a strong pycnocline, the thermal mode is characterized by a mixed layer with water-mass properties close to the deeper waters'. Brine rejection during initial ice growth in combination with a weak strati-fication leads to continual vertical convection, thus replacing colder, saltier surface waters almost instantaneously with warmer, fresher deep waters. The associated ocean-heat flux limits the ice growth. Figure 5 shows the typical structure of temperature and salinity in the thermal mode along a meridional section at 150° E. in the sea-ice zone (polewards of 60° S)the stratification is extremely weak and there is virtually no observable mixed layer. in the upper 500m the salinities and temperatures are almost homogeneous, indicating strong vertical mixing under the sea ice. Sensitivity lests with the ocean/sea-ice model in a regional study (Mars-land and Wolff, 1998) have indicated that precipitation is a key factor in triggering and controlling the thermal- or stable-mode behaviour of the sea-ice/ocean system.
Meridional sections from 35° s to Antarctica at 150°E. (a) Temperature in °C (contour interval PC) and (b) salinity in psu) contour interval 0.1 psu). The top portion of each panel shows the upper 500 m of the ocean, and the lower portion shows thefull vertical water column.

5. Conclusions
The coupled ocean/sea-ice model is driven by atmospheric fluxes of momentum, heat and fresh water from monthly mean climatologies. The circulation in the Southern Ocean is typical of the flow in a coarse-resolution model, with a reasonable mean flow and little variability. The ocean/sea-ice interaction is dominated by a thermal-mode behaviour with strong vertical mixing, resulting in relatively thin ice and weak stratification in the upper ocean. The seasonal evolution of total sea-ice area is similar to estimates from satellite observations, indicating that this integral value is relatively independent of the actual smaller-scale interactions. A comparison of total ice volume between model and observations would show bigger differences.
This study demonstrates again that the seasonal sea-ice cover in the Southern Ocean is the result of a complicated interaction between atmosphere and ocean. A slight misrepresentation of heat or fresh-water fluxes can lead to a distinctly different behaviour of the coupled system, and much improved climatologies of the meteorological variables are needed to better simulate the sea-ice cover in a coupled ocean/sea-ice model.
Acknowledgements
I would like to thank M. England, A. Hirst, V. Lytle and R. Massom for valuable comments that helped to improve the manuscript.



