Introduction
The first evidence of human life, documented in the east African Olorgesailie Basin, comes from ~1.2 million years ago (Potts et al., Reference Potts, Behrensmeyer, Faith, Tryon, Brooks, Yellen, Deino, Kinyanjui, Clark, Haradon, Levin, Jeijer, Veatch, Owen and Renaut2018). Recent archeological research found tools and evidence of the use of red and black ochers (oxides and clay) used by Homo sapiens between 320,000 and 305,000 years ago. Carretero et al., (Reference Carretero, Gomes, Tateo, Bergaya, Theng and Lagaly2006) wrote that “homo erectus and homo neanderthalensis used ochers mixed with water and different types of mud to cure wounds, to soothe irritations, as a method of skin cleaning, etc.” In ancient Greece, Pharohs used clays as anti-inflammatory agents, because of their highly absorbent properties, and to this day Dead Sea muds are used for cosmetic purposes, with some evidence for antibacterial properties arising from the large salt and sulfide content of the mud (Ma’or et al., Reference Ma'or, Henis, Alon, Orlov, Sørensen and Oren2006). Many other ancient civilizations formed clay into medallions and traded them for medicinal uses ((Finkelman, Reference Finkelman2006; Finkelman, Reference Finkelman2019), this issue). Terra Sigillata, meaning ‘signed earth,’ is an example of a clay stamped with a seal from the first century A.D., and traded for use on a variety of ailments, but primarily taken orally to absorb poisons (Reinbacher, Reference Reinbacher2003).
The study of clays used in the Medicinal Arts is an ancient pursuit first documented in the writings of Greek and Roman philosophers: Aristotle (fourth century BC), Pliny the Elder and Dioscorides (first century AD), and the Roman Galen of Pergamon (second century AD) (Williams & Hillier, Reference Williams and Hillier2014). The early uses of clays for health primarily utilized their physical properties of fine particle-size, significant absorption capacity, and plasticity that allowed for protection of wounds. Anthropologist Berthold Laufer (Reference Laufer1930) wrote of the uses of clays for health benefits from indigenous cultures worldwide. He recognized that clays used medicinally were, “almost without exception fine, fat and usually ferruginous.” This observation can be interpreted from what has been learned in recent years (2004–2018) as containing significant components of nanoparticulate, expandable, and Fe-bearing clays (Williams & Hillier, Reference Williams and Hillier2014).
Healing clays
Therapeutic
Healing clays include a wide range of clays (nano-minerals) that may have physical properties that soothe certain ailments, like arthritis or edema (swelling). A clay with high heat capacity allows topical applications (pelotherapy) to stimulate blood circulation, exchange of cations (e.g. K, Na, Ca) through skin pores and hair follicles (Cygan et al., Reference Cygan, Ho and Weiss2002; Gomes, Reference Gomes2013; Tateo et al., Reference Tateo, Ravaglioli, Andreoli, Bonina, Coiro, Degetto, Giaretta, Orsini, Puglia and Summa2009), and swelling clays (smectite) or tubular minerals (e.g. halloysite or zeolite) are useful for adsorption of excess fluids, thus reducing edema (Cervini-Silva et al., Reference Cervini-Silva, Nieto-Camacho, Palacios, Montoya, Gómez-Vidales and Ramirez-Apán2013; Cervini-Silva et al., Reference Cervini-Silva, Nieto-Camacho, Kaufhold, Ufer, Palacios, Montoya and Dathe2016).
Consumed
Geophagy, which is the deliberate consumption of earth materials for medicinal or spiritual healing, is a social practice that has been observed in cultures worldwide (Ferrell, Reference Ferrell2008; Wilson, Reference Wilson2003; Young, Reference Young2011). Kaolins are most commonly consumed, because they are well known adsorbents that adhere to the stomach lining when ingested adsorb excess fluid, and decrease the effect of enteric bacteria. For example, the original formulation of Kaopectate™ contained kaolinite and later attapulgite. A similar mineral named ‘eko’ was used in Nigeria for indigestion (Vermeer & Ferrell, Reference Vermeer and Ferrell1985), and the famous Georgia clay known as “down home Georgia white-dirt” is sometimes kaolinite, mined in Georgia (Kogel, Reference Kogel2014) but has also been identified as calcium carbonate chalk (Williams & Hillier, Reference Williams and Hillier2014). Other types of clays consumed include halloysite (favored by animals), montmorillonite, and admixtures of carbonates and oxyhydroxides. Young (Reference Young2011) suggested that the craving for clay consumption may be driven by a need for nutrients derived directly from the mineral, but more likely is a means of gastrointestinal protection and detoxification. These are examples of ‘healing’ clays that may or may not be antibacterial. Clearly, a physical component to the healing exists, and possibly a chemical effect in the case of nutrient exchange.
Antibacterial
Antibacterial clays are those that are shown to explicitly diminish bacterial populations, as opposed to bacteriostatic substances that simply prevent growth. A drug is considered bactericidal if it reduces 99.9% of a bacterial population; a ≥ 3 log10 reduction in colony-forming units (CFU) (CLSI, [formerly National Committee for Clinical Laboratory Standards: NCCLS], 1999). Most of the antibacterial clays documented in the last decade are Fe-bearing clays (Williams, Reference Williams2017). The interactions of microbes with Fe-bearing clays have been well documented in geological environments (Maurice & Warren, Reference Maurice, Warren, Maurice and Warren2006), as many environmental microbes utilize Fe for energy (Dong et al., Reference Dong, Fredrickson, Kennedy, Zachara, Kukkadappu and Onstott2000; Ernstsen et al., Reference Ernstsen, Gates and Stucki1998; Kim et al., Reference Kim, Dong, Seabaugh, Newell and Eberl2004; Kostka, et al., Reference Kostka, Dalton, Skelton, Dollhopf and Stucki2002; Maurice & Warren, Reference Maurice, Warren, Maurice and Warren2006). Such environmental microbes commonly acquire the energy they need by reduction of Fe(III) in minerals to Fe(II) (Ferris et al., Reference Ferris, Fyfe and Beveridge1987) requiring electron transfer to form the reduced Fe(II). Under reduced and acidic (pH < 5) environmental conditions, many metals are soluble and, therefore, aqueous solutions in contact with the minerals may acquire increased concentrations of these metals. Hydration of metals (e.g. Fe and Al) produces H+, thus increasing the acidity of the fluid (Morrison et al., Reference Morrison, Misra and Williams2016; Pearson, Reference Pearson1966). Many environmental microbes, therefore, have evolved to thrive in such acidic environments as are produced by acid mine drainage (Fortin & Beveridge, Reference Fortin and Beveridge1997; Haack & Warren, Reference Haack and Warren2003; Nealson et al., Reference Nealson, Belz and McKee2002).
Alternatively, human/animal pathogens have evolved to live in circum-neutral pH and relatively oxidizing conditions common to human body fluids, and so, not surprising, a reduced Fe-bearing mineral, stable in acidic and low Eh fluids, might conflict with the favored environment of human pathogens. The question is, then, when such minerals combine with human pathogens, what reactions occur, and which entity (mineral or microbe) dominates to drive those reactions?
French Green Clay: A Case Study
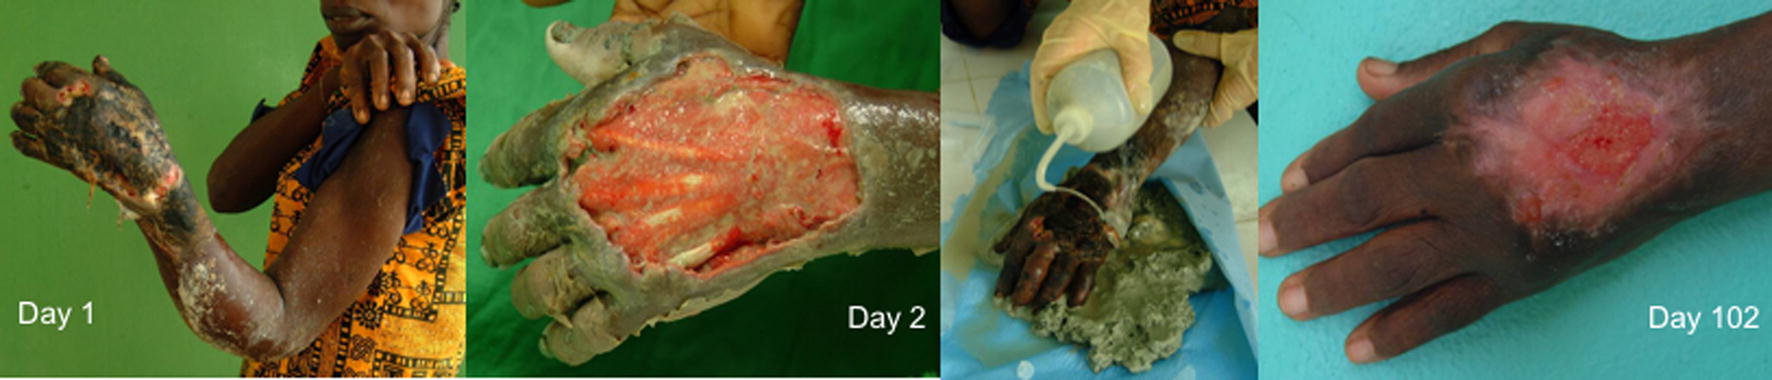
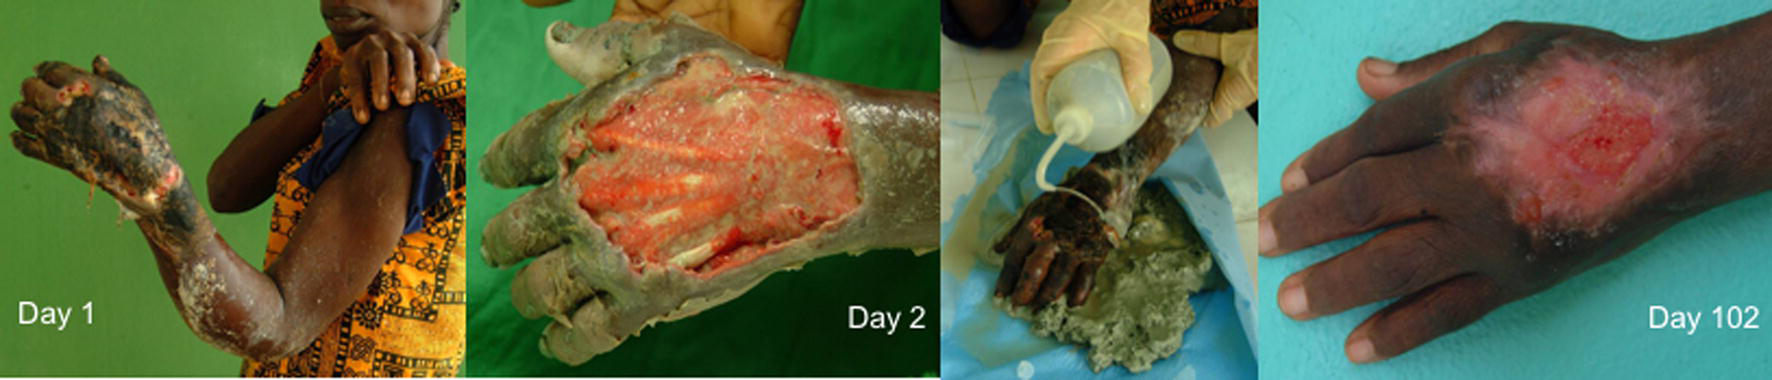
An example of the antibacterial and healing properties of clays was documented by a case study of French green clays used to heal an infection for which there was no antibiotic treatment (Williams et al., Reference Williams, Holland, Eberl, Brunet and Brunet de Courrsou2004). A French philanthropist named Line Brunet de Courssou was on a diplomatic mission with her husband to the Ivory Coast (Cote d’Ivoire), West Africa. There she observed indigenous people suffering from Buruli ulcer, a ‘flesh-eating’ mycobacterial infection that occurs without an inflammatory response by the immune system (George et al., Reference George, Chatterjee, Gunawardana, Welty, Hayman, Lee and Small2002). The infection is caused by Mycobacterium ulcerans, a slow growing pathogen (28 day doubling time in vitro) that is an extracellular parasite and derives energy from lipids beneath the stratum corneum of the skin. Courssou knew that the green-colored clays where she grew up in France (near the Massif Central) had helped to heal scrapes and stings quickly, so she imported the French green clays and applied them to the wounds caused by Buruli ulcer in Africa. Two different ‘green clays’ were purchased from French suppliers (Argiletz and Argicur Inc.) and used for this treatment (Haydel et al., Reference Haydel, Remenih and Williams2008; Williams et al., Reference Williams, Haydel, Giese and Eberl2008). Photographic documentation (by Thierry B runet) was made of the healing progress as clay poultices (clay mixed with water) were applied and changed daily using a saline wash (Fig. 1). The initial application of clay debrided the infection in 24 h with complete healing of wounds over a period of a few months. Prior to 2002, no antibiotic cure for the infection was available, with excision or amputation of the infected area being the only remedy, and often the infection re-appeared after months. However, after the clay treatment the infection did not reoccur (Williams et al., Reference Williams, Holland, Eberl, Brunet and Brunet de Courrsou2004).
Line Brunet de Courssou, a French researcher, documented healing of Buruli ulcer in patients from the Ivory Coast, using French green clay poultices applied daily and cleansed with saline solution between dressings. The M. ulcerans infection, unresponsive to known antibiotics at the time, was cured by the clay treatment (photos by Thierry Brunet)
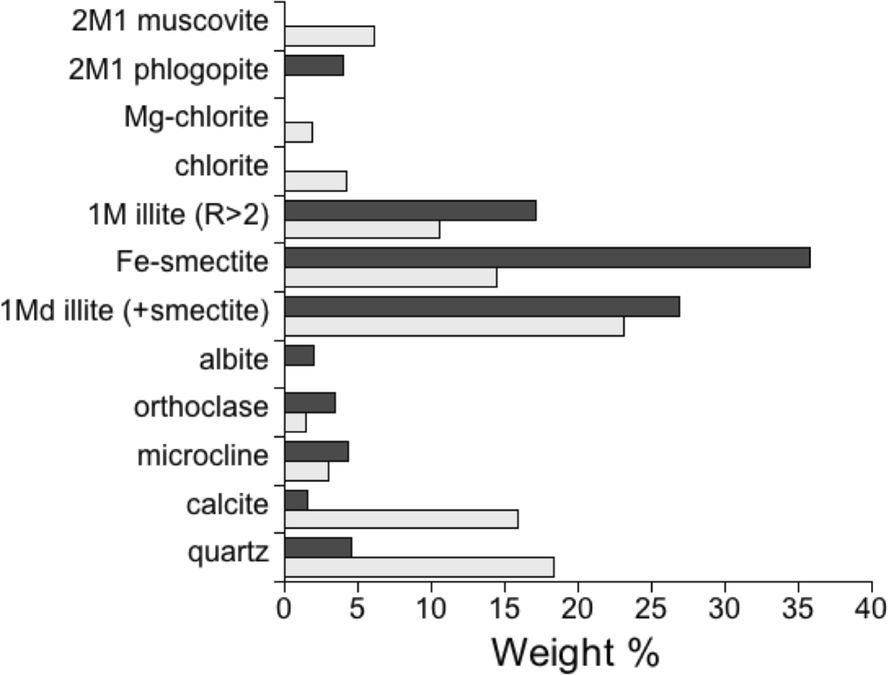
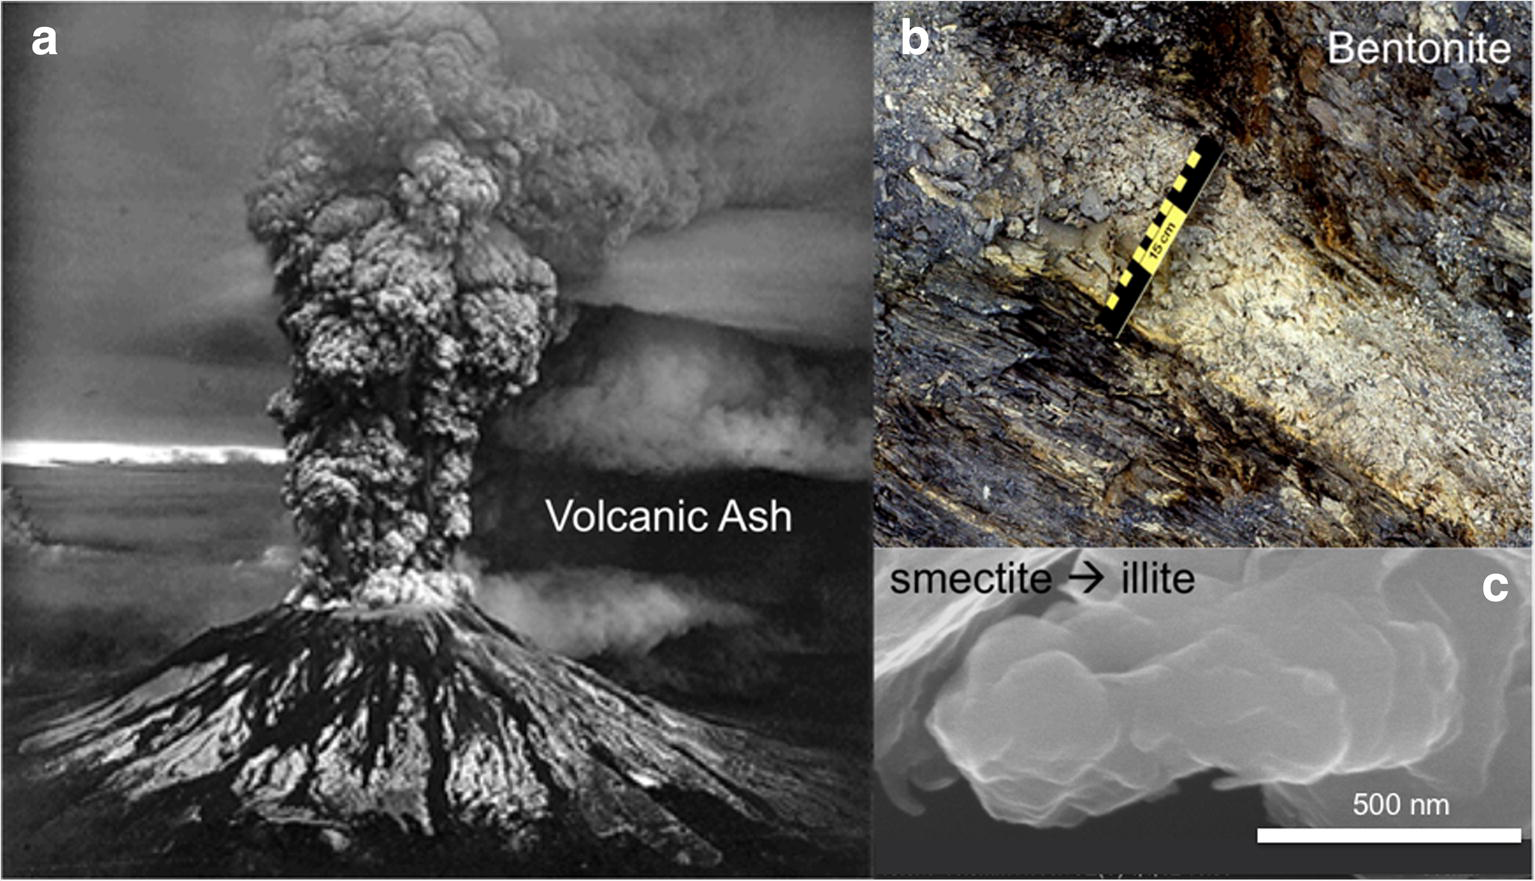
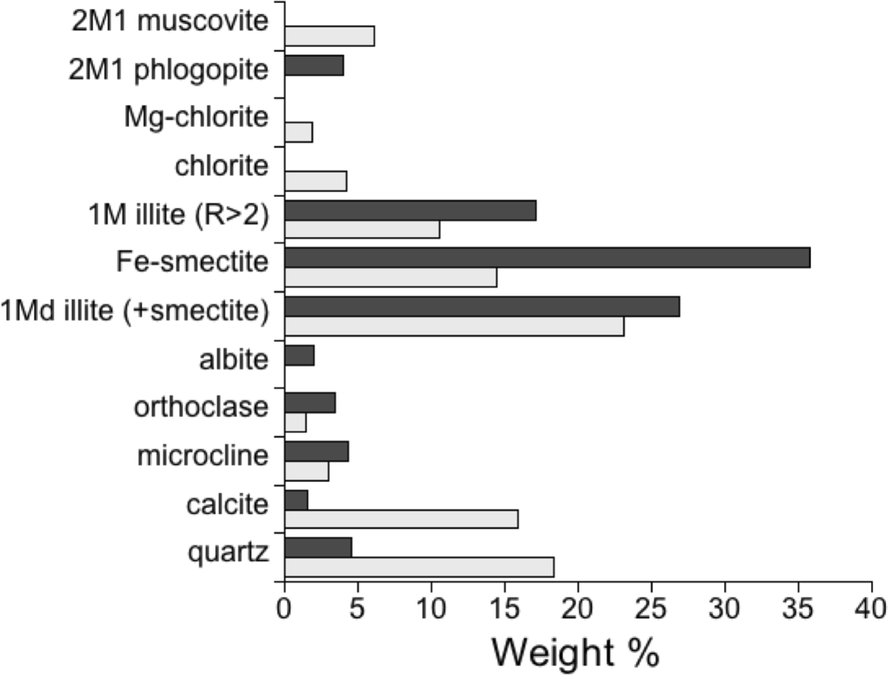
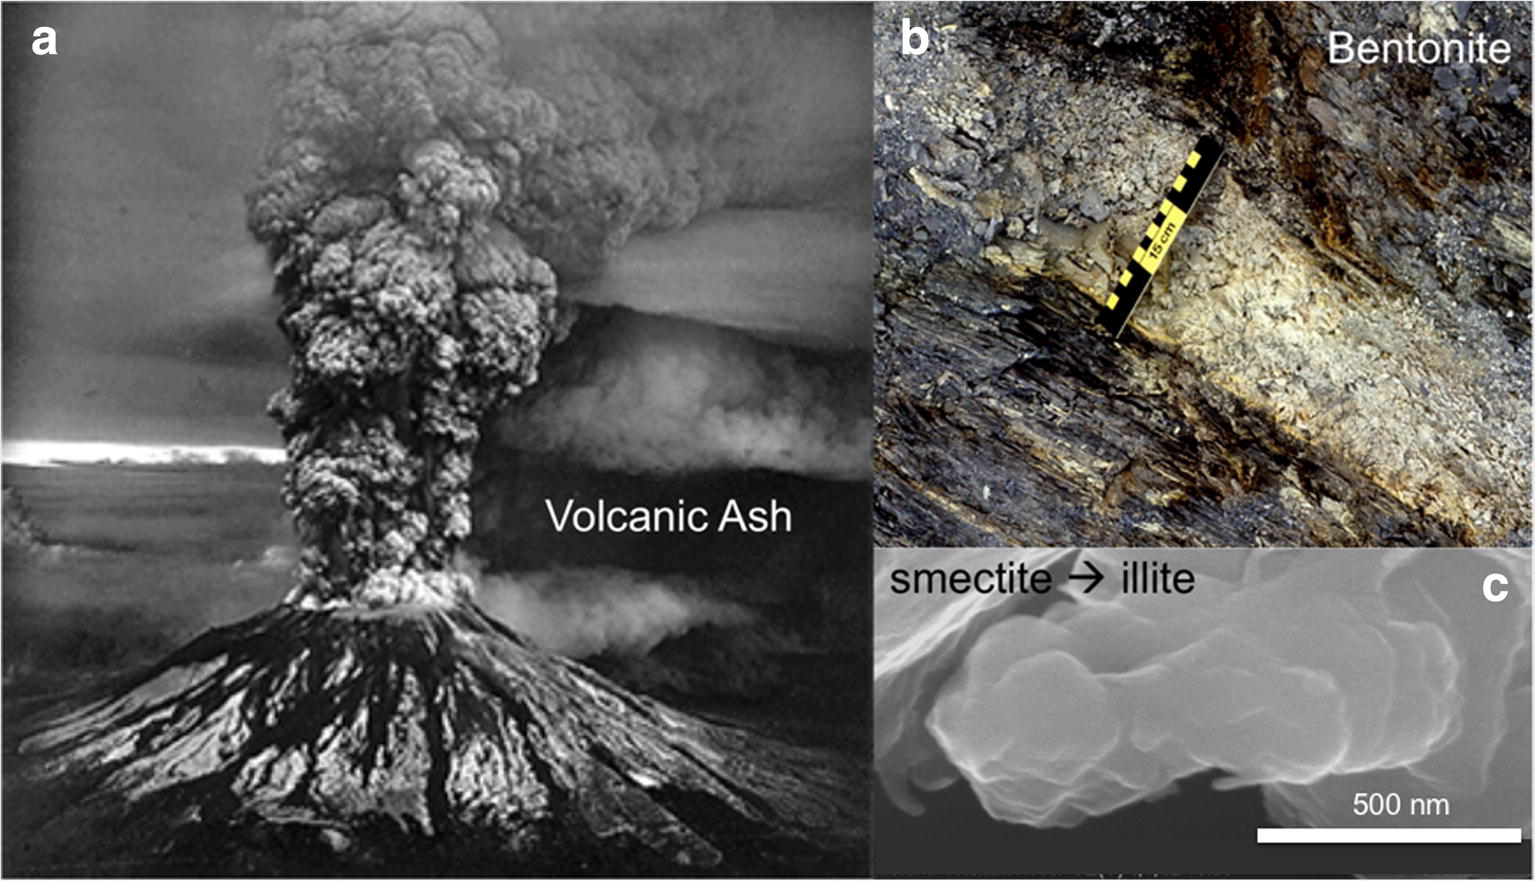
The two French green clays that were used in this case study were mineralogically very similar, consisting primarily of reduced Fe-smectite and mixed-layered illite-smectite (Fig. 2), with minor quartz, feldspar, and micas. Only one of the two clays contained significant calcite, and in vitro testing of this clay against a broad spectrum of pathogenic bacteria showed it to be less effective (Williams et al., Reference Williams, Haydel, Giese and Eberl2008). Another characteristic of note was that both French green clays had an unusually small particle size, with illite-smectite showing an average diameter of ~200 nm (Fig. 3). The clays were thought to be lake deposits of volcanic ash (bentonite) from the Massif Central, which formed layers enriched in reduced Fe acquired from hydrothermal fluids related to the volcanic activity. The ash (glass) was altered first to smectite, then with increasing temperature through burial, altered to illite. The puzzling result of this study was that one of the two clays killed a broad spectrum of human pathogens, while the other did not (Haydel et al., Reference Haydel, Remenih and Williams2008). The physicochemical properties that made one clay antibacterial but another mineralogically similar clay ineffective at killing the pathogens was the topic of the next decade of research on ‘what makes clays antibacterial?’
Summary of the mineralogy of two French green clays used to treat Buruli ulcer in the Ivory coast (Argicur = dark bars; Argiletz = light bars) (reproduced, with permission, from Williams, Reference Williams2017)
(a) Volcanic ash deposits, (b) bentonite and hydrothermal fluids alter pyroclastics to produce (c) smectite, which incorporates reduced metals and with increasing temperature forms illite. The antibacterial clays contain primarily mixed-layered illite-smectite, but some kaolinites have also been found to be antibacterial (Lodoño et al., Reference Londoño, Hartnett and Williams2017): Bentonite photo (b) by W. Crawford Elliott)
Physical and Chemical Properties of Antibacterial Clays
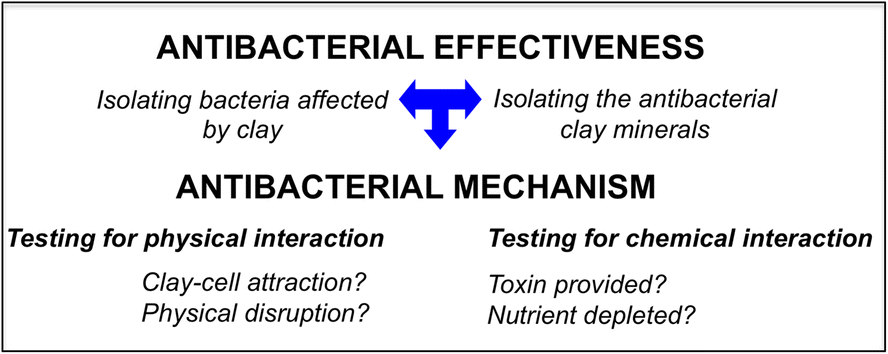
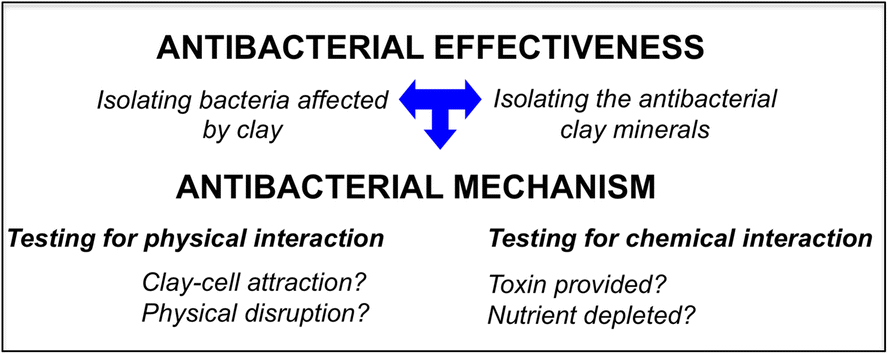
A strategy for studying the general antibacterial mechanism of natural clays began empirically (Fig. 4). The goal was to: (1) identify what types of bacteria were susceptible to reduction of their population by clay; and (2) identify what types of clay minerals (or clay assemblages) killed the bacteria. Especially important to recognize is that both physical and chemical properties of clays can damage bacterial cells or human tissues.
Flow chart showing the approach to studying what makes clays antibacterial (after Konhauser & Urrutia, Reference Konhauser and Urrutia1999)
Physical properties
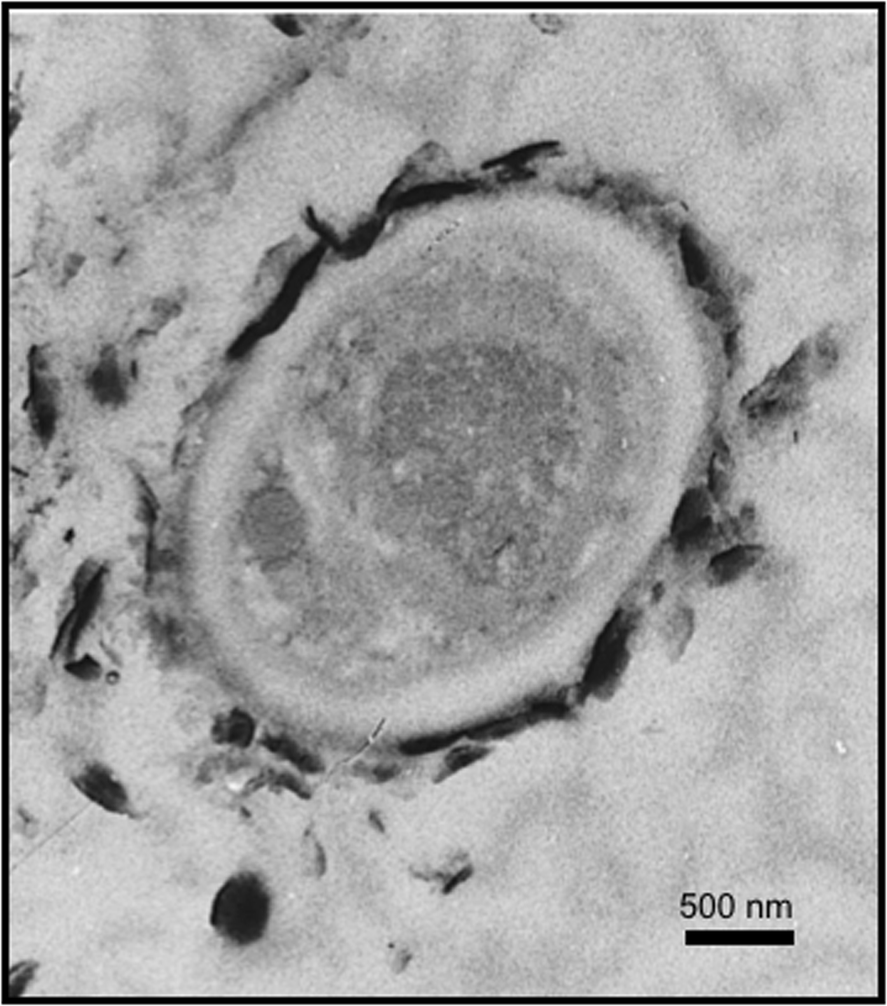
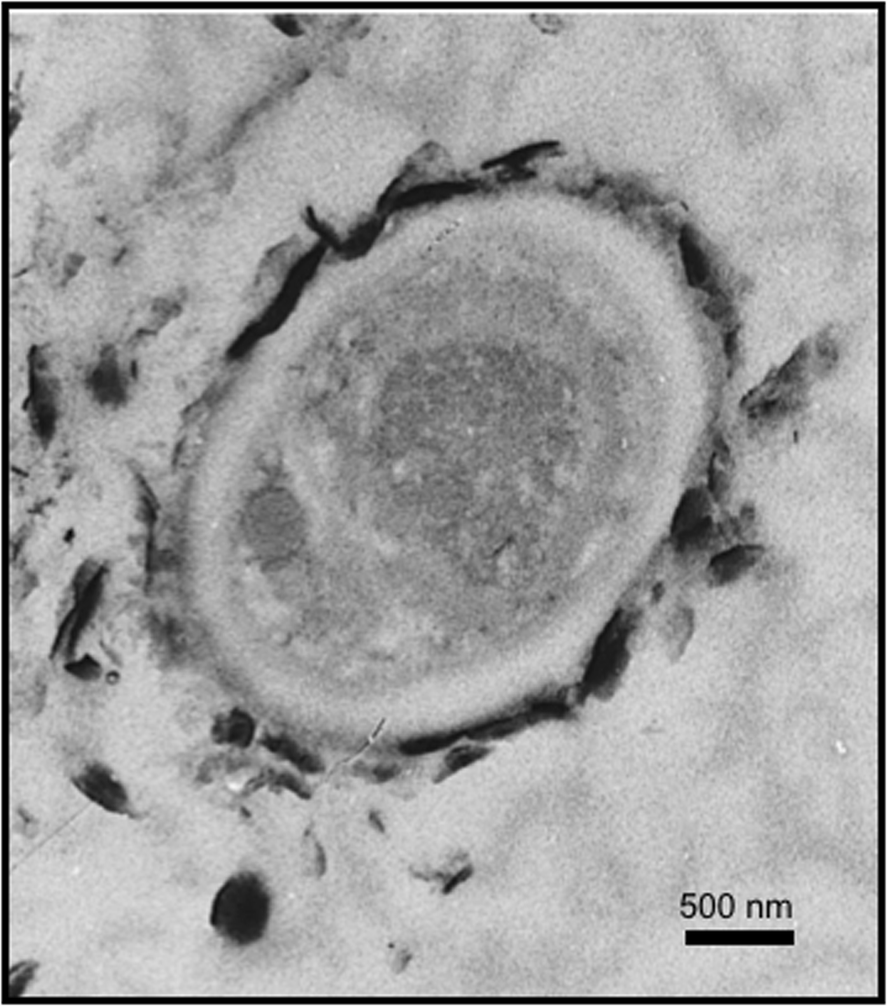
Physical damage to bacteria might occur due to the mineralogical textures present in a clay-mineral assemblage, e.g. fibrous needles might penetrate the cell membrane, causing tearing or penetration of the phospholipid membranes by minerals, and in some cases, bacteria can be encased by clay particles (Fig. 5), blocking their essential nutrient uptake or efflux of waste products, basically impeding respiration (Ferris et al., Reference Ferris, Fyfe and Beveridge1987; Konhauser & Urrutia, Reference Konhauser and Urrutia1999).
Transmission electron microscope image of a cyanobacterial cell encrusted in clay minerals oriented tangentially to the surface (after Konhauser & Urrutia, Reference Konhauser and Urrutia1999)
Clearly, each mineral in the <2 μm clay assemblage must be considered, as each mineral has attractive (or repulsive) forces between its surface and the microbes. In hydrated clay, each mineral has a zero point of charge (zpc), the pH condition in which the surface charge of the mineral is zero (Sposito, Reference Sposito1980). This property of minerals in the clay plays a role in buffering the pH of the water added to hydrate the clay. A fluid with pH higher than the zpc of a mineral will become more acidic as the OH− groups are attracted to H+ on the clay surface and vice versa. This phenomenon can become complicated in a fluid that has a variety of chemical species that form ligands so that a molecular form of a cation may become net negative. It is also complicated by the nature of clays being an assemblage of multiple minerals (various phyllosilicates, quartz, feldspar, etc.). The charge-balance of a hydrated clay will also depend on the ratio of mineral surface volume to fluid volume, but in the case of fine clay minerals used medicinally (e.g. in a poultice), the surface area of the mineral is generally large enough to control (buffer) the fluid pH. The mineral assemblage in this case has the greater effect on attractive forces to the bacterial surface.
The zeta potentials (surface potential energy at the solid--liquid interface) of the clay and bacteria are parameters that can be measured to test for physical interactions of their surfaces (Walker et al., Reference Walker, Flemming, Ferris, Beveridge and Bailey1989). It can also influence the precipitation of metals from solution onto cell membranes (Fein et al., Reference Fein, Daughney, Yee and Davis1997). When dealing with clay-mineral assemblages, the zeta potential can be quite variable because it is an average of the multi-mineral suspension of all the minerals, and the interactions of anions and cations in the solution. Nonetheless, if a natural mineral assemblage kills pathogenic bacteria; the physical forces of attraction must be examined on the whole assemblage because isolating any one mineral would bias the results (Williams, Reference Williams2017). The surface chemistry of minerals depends on the composition of the fluids in contact with them; It is important, therefore, when measuring the attractive forces potentially involved in antibacterial action, to simulate the chemistry of the fluid equilibrated with the mineral assemblage being studied.
Most studies of antibacterial clays have focused on what reactions take place within 24 h. This time frame was chosen initially because of the results of the French green clay case study (Williams et al., Reference Williams, Holland, Eberl, Brunet and Brunet de Courrsou2004) in which the mycobacterial infection was healed by changing the clay poultice daily. It is certainly possible that some mineral effects on bacteria take longer than 24 h and this should always be considered when studying a new microbe or other pathogen (fungus or virus). The period of time for equilibration of the mineral with water will affect the fluid ionic strength, therefore, as mentioned above.
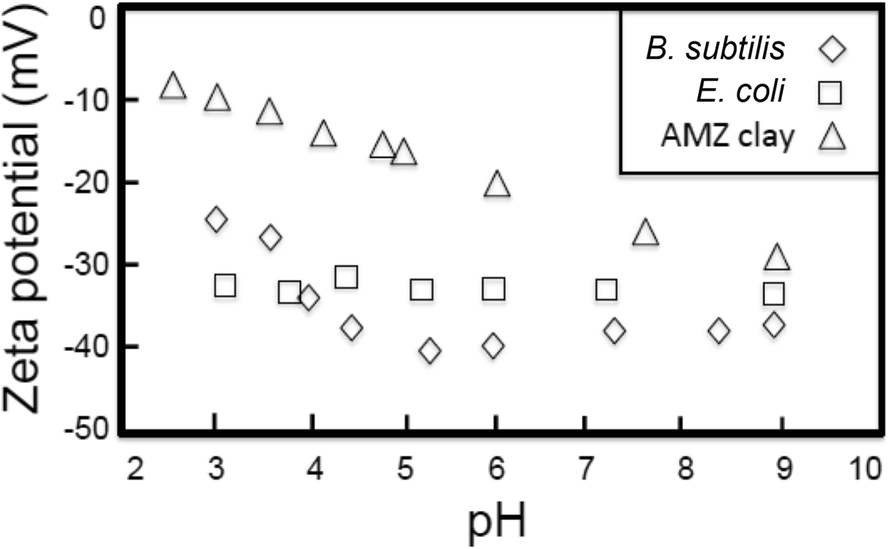
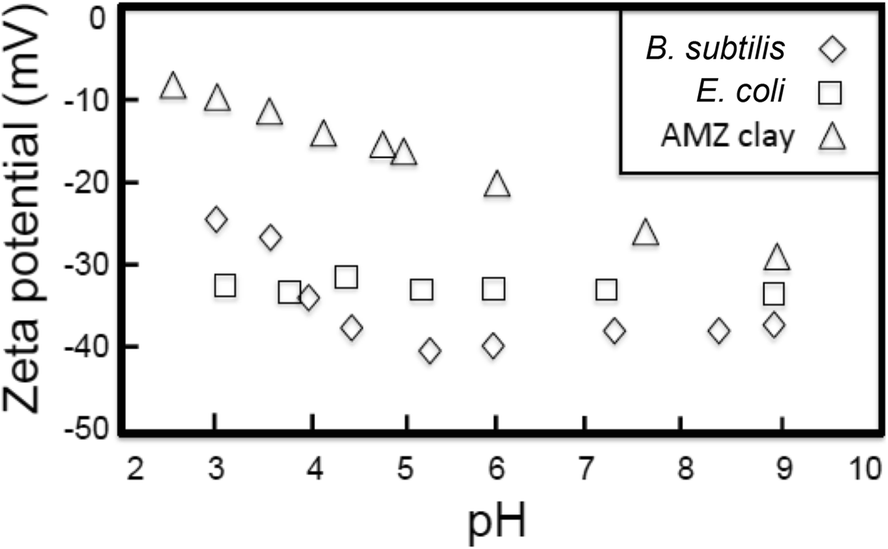
Zeta potential measurements should replicate the concentration of ions produced by equilibration with natural clay. For example, Londoño and Williams (Reference Londoño and Williams2016) studied an antibacterial clay from the Colombian Amazon (AMZ) near Araracuara (Hoorn, Reference Hoorn1994) which is dominated by kaolins and smectite with very low Fe contents (~3 wt.%). Zeta potential measurements were taken over a range of pH in order to evaluate the energy changes resulting primarily from attraction of H+ or OH− to the mineral or bacterial surfaces. This clay showed significant dissolution textures of the moderately disordered kaolinite increasing the salinity of the equilibrated water. The physical attraction of the clay to a Gram-negative (Escherichia coli) and Gram-positive (Bacillus subtilis) bacteria was tested by measuring the zeta potential of each. The zeta potential (Fig. 6) was negative for all surfaces over the pH range of ~3 to 9, indicating that a repulsion should occur between the minerals and bacteria. The aqueous suspension of the clay is buffered naturally to a pH of ~4.6 where repulsion of greater than −17 mV was found between the clay and the bacteria. While this indicates that the clay is not attracted to the bacterial surface, one must also consider that the negative surface potentials of both the clay and bacteria will affect the competition for cations that could be nutrients or toxins to the bacteria.
Measurements of the zeta potential of an antibacterial clay (AMZ from the Colombian Amazon), compared to the surface charge of Gram-negative (E. coli) and Gram-positive (B. subtilis) bacteria in an aqueous suspension equilibrated with the clay for 24 h (after Lodoño and Williams, Reference Londoño and Williams2016)
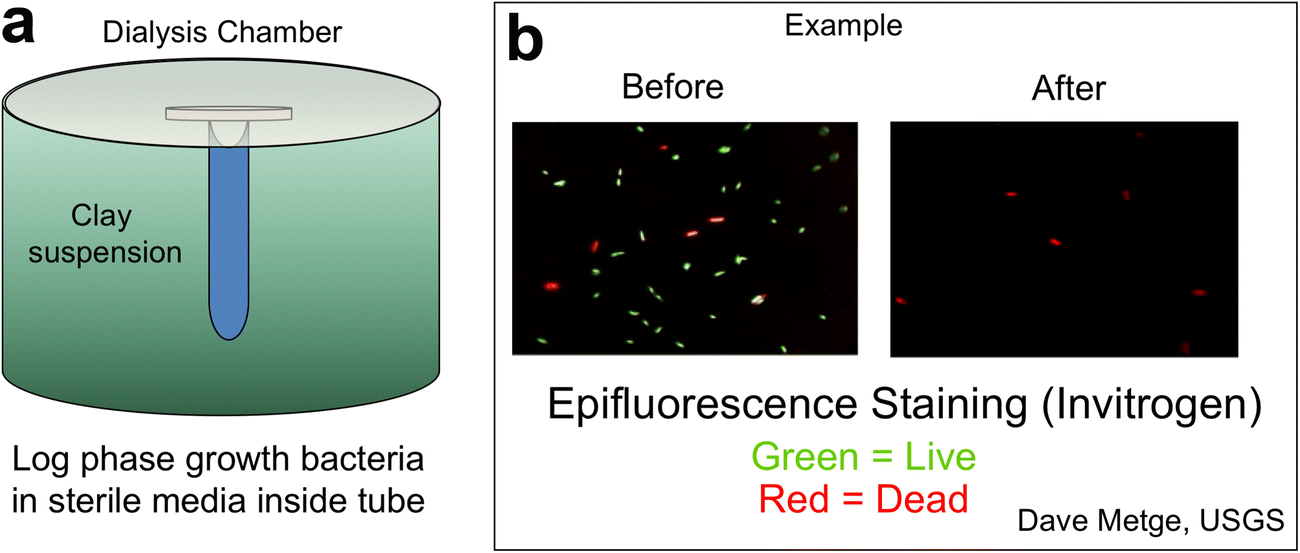
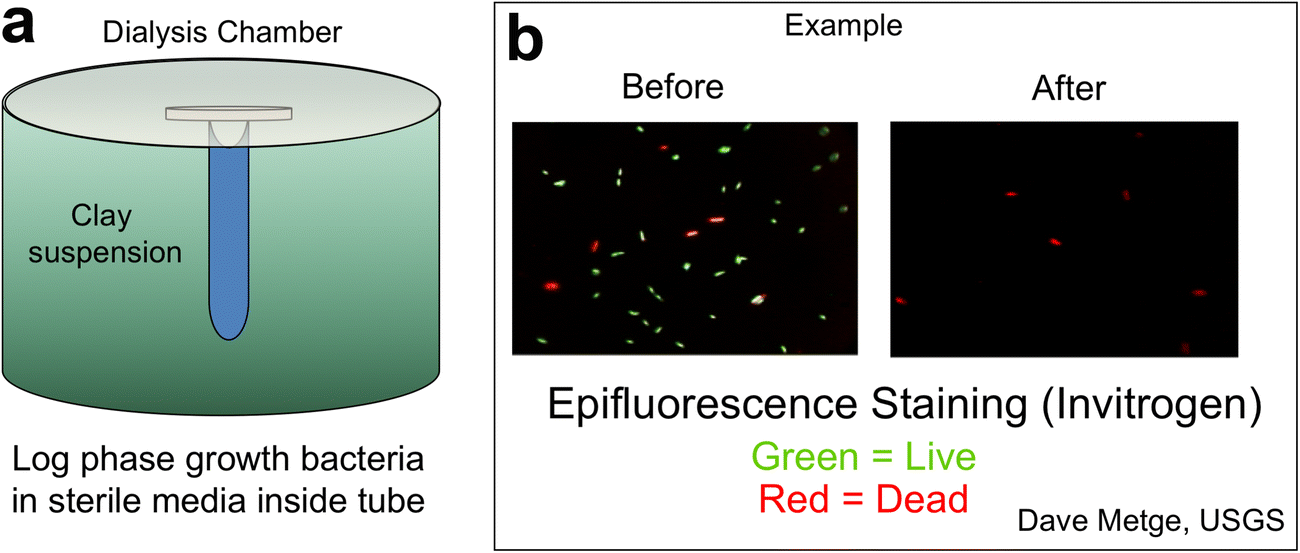
Another test for a physical effect of clay on bacteria is by isolating the two populations. For example, the French green clays were tested for physical attraction to bacteria by suspending autoclaved clay (200 mg/mL) in a beaker and then introducing E. coli (ATCC 25922) in a dialysis tube with a 25 kDa molecular weight cutoff (Fig. 7a). The E. coli were grown to log phase in Luria-Bertani broth (LB) growth media (Sezonov et al., Reference Sezonov, Joseleau-Petit and D'Ari2007), so that they were healthy before submersion in the clay suspension. This experiment allowed diffusion of elements between the hydrated clay and the bacterial suspensions. After 24 h of incubation at 37°C the viability of the bacteria was tested by live/dead cell epifluorescence staining (Invitrogen; Thermo-Fischer Scientific L7007; Fig. 7b). The suspension of antibacterial clay completely killed the bacteria (red stained), compared to live cells not exposed to the clay (green). This verified that no physical contact between the clay and bacteria was required to kill bacteria. The bacteria were killed either by a chemical transfer of toxins to the bacteria, or loss of nutrients adsorbed by the clay.
An experiment to determine if clays (in aqueous suspension) kill bacteria by chemical or physical means. (a) E. coli grown to log phase in growth media are placed in dialysis tubing precluding particle interactions but allowing chemical diffusion across the 25 kD membrane when submerged into a clay suspension. (b) Live/Dead epifluorescence staining (Invitrogen) shows the killing of bacteria after 24 h (reproduced with permission from Williams et al., Reference Williams, Metge, Eberl, Harvey, Turner, Prapaipong and Poret-Peterson2011)
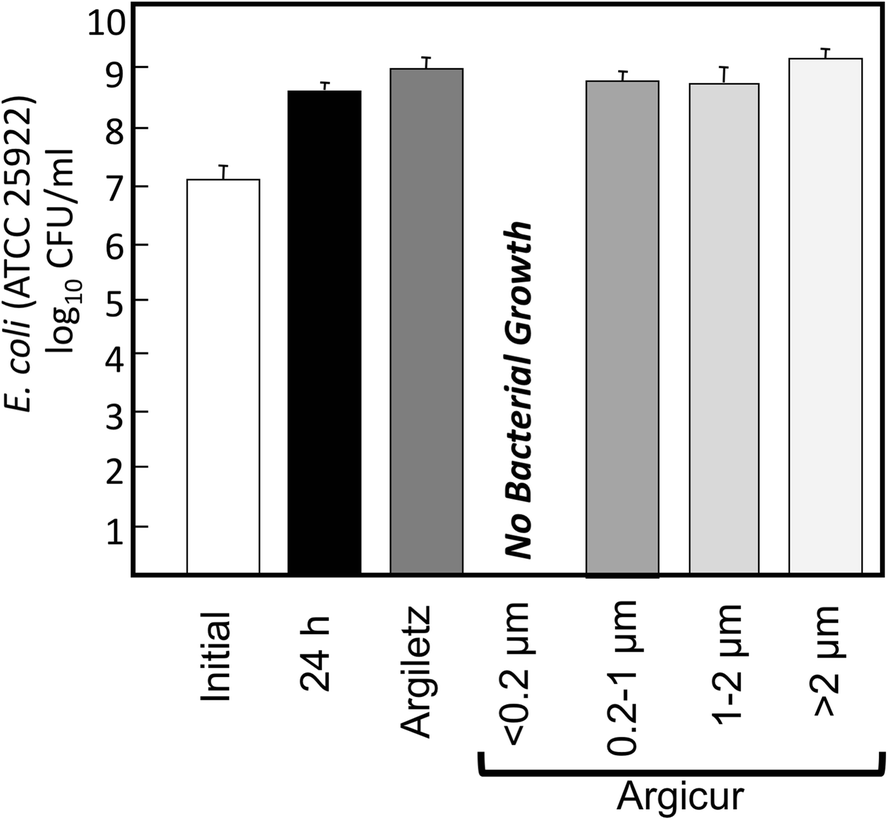
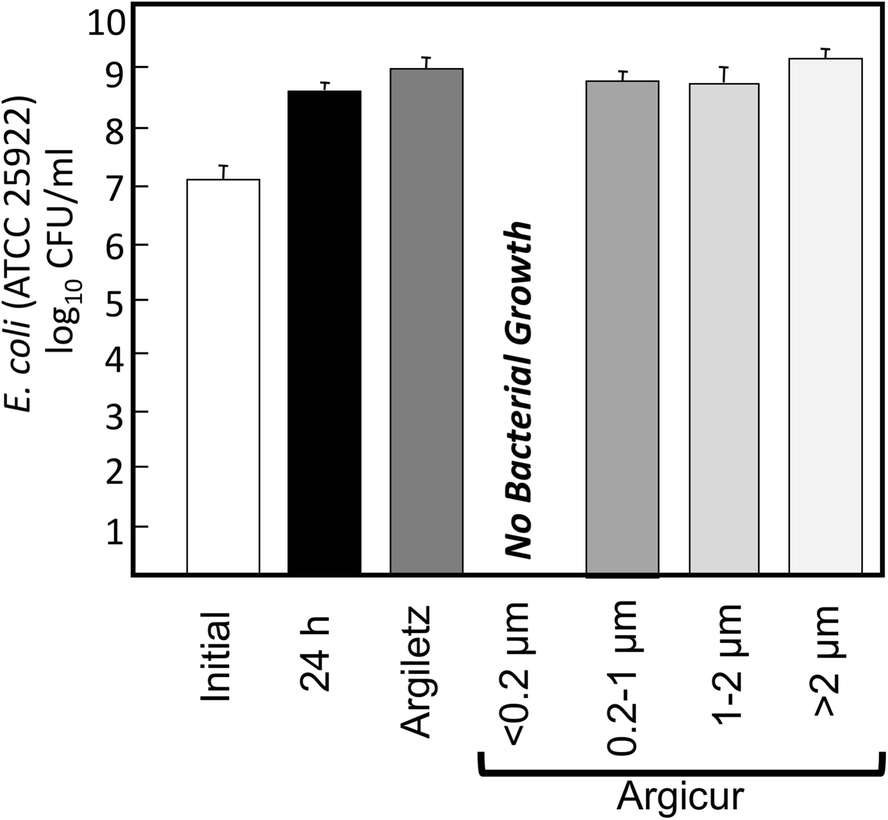
The size of the clay crystals was also shown to be of significance in antibacterial effectiveness. The French green clay case study (Williams et al., Reference Williams, Haydel, Giese and Eberl2008) recognized that the antibacterial clays were commonly very small crystals (~200 nm diameter) compared to the average clay (<2.0 μm diameter). To test the effect of particle size, the antibacterial French green clay (Argicur) was separated into <0.2 μm, 0.2–1.0 μm, 1.0–2.0 μm, and >2.0 μm size-fractions and tested for antibacterial effect against E. coli. Only the smallest size-fraction was effective in killing the bacteria (Fig. 8), whereas larger size-fractions of the clay were ineffective. The conclusion was that the greater relative surface area of the clay in the <0.2 μm size fraction was important for solubility of the minerals that provided the antibacterial reactants. Thus, the physical form of the minerals in the clay fraction also affects the chemical interactions.
Test of particle size on the antibacterial effectiveness of the French green clays against E. coli (reproduced with permission from Williams & Haydel, Reference Williams and Haydel2010)
In addition to the physical damage to bacteria, clays can also cause physical damage to the human (or animal) gastrointestinal tract, such as when excessive amounts of clay are ingested. Geophagy, the consumption of earth materials, can cause intestinal blockage with excessive doses being a function of the clay mineralogy. Even applied topically, mineral nano-particulates (<50 nm) are of concern as they can be introduced to the bloodstream, travel to lung or brain membranes, and form a clot (thrombi or emboli). In studies of various clays used in wound dressings, damage to the blood vessels by minerals can occur by adsorption and blockage, or by exothermic reactions that sometimes occur when minerals are hydrated. For example, zeolite was shown to essentially cauterize blood vessels by increasing the temperature to 100°C when hydrated in the wound (Baker et al., Reference Baker, Sawvel, Zheng and Stucky2007). While successful in stopping the bleeding, it caused excessive damage to vascular tissues requiring extensive excision and repair. Studies of various clay minerals used in hemostatic wound dressings showed that kaolinite, at a dose of only 10% on gauze, stopped bleeding in ~2 min with minimal blockage or damage to blood vessels (Lawton et al., Reference Lawton, Granville-Chapman and Parker2009; Williams & Hillier, Reference Williams and Hillier2014).
Chemical properties
Chemical effects of clays on bacteria have so far been found to dominate the antibacterial mechanism (Williams, Reference Williams2017; Williams & Haydel, Reference Williams and Haydel2010). The clay can either provide a toxin to the bacteria, or adsorb nutrients, thus robbing the bacteria of elements needed for metabolic functions. This concept of the mineral–microbe interaction is simplistic when one considers that bacteria are alive (metabolically active) and can respond to environmental stressors by sending out chemosensors that assist the bacterium in finding nutrients or suppressing toxins (Konhauser, Reference Konhauser2007; Maurice & Warren, Reference Maurice, Warren, Maurice and Warren2006). However, as a first approach to determine the effect of minerals on microbes, several investigators began testing how natural clays were capable of killing a broad spectrum of human pathogens.
Some of the underlying mechanisms for the antibacterial activity of different clays include: (1) endogenous release of clay-bound cytotoxic metals (Haydel et al., Reference Haydel, Remenih and Williams2008; Williams et al., Reference Williams, Haydel, Giese and Eberl2008; Williams et al., Reference Williams, Metge, Eberl, Harvey, Turner, Prapaipong and Poret-Peterson2011); (2) lipid peroxidation and oxidative stress (Kibanova et al., Reference Kibanova, Nieto-Camacho and Cervini-Silva2009) leading to increased membrane permeability; (3) sequestration of nutrients away from bacteria through charged interactions with the clay (Londoño & Williams, Reference Londoño and Williams2016); (4) aluminum binding to phospholipids leading to osmotic imbalance and cell lysis (Londoño et al., Reference Londoño, Hartnett and Williams2017; Zarate-Reyes et al., Reference Zarate-Reyes, Nieto-Camacho, Palacios, Gomaz-Vidales, Kaufhold, Ufer, Garcia-Zepeda and Cervini-Silva2017); (5) photocatalysis of kaolin minerals (Awad et al., Reference Awad, López-Galindo, Setti, El-Rahmany and Iborra2017); (6) direct formation of hydroxyl radicals from reduced iron clays (Wang et al., Reference Wang, Dong, Zeng, Xia, Zhang and Zhou2017); and (7) alteration of pH and oxidation state of the microenvironment, leading to combined Al and Fe attack of membrane and intracellular proteins (Morrison et al., Reference Morrison, Misra and Williams2016).
Kohanski, Dwyer, Hayete, Lawrence and Collins (Reference Kohanski, Dwyer, Hayete, Lawrence and Collins2007) proposed that all antibiotics, regardless of their metabolic target, involve the intracellular production of hydroxyl radicals (•OH), a highly reactive intermediate product of Fenton reactions (Fenton, Reference Fenton1894) formed during the oxidation of Fe2+. Hydroxyl radicals have been shown to degrade intracellular proteins and DNA (Imlay, Chin, & Linn, Reference Imlay, Chin and Linn1988; Keyer & Imlay, Reference Keyer and Imlay1996; Winterbourn, Reference Winterbourn1995). This general mechanism has been documented to be one means by which antibacterial clays kill bacteria (Londoño et al., Reference Londoño, Hartnett and Williams2017; Morrison et al., Reference Morrison, Misra and Williams2016; Wang et al., Reference Wang, Dong, Zeng, Xia, Zhang and Zhou2017). However, details of the intracellular reactions, of which proteins are damaged and of what genetic regulatory systems are defeated by this process, remain to be determined.
Antibacterial clays identified over the last decade have enough similarity in their mineralogical and chemical compositions that it is possible to predict which clays will be antibacterial based on their chemical buffering capacity and oxidation state (Morrison et al., Reference Morrison, Williams and Williams2017). The clay minerals provide a buffering capacity to fluids in contact with them which leads to partial mineral dissolution or cation exchange, releasing metals that drive the antibacterial reactions. In particular, a large survey of antibacterial clays showed that most contain reduced transition metals, most commonly Fe2+ (Williams, Reference Williams2017), but other transition metals (e.g. Cu, Mn, Zn) can combine to create toxic conditions as well (Londoño et al., Reference Londoño, Hartnett and Williams2017). The surface areas of particularly fine clays (<200 nm diameter) creates the condition in which the mineral surface dominates and buffers the water chemistry, which is key to the long-term effectiveness of the clays (Morrison et al., Reference Morrison, Williams and Williams2017).
Antimicrobial Susceptibility Testing
Standard methods published and updated regularly by the Clinical and Laboratory Standards Institute (CLSI, [Clinical and Laboratory Standards Institute], 2012) [formerly the National Committee for Clinical Laboratory Standards: NCCLS] describe the procedure for growing aerobic bacteria to their log phase (their fastest doubling rate of growth), which represents their healthiest condition. These are the bacterial populations used for testing antibacterial susceptibility to the clay. All natural clays must be autoclaved (121°C; 30 psi) before testing to remove inherent environmental microbes that might interfere with the bacteria being studied. Clearly, some environmental microbes may be bactericidal against aerobic pathogens (Svensson et al., Reference Svensson, Behroozian, Xu, Surette, Li and Davies2017) so it is important to remove these from the inorganic materials.
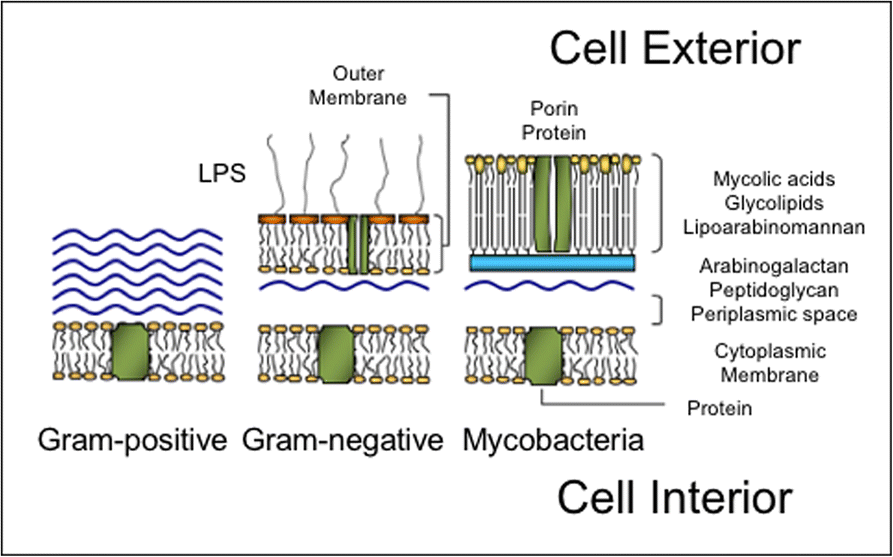
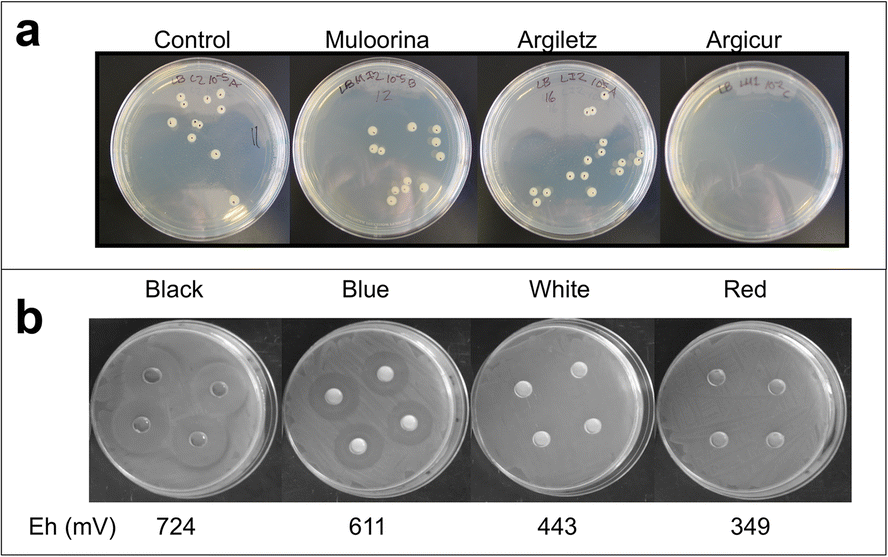
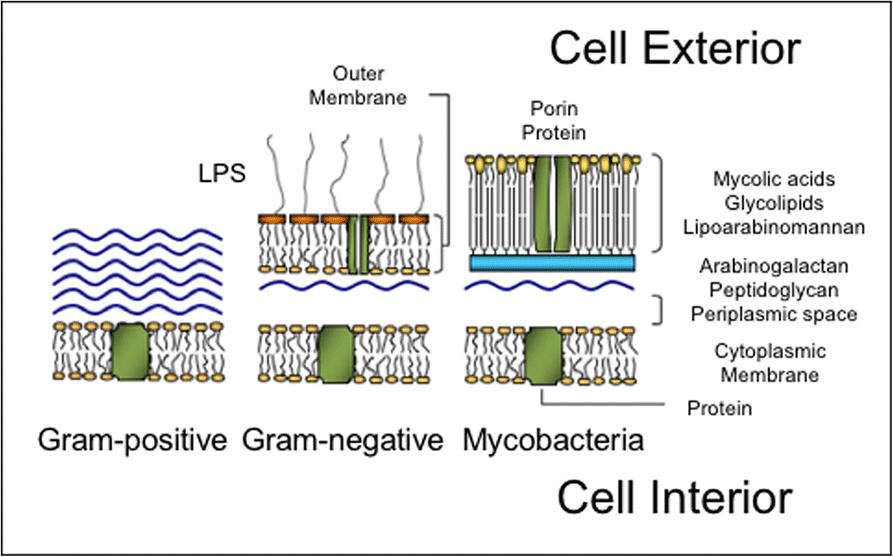
A broad spectrum of Gram-negative bacteria, Gram-positive bacteria, and Mycobacteria each with different cell membrane structures (Fig. 9) were grown in a planktonic state (free-floating bacteria suspended in growth media) for initial testing. The initial populations of bacteria were chosen at a concentration of 107 to 108 CFU/mL. Colony forming units (CFU) are large enough that they can be seen growing in clusters when plated on a growth agar (e.g. Fig. 10a). Their growth was monitored over 24 h as a control group. Another aliquot of the bacteria was mixed 1:1 (vol:vol) with a suspension of clay that had been equilibrated for 24 h with deionized water (DIW). Starting with a suspension of 200 mg clay/mL DIW allowed for smectite-rich clays to be transferred easily by pipette. Later testing for the minimum concentration needed to kill the bacteria showed that less clay could be used, but the concentration depended on the ionic strength of the fluid (growth media) because various anions will complex with dissolved metal species in solution, reducing their concentration as reactants (Morrison et al., Reference Morrison, Misra and Williams2016). After mixing with an equal volume of suspended bacteria (108 CFU/mL), the mixture (note: clay concentration now diluted by half) was capped and placed on its side in a rotary shaker (250 rpm) to keep the clay and bacteria suspended, then incubated at 37°C overnight. The next day, the suspension was serially diluted and spread onto agar plates containing growth media and incubated again at 37°C for 24 h. Plates spread with bacteria diluted to 10−5 times their original concentration (Fig. 10a) allowed the number of surviving CFU to be counted easily. The example in this case shows the control (bacterial growth after 24 h incubation in growth media, without clay), compared to two reduced Fe clays that are not antibacterial (Muloorina and Argiletz) and one that is (Argicur). Once a clay is indicated to be antibacterial, it is necessary to determine the minimum inhibitory concentration (MIC), the lowest concentration that inhibits visible bacterial growth over 24 h, and the minimum bactericidal concentration (MBC), defined as the minimum amount which causes a 99.9% reduction in bacterial growth measured by plating and CFU counting (CLSI, [formerly National Committee for Clinical Laboratory Standards: NCCLS], 1999; Harrison et al., Reference Harrison, Turner and Ceri2005; Wilson et al., Reference Wilson, Henry and Smith1990). Determining the antibacterial effect requires multiple dilutions of the clay-bacteria suspension, and each experiment is performed in three independent replicates in order to evaluate the statistical significance of the population reduction.
Schematic diagram showing different bacterial cell membrane structures for Gram-positive, Gram-negative, and mycobacteria (reproduced from Williams and Haydel, Reference Williams and Haydel2010, with the permission of The Clay Minerals Society)
Methods for evaluating antibacterial susceptibility. (a) Plate counting serial dilutions of bacteria treated with clay. (b) Disk diffusion method showing zones of bacterial growth inhibition around an aliquot of hydrated clay placed on a plate where bacteria are well established

Because of the time-consuming nature of plate counting, a modified disk diffusion method (Bauer et al., Reference Bauer, Kirby, Sherris and Turck1966) was used as a rapid qualitative method for isolating field samples that showed potential for antibacterial activity (Morrison et al., Reference Morrison, Williams and Williams2017). For this method, model Gram-negative (E. coli) and Gram-positive (Staphylococcus epidermidis) bacteria were used to evaluate which samples were worthy of the more quantitative plate-counting method. The bacteria were grown to log phase, then plated on agar containing fresh growth media and grown to evenly fill the plate. Using a sterile tube, 5 mm holes were punched into the agar after bacterial growth was well established. A 200 μL volume of 200 mg/mL clay suspension in DIW (equilibrated for 24 h) was placed in the agar well, and incubated overnight at 37°C. If the clay suspension showed a zone of bacterial growth inhibition around the well (Fig. 10b), it was later evaluated quantitatively using standard plate counting methods described above.
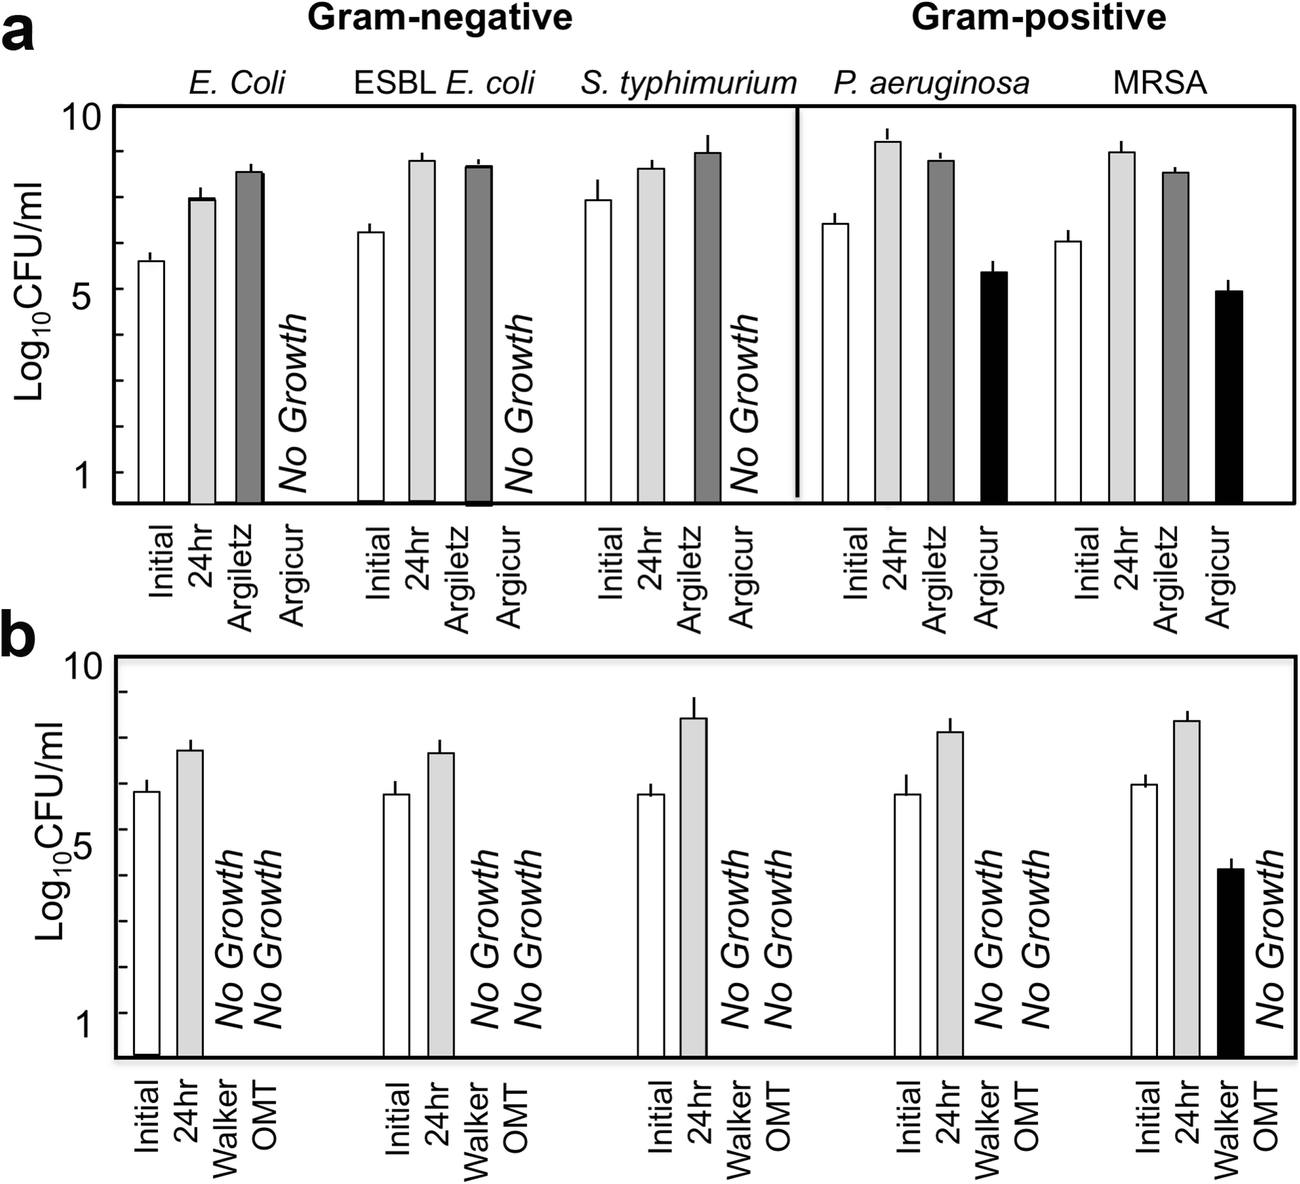
Results of the antibacterial susceptibility testing against Gram-negative and Gram-positive pathogens are shown (Fig. 11) for the two French green clays (alkaline) and two antibacterial clays from the USA (acidic clays). Clearly, the alkaline Argicur clay is less effective against Gram-positive bacteria, and the acidic US clays are more effective antibacterial agents in general.
Results of bacterial susceptibility testing by plate counting planktonic bacteria in vitro. (a) French green clays; (b) acidic reduced Fe-clays from USA. Error bars represent standard deviations from triplicate experiments

Discussion
Mineralogical comparison of antibacterial clays
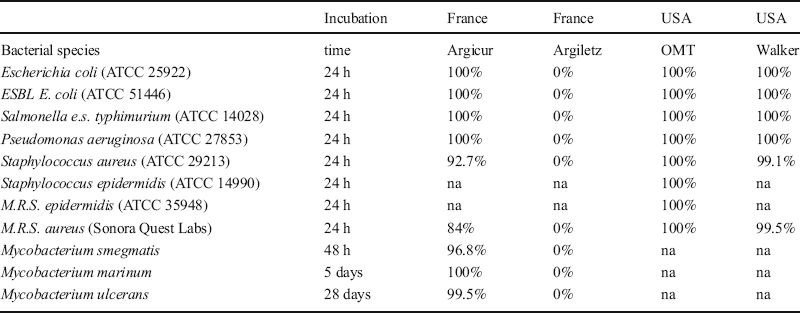
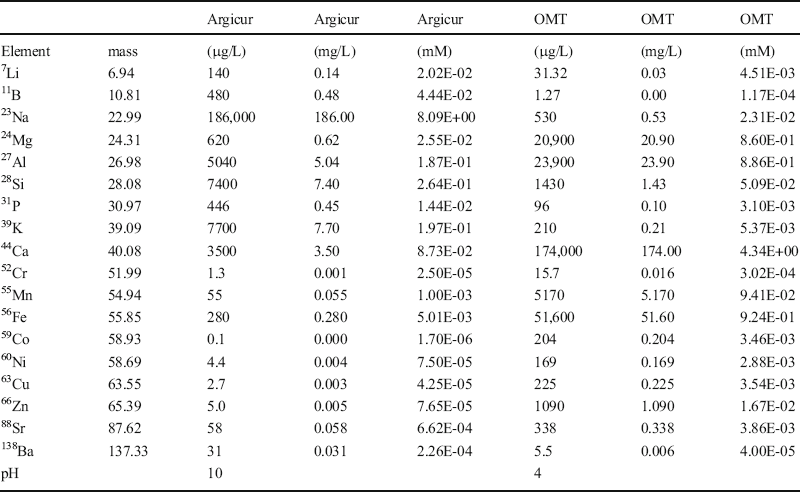
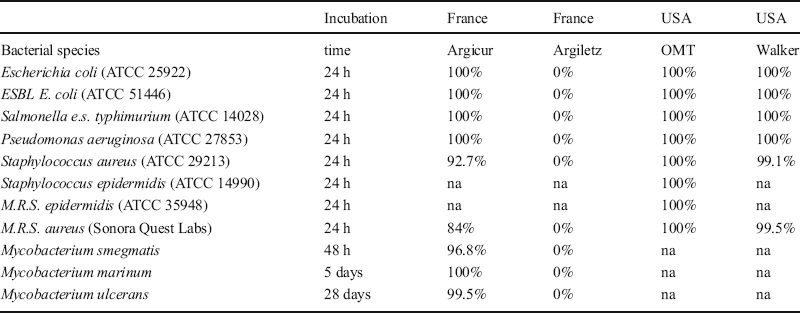
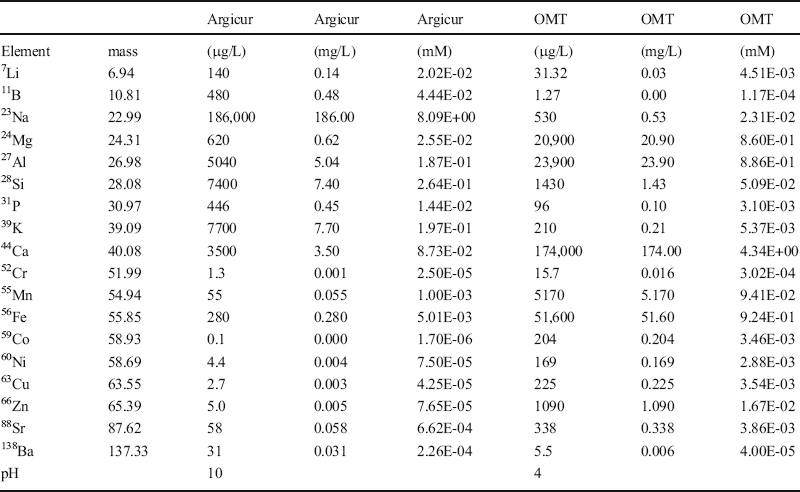
Early mineralogical investigations of the French green clay that cured Buruli ulcer (Williams et al., Reference Williams, Haydel, Giese and Eberl2008) gave the first clues that the reduced Fe was not the only factor that may play an important role in the chemical attack on human pathogens. Of the two French-supplied green clays, recall that only one killed the bacteria tested (Table 1). The mineralogy of each clay was similar (Fig. 2), and chemically the total Fe content of both French green clays is similar (~6 wt.%; (Williams et al., Reference Williams, Haydel, Giese and Eberl2008)). Notably, the Argiletz-supplied clay, which was not effective at killing bacteria, had a large calcite content, and the pH of the clay suspension (200 mg/mL) was ~7.6, at which value most human pathogens are not stressed. In comparison, the Argicur clay that was effective at killing the broad spectrum of bacteria tested had negligible calcite, a larger amount of reduced-Fe smectite, and the pH of the clay suspension was >10. The very high pH is in the range where Al is soluble (Honty et al., Reference Honty, De Craen, Wang, Madejova, Czimerova, Pentrak, Stricek and Van Geet2010), and partial dissolution of the Fe-smectite was indicated by elevated concentrations of Al3+ in the aqueous leachate (Table 2) of the Argicur sourced clay (0.19 mM compared to 0.03 mM Al in the Argiletz leachate).
Antibacterial effectiveness of four reduced iron clays indicated by percent reduction of the bacterial population over the indicated incubation time at 37°C. All experiments performed in triplicate
na not analysed
Chemical analysis by ICP-MS comparing aqueous leachates of two antibacterial clays: one alkaline and one acidic
The geologic source of the antibacterial Argicur clay was never found. The company which sold that clay to Line Brunet de Courssou provided additional samples of the clay, but their supply had been stored outside for >5 years and oxidized, thus it did not show an antibacterial effect when later tested. A search began for antibacterial clays with similar characteristics to the French green clays (reduced-iron bearing illite-smectite-type clays). Clays were collected worldwide from on-line suppliers, mining companies, and oil companies (Williams, Reference Williams2017).
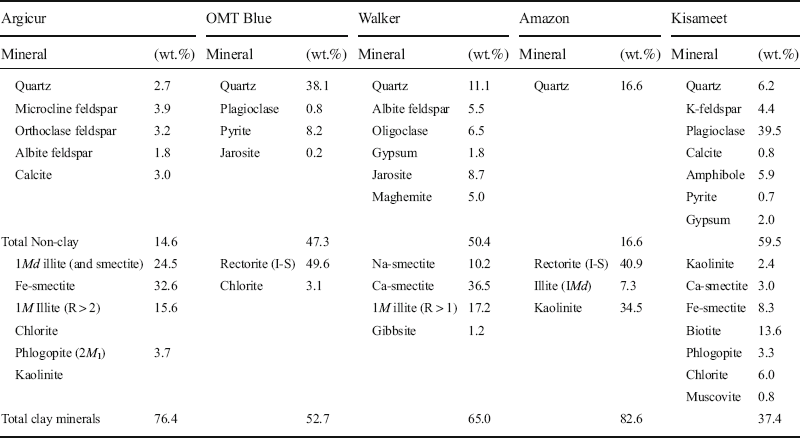
The on-line sale of clays that are claimed to have healing properties is abundant, with both topical and internal use of the minerals suggested to cure a variety of ailments, kill bacterial and fungal infections, and promote health through nutritional supplementation. However, a survey of these products (~50) over the last decade has found that only ~10% are antibacterial against the model Gram-positive and Gram-negative human pathogens tested (E. coli and S. aureus). Those found to kill the model pathogens were also tested against a broad spectrum of bacteria (Table 1), including antibiotic-resistant strains. These tests identified several antibacterial clay deposits, in addition to the Argicur clay from France, and a sampling of the mineralogical variability of these antibacterial clays was determined by random powder XRD (Table 3).
Comparison of the mineralogy of several antibacterial clays determined by random powder X-ray diffraction (CuKα radiation; quantified using RockJock (Eberl, Reference Eberl2003))
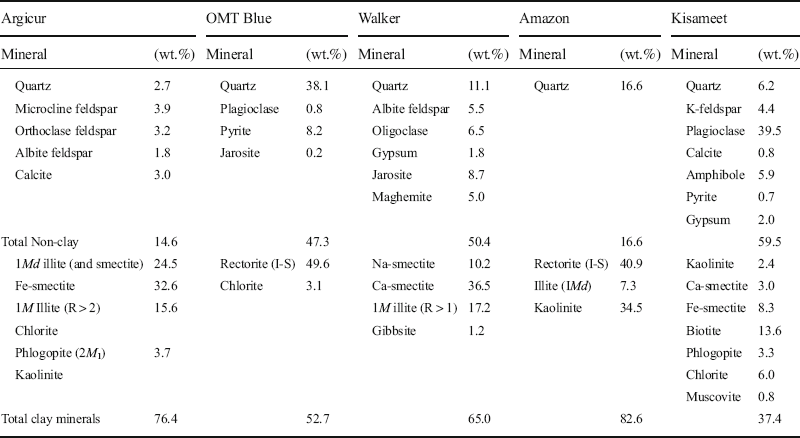
The Oregon Mineral Technologies (OMT) Blue clay is a reduced-Fe clay from hydrothermally altered volcanics (Douglas Co., Oregon, USA) near Crater Lake, but it is a much older deposit (~30 Ma) than the Crater Lake pyroclastic materials. It is distributed by OMT to several nutraceutical companies, for its healing properties and is also sold as a soil amendment due to its large sulfur content and acidity. It proved to be effective at completely killing all of the Gram-negative and Gram-positive bacteria tested (Fig. 11), including Methicillin-resistant S. aureus (MRSA), one of the more troublesome human pathogens. Morrison et al., (Reference Morrison, Williams and Williams2017) studied in detail the mineralogical variability across this deposit and tested each sample (>50) for its antibacterial effectiveness. The mineralogy of the OMT deposit is complex, but analyses revealed that the dominant clay was rectorite, an R1 ordered illite-smectite with 50–55% illite. The antibacterial parts of the deposit also contained pyrite (>5%), which clearly plays a role in providing abundant Fe2+ in solution and in acidifying the clay suspension (pH < 5). The Blue clay is found in a fault zone, where hydrothermal fluids from nearby volcanism have altered porphyritic andesite and pyroclastic materials. Morrison’s work showed that in parts of the deposit where carbonates were present, the clay was not antibacterial. The interpretation was that where carbonates precipitate, the pH must be >6, at which Fe2+ is not soluble. Furthermore, where highly oxidized minerals (e.g. goethite) were found the clay was not antibacterial. Most important was the discovery that the antibacterial effectiveness was clearly dependent on the oxidation state and pH of the mineral suspension in water.
A similar clay from near Walker Lake, Nevada (USA), was tested and proven to be bactericidal. This clay has a mineralogy similar to that of the OMT deposit (Table 3). The deposit is mined commercially and sold as a product called SierraSil®, which is a nutritional supplement for the treatment of osteoarthritis and is claimed to relieve joint pain. The active ingredient in the dietary supplement is Fe, which is supplied in a single dose, in excess of the recommended daily requirement (http://www.sierrasil.ca/wp-content/uploads/2016/12/dietary-mineral-analysis-May-2015v4.pdf). However, the Fe in this clay mineral assemblage does not appear to come from clay minerals, but rather from maghemite and jarosite in the clay-size fraction (Table 3). The mineral assemblage is, again, acidic in suspension (200 mg/mL), and the presence of reduced Fe phases suggests that the clay is initially in a reduced state but becomes oxidized when mixed with DIW.
The Amazon clay (AMZ) was collected near Araracuara, in the northwest Colombian Amazon, within the basin of the Caqueta River. This clay was chosen for study because it is used as a healing clay by members of the Uitoto tribe, an indigenous culture which uses the clay for soothing intestinal discomfort. This clay killed E. coli and B. subtilis when tested in vitro (Londoño & Williams, Reference Londoño and Williams2016), but interestingly the mineral assemblage contained no detectible reduced-Fe bearing minerals (Table 3). Kaolins dominate the clay fraction (~45 wt.%), along with smectite (~31%) and discrete illite. The kaolins in this clay show clear signs of weathering with dissolution textures that corroborate the large Al content found in the aqueous leachate, which is the only element found in concentrations above the minimum inhibitory concentration for E. coli. The antibacterial mechanism of this clay (Londoño et al., Reference Londoño, Hartnett and Williams2017) is discussed further below.
The Kisameet clay, a glacial ‘flour’ deposit from British Columbia, has been shown to be effective against a group of bacteria known as the ESKAPE pathogens (Enterococcus faecium, Staphylococcus aureus, Klebsiella pneumoniae, Acinetobacter baumannii, Pseudomonas aeruginosa, and Enterobacter species), which are commonly found in hospitals and demonstrate resistance to known antibiotics (Behroozian et al., Reference Behroozian, Svensson and Davies2016). This deposit is unlike other antibacterial clays in that it is dominated by non-clay minerals of igneous and metamorphic origins, ground to clay size by glacial action (Table 3). The mineralogy and chemical composition of the Kisameet deposit were determined on a sample obtained from the owner (Williams, unpublished, 2010). Despite the different origin of this clay compared to the hydrothermal antibacterial clays (Argicur and OMT), it does contain several reduced-Fe bearing phases with a bulk composition of 8.6 wt.% total Fe that may be soluble. The pH and Eh of the clay suspension were not measured but given the presence of pyrite and other reduced-Fe bearing phases (e.g. biotite) it is likely to be acidic and initially reduced. Notably, upon testing this sample in 2017, it was no longer antibacterial against E. coli, indicating loss of the antibacterial capacity due to oxidation.
Metal solubility
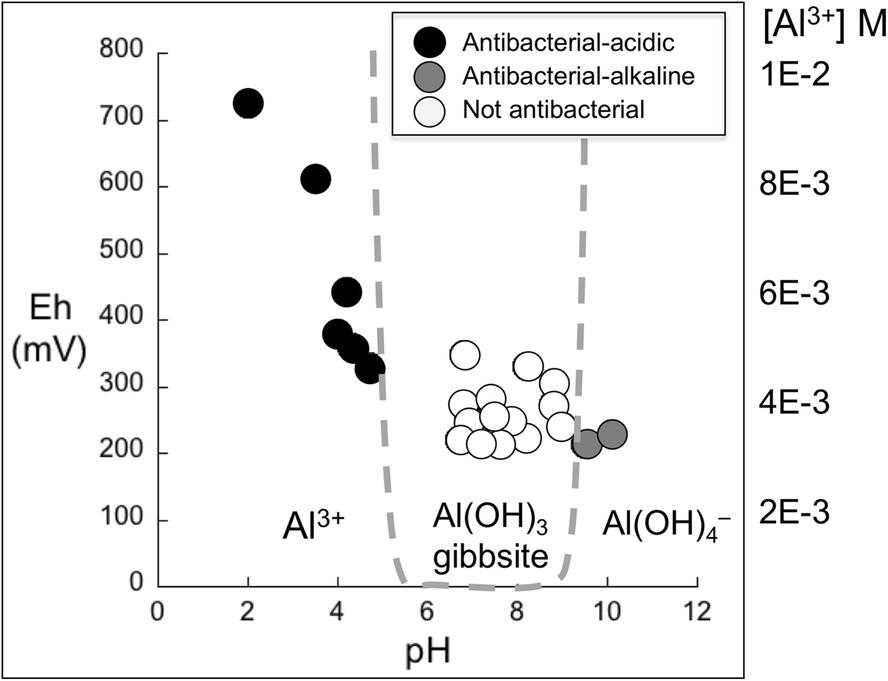
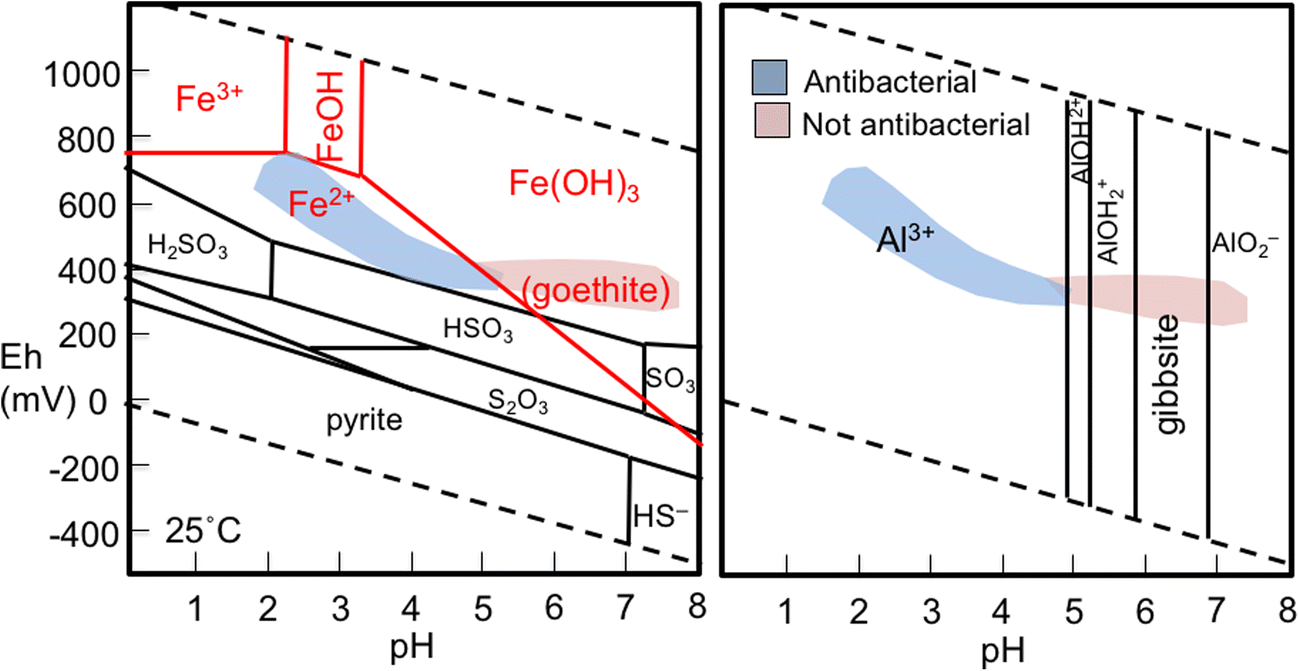
Because the in vitro antibacterial susceptibility testing of these mineralogically different clay deposits found each to be bactericidal against planktonic (free floating) bacteria, a comparison of their clay mineralogy, chemical composition, and the chemistry of the aqueous leachates led to predictive insights (Williams, Reference Williams2017). The pH and Eh of aqueous suspensions (200 mg/mL) of a number of samples tested (Fig. 12) show that all of the antibacterial clays have pH < 5 or > 9. Eh values for acidic antibacterial clays fall between +400 and +800 mV but are lower (~200 mV) for the alkaline clays. The pH conditions are suitable for promoting Al solubility, thus supporting a role for dissolved Al3+ in the antibacterial process. The question was, whether the Al attacked the bacterial cell membranes or did mineral dissolution, which released Al, also release other metals essential for the antibacterial reactions? Aluminum is normally incapable of passing through the cell membrane (Nies, Reference Nies1999; Williams, Reference Williams1999) so its role in the antibacterial mechanism was unclear. However, dissolution of aluminosilicates accompanied the release of Fe2+ and other transition metals (e.g. Cu, V, Cr, Mn) found in elevated concentrations in the aqueous leachates of the antibacterial clays. The range of oxidation states (Eh) specific to antibacterial clays further implicated metal solubility as a controlling factor in the antibacterial process. The Eh-pH stability plots for Fe and Al (Fig. 13) define the range of conditions at which the acidic clays tested were antibacterial. Where the oxidation state exceeded the stability field for Fe2+, or the pH exceeded the stability field for Al3+, hydrated clays lost their antibacterial capacity. Because Al is also soluble at high pH (>10), the reduced Fe in those clays is anticipated to be similarly involved in the observed bactericidal effect of the Argicur clay.
A comparison of antibacterial clays identified to date show that a suspension of the clay in water, equilibrated for 24 h, buffers the fluid pH and Eh to conditions where aluminosilicates are soluble. This solubility releases reactants that interact with microbes to cause bactericidal reactions

Eh-pH stability plots (25°C) for (a) Fe-S-OH and (b) Al-OH (Svensson et al., Reference Takeno2017) showing the range of antibacterial and non-antibacterial clay suspensions (Williams, Reference Williams2017)

Fenton Reactions
The production of hydroxyl radicals during oxidation of reduced metals is a widely known reaction series first described by Fenton (Reference Fenton1894) and are thus known as Fenton reactions. This series of oxidation reactions (1–4 below) was first described for Fe2+ but may be caused by other reduced metal species referred to as Fenton metals (Schoonen et al., Reference Schoonen, Cohn, Roemer, Laffers, Simon, O'Riordan, Sahai and Schoonen2006).




The Fe2+-dependent decomposition of hydrogen peroxide (reaction 3) yields hydroxyl radicals (Valko et al., Reference Valko, Morris and Cronin2005). The proximity of hydroxyl radical generation to biomolecular targets (including lipids, proteins, and DNA) is crucial to its toxicity because the radical exists only briefly (10−9 s half-life) and diffuses only nanometers before reacting (Winterbourn, Reference Winterbourn2008). The reaction sequence indicated is: (1) reduced metal (M n+) reacts with oxygen (O2) in aqueous solution, forming a superoxide radical (O2 •–); (2) products include H2O2, which reacts with the reduced metal (3) to produce a hydroxyl radical (•OH). Reaction (4) produces reduced metal, water, oxygen, and acid; thus three oxidative species are produced in this cycle, each of which is toxic to biomolecules (Schoonen et al., Reference Schoonen, Harrington, Laffers and Strongin2010).
Generally, the hydroxyl radical may react with biomolecules by (1) hydrogen abstraction, (2) electron transfer, and (3) addition reactions. The reaction of the hydroxyl radical with a biomolecule may produce another radical; for example, attack by •OH on a membrane lipid can cause a series of radical chain reactions that can severely damage the membranes (Zastawny et al., Reference Zastawny, Altman, Randerseichhorn, Madurawe, Lumpkin, Dizdaroglu and Rao1995).
Recently, Wang et al., (Reference Wang, Dong, Zeng, Xia, Zhang and Zhou2017) identified one of the lipids in an E. coli membrane affected by reactive oxygen species generated by a reduced-Fe clay. They used a nontronite reference clay (NAu-2; Source Clays Repository of The Clay Minerals Society) with >20% total Fe, that had been chemically and microbially reduced to reactive Fe(II). This study showed that cardiolipin, a lipid concentrated at the polar ends of the bacteria, were damaged in the presence of reduced-Fe clay. The authors interpreted this damage as resulting from •OH generated by the Fenton reaction. The importance of this work is that: (1) it corroborates a previous study (Williams et al., Reference Williams, Metge, Eberl, Harvey, Turner, Prapaipong and Poret-Peterson2011) showing that Fe-oxide precipitates formed at the polar ends of E. coli reacted with the OMT clay (Fig. 14), where cardiolipins showed damage; (2) Wang et al., (Reference Wang, Dong, Zeng, Xia, Zhang and Zhou2017) showed that after the reduced-Fe smectite was oxidized, losing its antibacterial effect, it could be reduced again to rejuvenate the antibacterial action. This finding could be important for recycling of a reduced-Fe clay for use as an antibacterial agent.
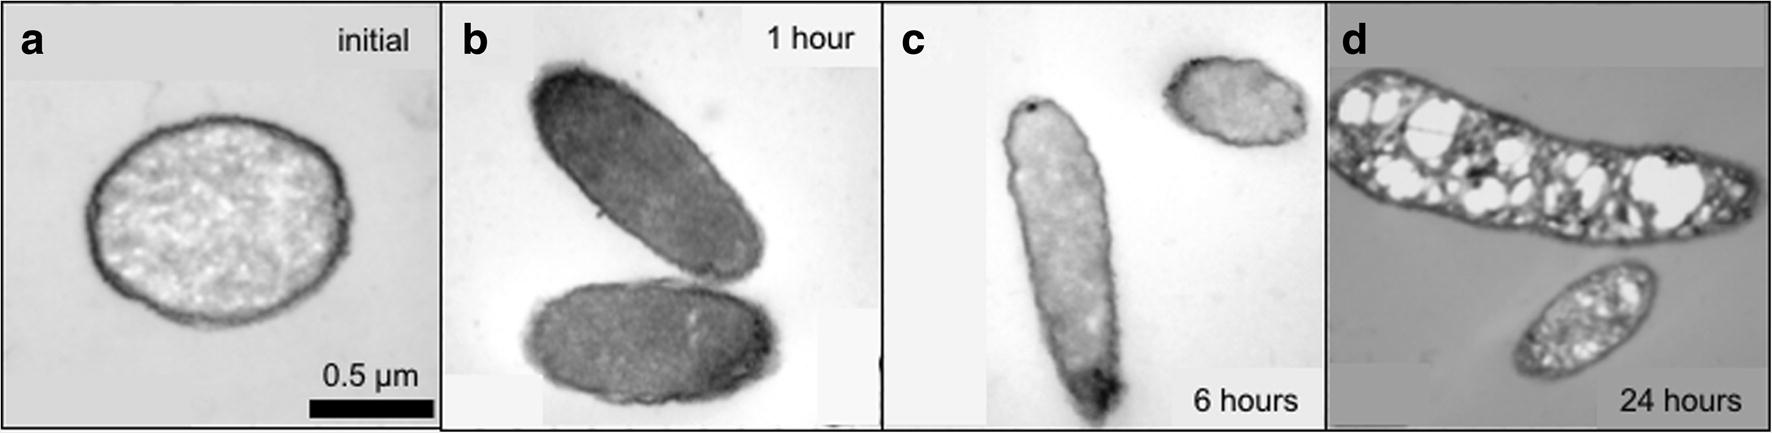
Time-series TEM images of E. coli reacted with OMT antibacterial clay leachate (200 mg/mL DIW, equilibrated for 24 h). (a) E. coli initially show response to the acid solution (pH ~ 4.6); (b, c) between 1 and 6 h black Fe-oxide precipitates form at the polar ends of the bacteria, (d) after 24 h the black precipitates appear intracellularly and the bacteria are no longer viable (Williams et al., Reference Williams, Metge, Eberl, Harvey, Turner, Prapaipong and Poret-Peterson2011). White voids are probably phosphate granules plucked out during microtoming (after Williams et al., Reference Williams, Metge, Eberl, Harvey, Turner, Prapaipong and Poret-Peterson2011).

Natural Antibacterial Clay Mechanisms
Transmission electron microscopy (TEM) is commonly used to observe structural damage to bacteria after treatment with an antibiotic or other antibacterial agent. The response of E. coli to treatment with the OMT antibacterial clay (Fig. 14), was shown in a time-series of TEM images made from pressure frozen bacteria that were incubated with OMT leachate. The bacteria were fixed with osmium vapor and glutaraldehyde, resin embedded, and thin sectioned for TEM. The time series shows: (a) E. coli after the initial incubation showing a uniform black precipitate of an electron opaque metal; (b) after 1 h the metal migrates towards cell poles, which may be a cell mechanism for eliminating excess metals; (c) metals are concentrated at cell poles after 6 h; and (d) after 24 h the metal has penetrated the cell interior and voids or vacuoles form and accompany cell death (Williams et al., Reference Williams, Metge, Eberl, Harvey, Turner, Prapaipong and Poret-Peterson2011). The vacuoles were possibly from phosphate granules that form to regulate intracellular metals and were plucked out during the microtoming. After 24 h, no bacterial growth occurred. However, it was not known if the metals that formed black spots on the cell interior entered before or after cell death.
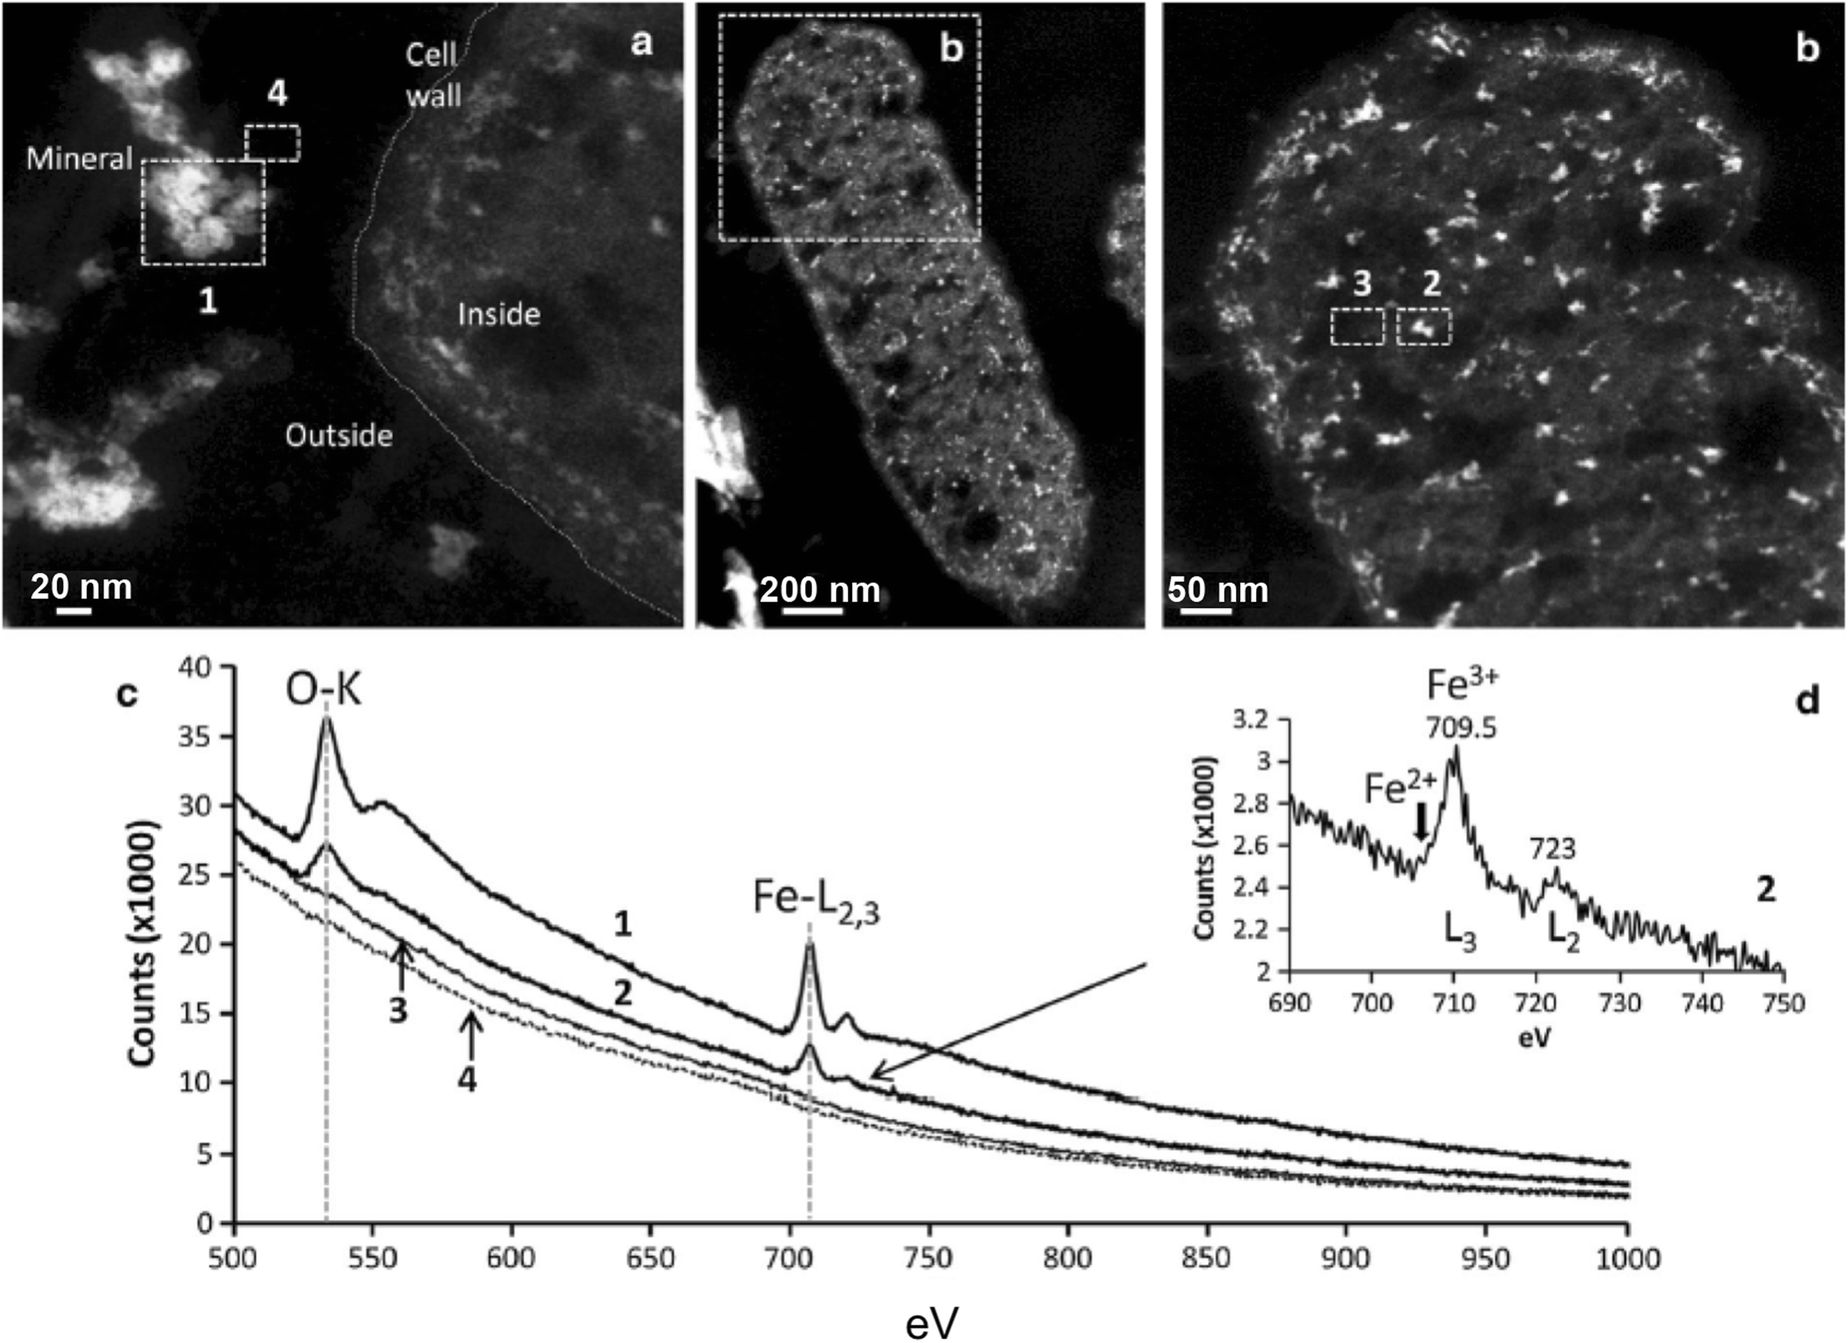
In order to identify the black precipitates in the OMT-treated E. coli, Morrison et al., (Reference Morrison, Underwood, Metge, Eberl and Williams2014) used scanning transmission electron microscopy (STEM) for a closer look. Dark field images (Fig. 15) are shown in which the contrast is reversed from the TEM images (white spots mark precipitates that were black in Fig. 14). Electron energy loss spectra (EELS) were taken to verify that the precipitates were Fe oxides. No measurable signal for Fe(II) was observed. Nonetheless, this result did not reveal the timing of the oxide precipitation.
STEM dark-field images of E.coli treated with OMT leachate 24 h, showing (a) Fe minerals (area 1) outside the cell not adhering to the cell wall, (b) whole cell showing white precipitates (black spots in Fig. 13), areas 1–4 were compared. (c) EELS spectra of the oxygen K edge (533 eV) and iron L-2/3 edge (709.5 eV), (d) Fe L-2/3 edge of the intracellular particles reveals the presence of Fe3+ at 709.5 eV reproduced, with permission, from Morrison et al. (Reference Morrison, Underwood, Metge, Eberl and Williams2014)

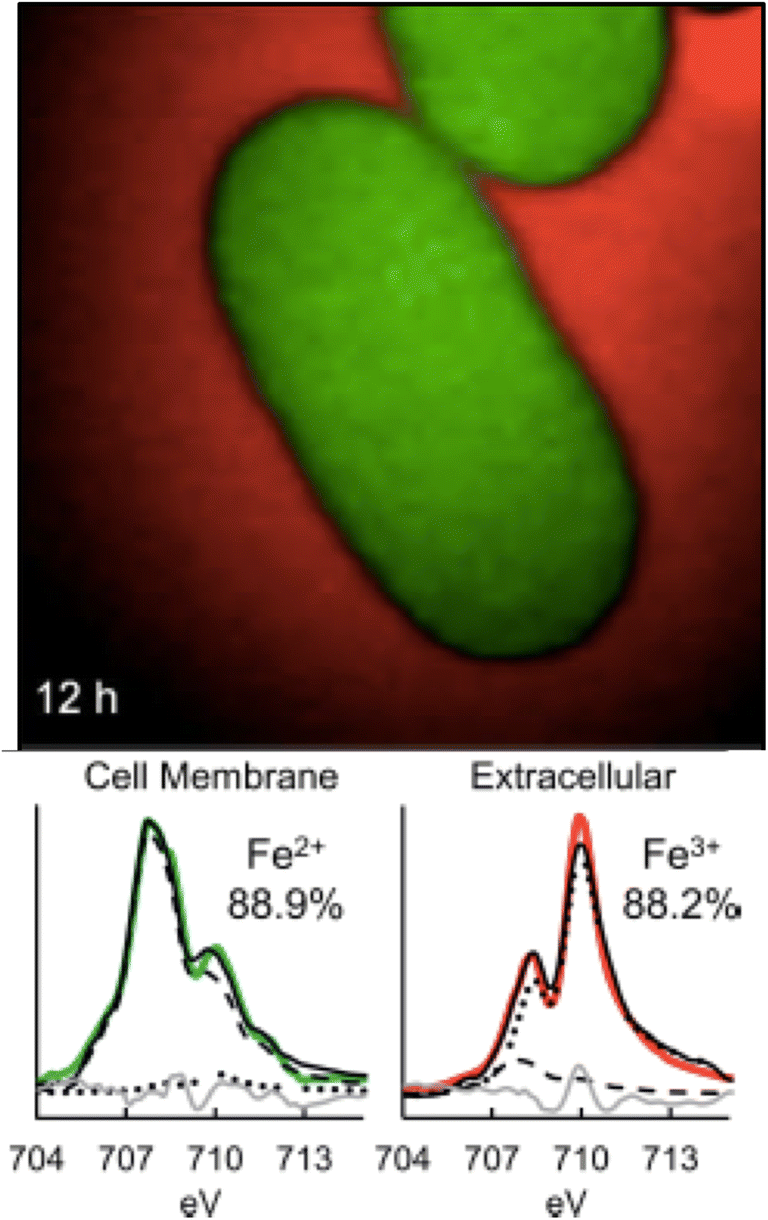
To better evaluate when the Fe became oxidized, synchrotron scanning transmission electron microscopy was used. Near-edge X-ray absorption fine structure (NEXAFS) allowed a study of metals interacting with the bacteria in their hydrated state loaded into silicon nitride cells (Morrison et al., Reference Morrison, Misra and Williams2016). E. coli were grown to their log phase growth in LB media, then placed in the aqueous leachate of the OMT (100 mg/mL) and monitored for Fe2+ and Fe3+ distribution on the cells over 24 h (Fig. 16). This study showed that in the first 12 h Fe2+ was attracted to the cells (88.9% dominant). After 24 h, however, Fe3+ dominated the cell walls (data not shown). Because it is difficult for trivalent ions to enter an undamaged cell membrane (Nies, Reference Nies1999), it was concluded that Fe2+ first entered the cell, and later became oxidized intracellularly, causing precipitation of Fe oxides as a marker of cell death (Morrison et al., Reference Morrison, Misra and Williams2016).
Synchrotron NEXAF analysis of the Fe distribution on E. coli reacted with OMT leachate over 12 h, indicating preferred Fe2+ (green) adsorption on the cell wall leaving Fe3+ (red) in extracellular solution. Percentages of Fe2+ and Fe3+ indicated were calculated using linear-regression fitting (reproduced with permission from Morrison et al. Reference Morrison, Misra and Williams2016)

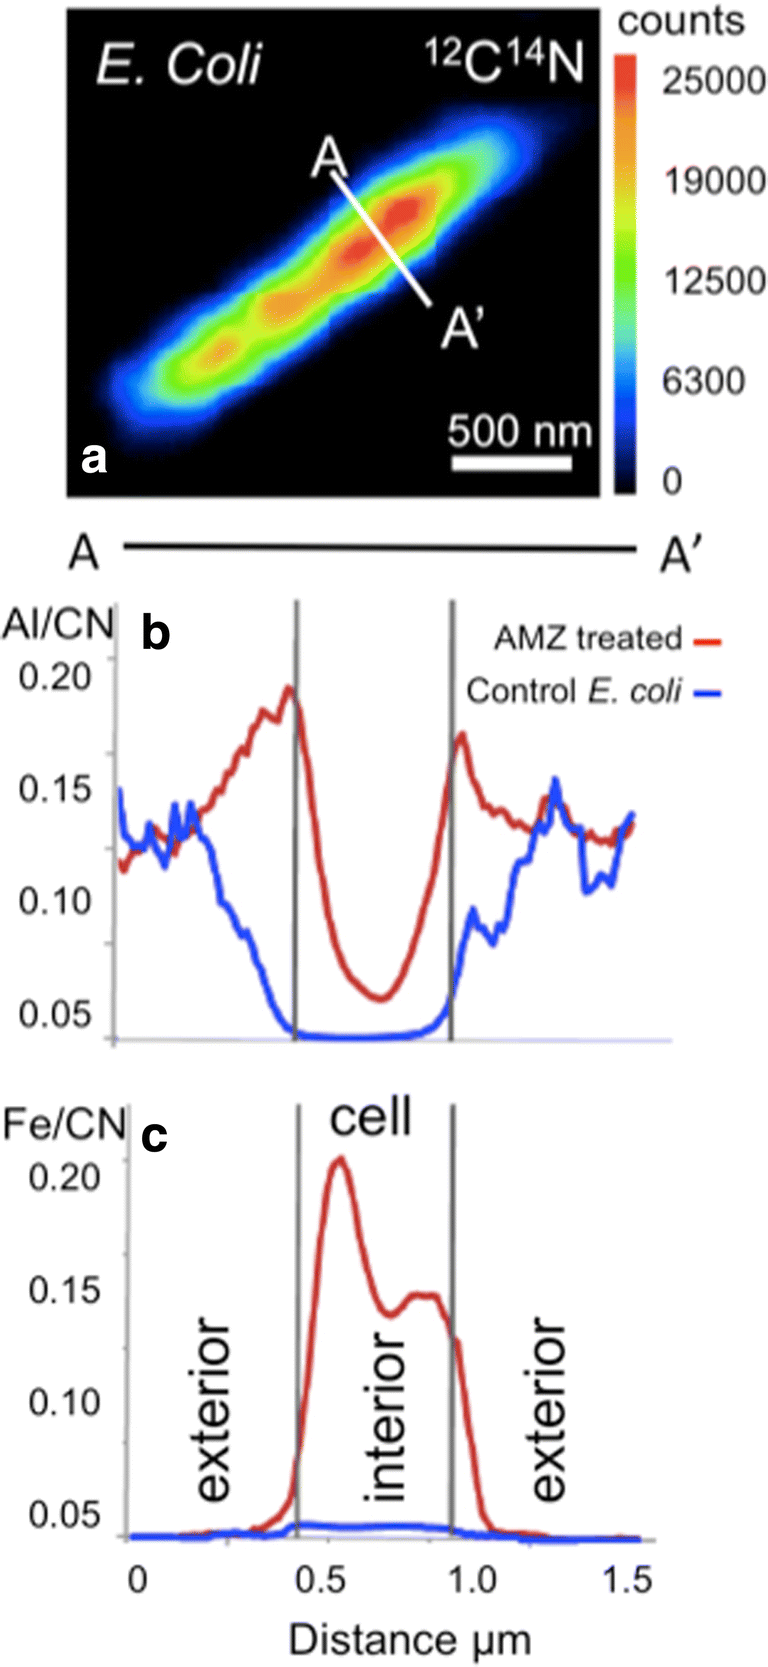
At that point, it became clear that both Al3+ and Fe2+ worked synergistically in the antibacterial mechanism, but it was unclear what their cellular distribution was, and which parts of the cells were damaged. Nano-secondary ion mass spectrometry (NanoSIMS) was used to map the distribution of these elements across E. coli cells. This mass spectrometer allows high spatial resolution (<50 nm) ion imaging of solid-state samples (minerals and microbes), thus it can map isotopic distributions of elements on the scale of a single bacterium (Nunez et al., Reference Nunez, Renslow, Cliff and Anderton2018). NanoSIMS was used to study the Al and Fe distribution in E. coli treated with two mineralogically different antibacterial clays, the OMT and AMZ clays (Table 3). Samples were incubated with the clay suspensions for 24 h, at inhibitory concentrations so that the bacterial growth was impeded but not ended. The bacteria were then dehydrated using ethanol, fixed in glutaraldehyde, and a suspension of bacteria was placed on a Si wafer by pipette. The dried sample was introduced to the high-vacuum instrument (<10_9 Torr) and bombarded with a high energy (>20 keV) O− beam. Using only a picoAmp current, the beam was rastered over a 10 μm2 area focused on a small cluster of bacteria, or a single bacterium (Fig. 17). The results were similar for both clays tested, even though the AMZ contained only ~3 wt.% Fe (Londoño et al., Reference Londoño, Hartnett and Williams2017) compared to the high-Fe OMT Blue clay (Morrison et al., Reference Morrison, Williams and Williams2017). In both cases, Al clearly was elevated on the bacterial cell walls and Fe was elevated in the cell interior after treatment with antibacterial clays compared to untreated E. coli controls. Aluminum has a large binding capacity for phosphates and does not penetrate cell membranes (Williams, Reference Williams1999); Londoño et al., (Reference Londoño, Hartnett and Williams2017) explored, therefore, the possibility of Al binding to phospholipids in the cell membrane. The conclusion of that work was that Al caused an increased permeability of the cell membranes, allowing entry of toxic redox active metals into the cell interior. In the case of the AMZ clay, none of the redox sensitive metals (Fe, Cu, Mn) was present at inhibitory concentrations in solution. Nonetheless, the combined effect of these redox sensitive metals was proposed as the cause of intracellular damage.
NanoSIMS results showing: (a) cross section A-A' across Amazon clay-treated E. coli; (b) Al/CN elevated on treated cell exterior; and (c) Fe/CN elevated in treated cell interior compared to controls (no clay)

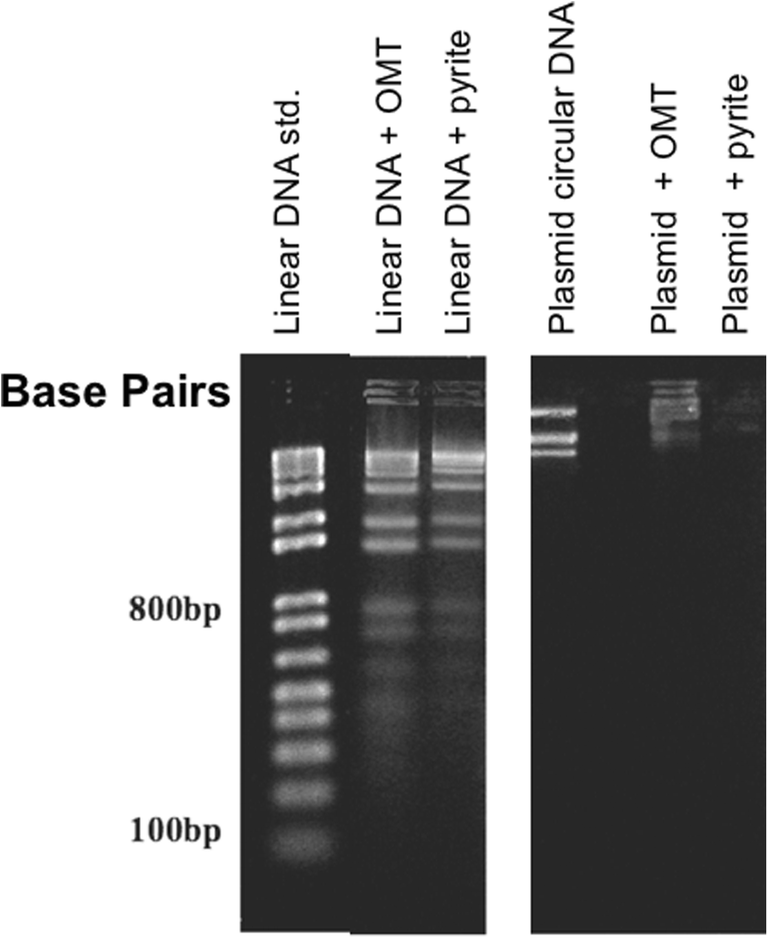
Evidence of damage to intracellular DNA by the OMT clay was first indicated by gel electrophoresis polymerase chain reaction (PCR) testing of linear and circular DNA treated with the OMT clay (Fig. 18) compared to pure pyrite. More work is needed to address the specific intracellular proteins impacted by the clay and to understand their effect on various genotypes; the set of genes in DNA responsible for a particular metabolic trait. This work was begun by genetic testing of cell membrane proteins and intracellular soluble proteins (Morrison et al., Reference Morrison, Misra and Williams2016). Genotoxicity testing using OMT clay leachates produces high levels of envelope protein oxidation, activating σE and SOS stress responses (Alba & Gross, Reference Alba and Gross2004; Huisman et al., Reference Huisman, D'Ari and Gottesman1984; Raivio, Reference Raivio2005). Misfolding of outer membrane proteins by Al3+ may aid in protein oxidation by exposing amino acids to •OH attack, supporting Al3+ as a pro-oxidant (Exley, Reference Exley2004). Morrison et al., (Reference Morrison, Misra and Williams2016) first documented the synergistic activity of Al and Fe as the primary antibacterial agents in the OMT clay. Future work must examine specific proteins involved in the antibacterial mechanism and conditions under which the bacteria might develop resistance to this antibacterial mechanism. Nonetheless, the currently documented antibacterial effect of natural clays is encouraging for their potential use to combat antibiotic resistant infections.
Gel electrophoresis PCR showing degradation of linear and circular DNA base pairs after treatment with OMT clay, compared with pyrite treatment. These results suggested intracellular protein damage (experiment by Dave Metge, USGS)

Pathogenic Biofilms
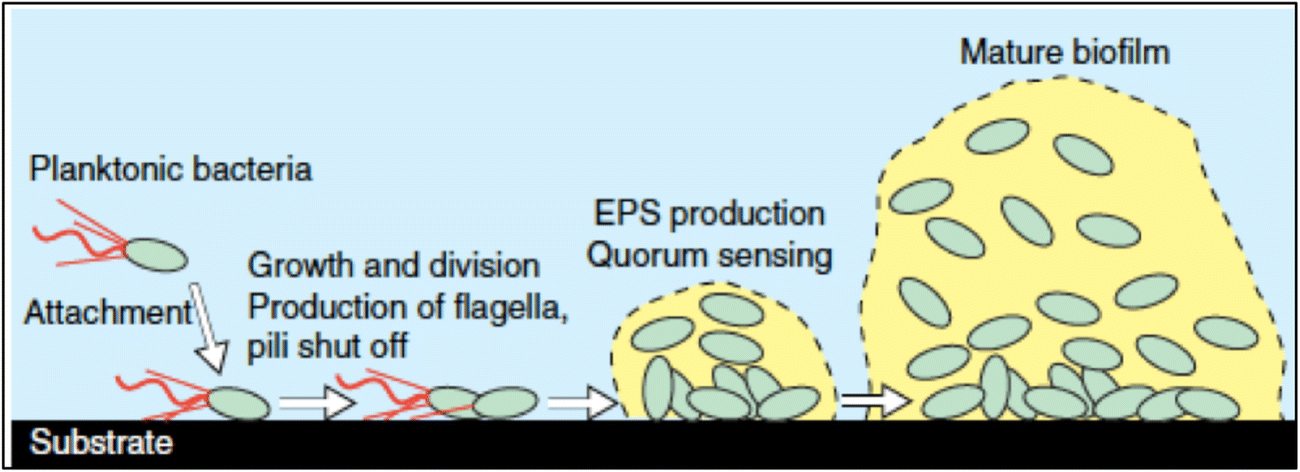
Biofilms are communities of bacteria that adhere to surfaces in aqueous environments by generating a polymer matrix of polysaccharides, proteins, and DNA that bind the community together for protection. This makes biofilms more resistant to antibiotics than their planktonic counterparts (Fig. 19; (Stephens, Reference Stephens2002)); they might, therefore, also resist the antibacterial clay. Biofilms are the most common form of bacteria infecting chronic wounds, teeth, heart valves, lungs, middle ear, chronic rhinosinusitis and osteomyelitis, intravenous catheters and stents, and prosthetic joint infection (Høiby et al., Reference Høiby, Bjarnsholt, Givskov, Molin and Coifu2010).
Cartoon showing the development of biofilms from planktonic bacteria (reproduced, with permission, from Środoń & McCarty Reference Stephens2008)

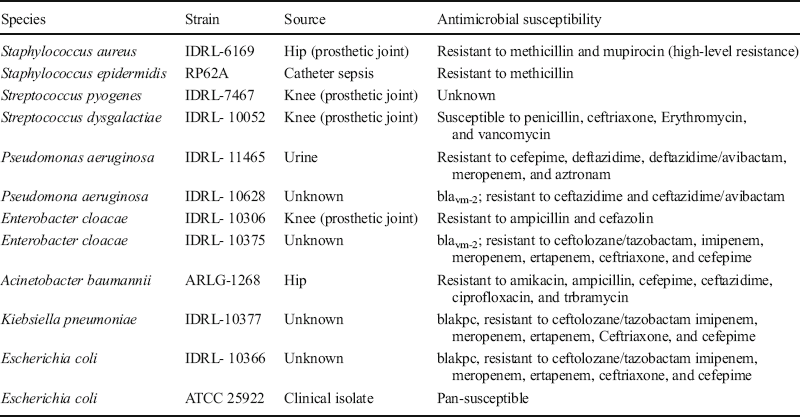
Caflisch et al., (Reference Caflisch, Schmidt-Malan, Mandrekar, Karau, Kicklas, Williams and Patel2018) recently tested the antibacterial OMT clay and its aqueous leachate against bacteria from the Mayo Clinic Infectious Disease Research Lab (IDRL) which represent those most difficult to treat using a variety of well established antibiotics (Table 4). The ability of antibacterial clay to eradicate established biofilms and prevent biofilm formation would confirm that the clay employs an alternative antibacterial mechanism compared to antibiotics to which these bacteria have become resistant. Furthermore, because the different bacterial species tested in this study each bears distinct defense mechanisms that confer resistance to certain antibiotics, the success of this application to biofilms lays the groundwork for design of new antibacterial strategies effective against a broad spectrum of hospital-derived infections.
Bacterial species studied in biofilm form, including strain, source, and susceptibility profile
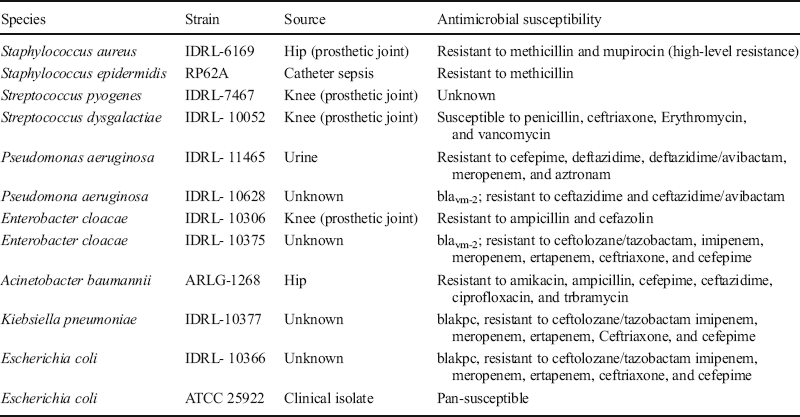
The bacterial strains (Table 4) were tested in planktonic form and were then grown on Teflon discs to establish biofilms prior to treatment with OMT Blue clay or leachate, followed by harvest and quantification of the resulting bacterial populations by serial dilutions and plate counting. Compared with biofilms grown in a control medium, the size of the biofilm bacterial population in all organisms was substantially reduced when exposed to both OMT clay and leachate.
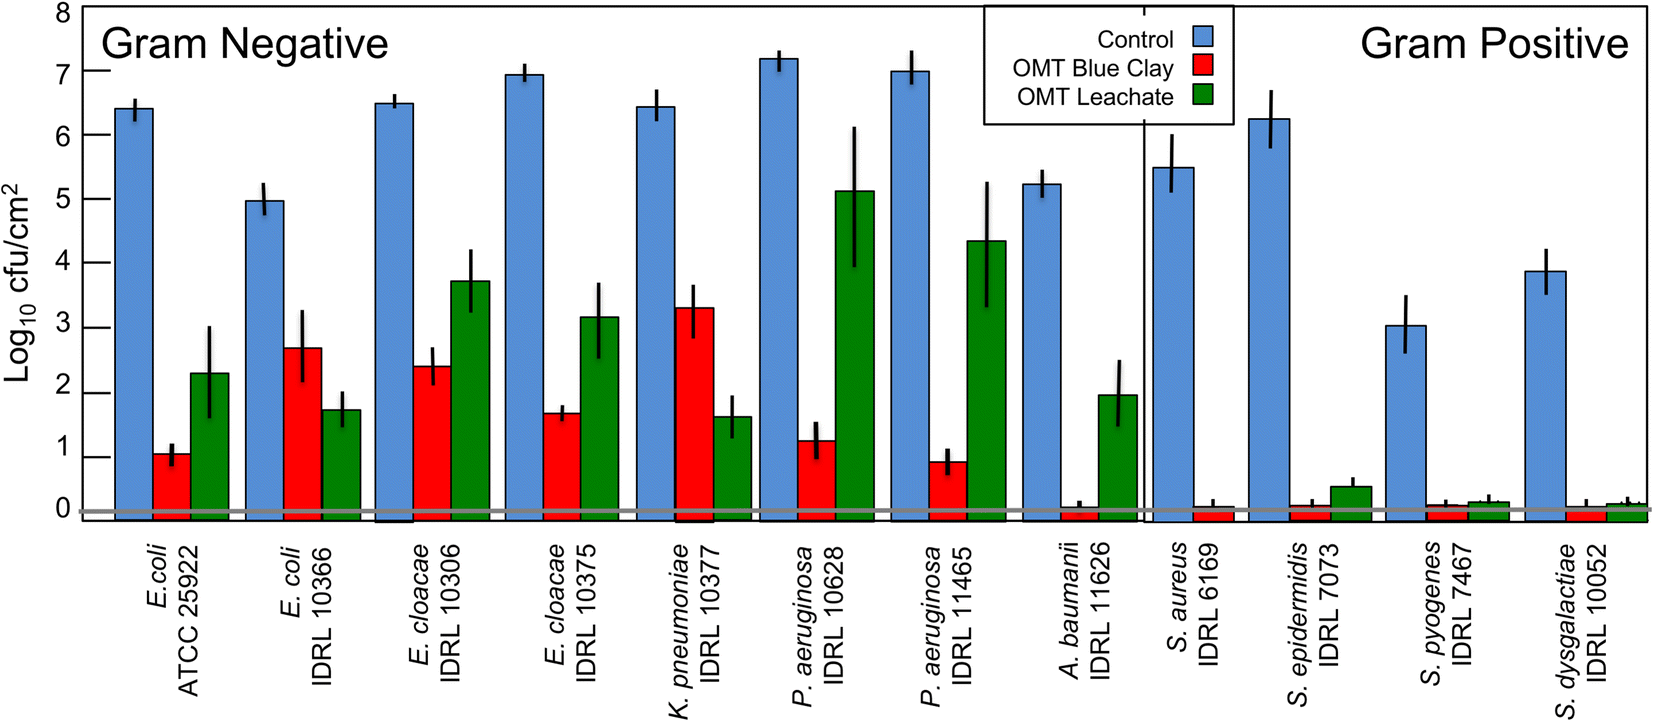
Results of the biofilm experiments (Fig. 20) with OMT Blue clay suspensions (200 mg/mL) and aqueous leachates showed that OMT successfully reduced the established pathogenic biofilms by three orders of magnitude or greater, which is considered bactericidal (CLSI, [formerly National Committee for Clinical Laboratory Standards: NCCLS], 1999). All clay- and leachate-associated bacterial reductions were statistically significant (p ≤ 0.05) compared with controls of the biofilm grown without clay over 24 h. The clay suspension was generally more effective in reducing the biofilm population than the aqueous leachate, probably because the clay acts as a buffer to keep the metals in solution (Williams, Reference Williams2017), whereas the aqueous leachate becomes more easily oxidized, eventually losing its antibacterial capacity. Interestingly, the OMT clay was less effective against the Gram-negative species tested than the Gram-positive species. The opposite was observed for the Argicur French green clay on planktonic species tested previously (Fig. 11), thus acidic clays may in general be more effective against Gram-positive cell wall structures (Fig. 9).
Results of OMT clay suspension (200 mg/mL) and leachate treatments of established biofilms grown from common hospital pathogens from the Mayo Clinic Infectious Disease Research Lab (IDRL). Error bars are from triplicate independent experiments, with statistical significance p ≤ 0.05

The clear antibacterial effect of the OMT clay on pathogenic biofilms is an important step forward for the design of an antibacterial agent that utilizes a mechanism similar to that observed in natural clays. The next goal must be to determine the side effects of natural clay applications to wounds, such as metal toxicity to human blood or tissues, transport of nanoparticles into the body that might cause thrombosis (Radomski et al., Reference Radomski, Jurasz, Alonso-Escolano, Drews, Morandi, Malinski and Radomski2005), or oxidative damage to epithelial cells. Future animal testing and clinical trials are needed to further the use of natural clays for medicinal applications, and to inform the design of materials that utilize the natural clay antibacterial mechanisms.
Conclusions
This review of natural clays used medicinally is intended to provide an overview of how clays have been used for medicinal applications since humans first evolved, using clay to adsorb toxins topically or internally, to coat intestinal linings and soothe digestion, and to stop bleeding when applied to wounds. In order to promote the use of natural clays as medicine (unlike loading clays as carriers of medicine), a better understanding of the mineralogical and chemical variables in clay deposits that affect microbes and human tissues is needed. Interdisciplinary research among geochemical, mineralogical, microbiological, and medical specialists, enhanced by the development of new instrumentation for studying nanoparticle interactions with microbes, has advanced understanding of what makes certain clays antibacterial.
If clays are consumed orally, the chemical interactions of each clay deposit with the human metabolism could lead to unwanted effects, such as accumulation of toxins (e.g. As, Hg) that are common trace elements in clays, adsorption of human nutrients by the clay (e.g. Ca, Fe), and potential sterilization of probiotics needed in the digestive tract for a healthy metabolism. But these concerns are mostly indicated for long-term sustained consumption of clays. The medicinal use of natural clays on occasion, provided they are free of toxic levels of adsorbents (organic or inorganic), could be useful, for example, to stop internal bleeding or to kill intestinal pathogens that could lead to severe illness or death. Clay additives to feedstock for pigs, chickens, fish, etc. could reduce common intestinal pathogens, allowing the animals to grow for harvest, without the risks inherent in long-term use. Historically, clays have been accepted as food additives, for texture, preservation, and cost reduction.
Understanding what makes clays antibacterial is important because these minerals may provide an alternative approach to the treatment of antibiotic-resistant bacterial infections. The clay mineral assemblages, with surface areas of several hundred m2/g (Środoń & McCarty, Reference Środoń and McCarty2008), control the aqueous chemistry of a mud or poultice applied medicinally. Thus, geochemical investigations of the aqueous chemistry of dissolved and exchangeable species released when deionized water equilibrates with clays taken out of their natural (reduced) depositional environments have been essential to understanding the antibacterial action of natural clays discussed here.
Critically important is the role of the clay-mineral assemblage in buffering the water pH to conditions <5 or > 9, at which Al is released from the natural aluminosilicates. Nanometric particle sizes (<200 nm) are a characteristic feature of antibacterial clays, suggesting that a large surface area aids the solubility of antibacterial reactants. Smectite interlayers, and possibly halloysite lumen, can adsorb reduced transition metals released from the mineral assemblage, and act as a barrier to their oxidation. However, when the clays are mixed with deionized water, cation exchange releases those metals, and depending on the aqueous speciation, may lead to bactericidal reactions.
Encouraging new results, revealing that natural antibacterial clay is effective in killing a variety of monomicrobial pathogenic biofilms of antibiotic resistant hospital-acquired infections, shows promise for development of new antibacterial materials that utilize the natural clay antibacterial mechanism. Future testing of potential side effects including toxin accumulation, nanoparticle thrombosis, or unexpected damage to blood or human tissues must be evaluated. However, the potential for antibacterial clay applications in medicine is clear, as science advances beyond the empirical employment of clays by ancestors for medicinal purposes.
ACKNOWLEDGMENTS
This research has been supported by the US National Institutes of Health (NIH R21 AT003618), National Science Foundation research grants (NSF EAR-1123931 and NSF EAR-1719325), and the ASU SIMS Facility, which is supported by NSF grant EAR 1352996. Many colleagues and students contributed to the results presented in this review and their contributions are greatly appreciated.