INTRODUCTION
While they may superficially appear to be distantly related, research on the epidemiology of infectious diseases encompasses a wide range of concepts from population ecology, which is concerned with the abundance of organisms in space and time, arising from both biotic interactions and with their environment. Since the classic work of Anderson and May (Reference Anderson and May1979), the link between ecology and epidemiology has been increasingly recognized and the cross-talk has been mutually beneficial. Epidemiology has benefited from the adaptation of concepts and analytical tools developed in population ecology, while providing some of the most exciting test-beds of ecological theory (May and Anderson, 1977; Earn et al. Reference Earn, Rohani and Grenfell1998).
We begin by describing some of the key concepts from population ecology and discuss their relevance to infectious disease systems, with emphasis on persistence mechanisms and spatio-temporal population dynamics. This description is coupled with simple theoretical models to demonstrate the applicability of some of the key concepts from population ecology. Finally, we describe several metrics derived from ecology that have been used in recent years to interrogate infectious disease data; we provide empirical examples of these methods using time series incidence data for pertussis, or whooping cough, in Thailand.
CONCEPTS FROM POPULATION ECOLOGY
Temporal dynamics and periodicity
The pattern of temporal changes in, for example, species abundance in a given region can provide insight into the underlying drivers of population dynamics. A historically important demonstration of this claim comes from the study of measles. While studying the case reports of measles in Glasgow in early 20th Century, Soper (Reference Soper1929) noted a striking contrast. On the one hand, the theoretical constructs proposed to explain measles transmission within a population predict an equilibrium prevalence in the long run (Hamer, Reference Hamer1906). On the other hand, the epidemiological data from Glasgow and other locations exhibited large amplitude fluctuations. This discord led Soper to examine the data in a bid to identify the key, missing ingredient in mathematical models. He concluded that measles transmission is strongly seasonal, with most transmission occurring during the autumn/winter months and that annually occurring factors, such as the congregation of children in schools, were the most likely explanations for such a ‘seasonal influence’.
Since the classic work of Soper, the contribution of seasonality to the transmission dynamics of infectious diseases has become well established (London and Yorke, Reference London and York1973; Dietz, Reference Dietz and Berger1976; Altizer et al. Reference Altizer, Dobson, Hosseini, Hudson, Pascual and Rohani2006; Grassly and Fraser, Reference Grassly and Fraser2006). A variety of mechanisms may lead to seasonality in transmission. In directly transmitted infectious diseases, for example, seasonal variation in social behaviours can generate temporal patterns in host contact rates (Fine and Clarkson, Reference Fine and Clarkson1982; Finkenstädt and Grenfell, Reference Finkenstädt and Grenfell2000; Ferrari et al. Reference Ferrari, Grais, Bharti, Conlan, Bjørnstad, Wolfson, Guerin, Djibo and Grenfell2008; Metcalf et al. Reference Metcalf, Bjørnstad, Grenfell and Andreasen2009; Mantilla-Beniers et al. Reference Mantilla-Beniers, Bjørnstad, Grenfell and Rohani2010; Bharti et al. Reference Bharti, Tatem, Ferrari, Grais, Djibo and Grenfell2011). Vector-borne diseases, on the other hand, commonly exhibit seasonal variation resulting from changes in vector biology. For example, climatic factors including rainfall and temperature may affect mosquito (1) abundance, (2) the gonotrophic cycle, or (3) the extrinsic incubation period, thereby shaping seasonal trends in the transmission of pathogens such as malaria and dengue (Watts et al. Reference Watts, Burke, Harrison, Whitmore and Nisalak1987; Hoshen and Morse, Reference Hoshen and Morse2004). In other infectious disease systems, seasonality may be generated via differential pathogen survival (e.g. influenza viruses circulating in humans; Shaman et al. Reference Shaman, Pitzer, Viboud, Grenfell and Lipsitch2010), pulsed host breeding (avian influenza viruses; Breban et al. Reference Breban, Drake, Stallknecht and Rohani2009) or host susceptibility, perhaps modulated by photoperiod (Dowell, Reference Dowell2001).
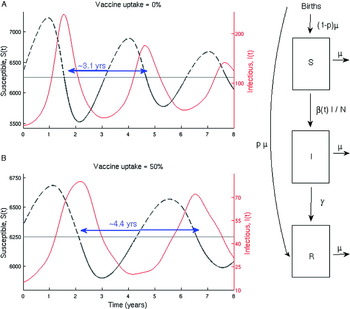
In addition to varying incidence seasonally, a number of infectious disease systems exhibit multi-year inter-epidemic periods – defined as the time between successive large epidemics (Cummings et al. Reference Cummings, Irizarry, Huang, Endy, Nisalak, Ungchusak and Burke2004; Metcalf et al. Reference Metcalf, Munayco, Chowell, Grenfell and Bjørnstad2010; Rohani and King, Reference Rohani and King2010). For example, prior to mass immunization programmes, measles incidence in England and Wales exhibited a biennial period (Bolker and Grenfell, Reference Bolker and Grenfell1996; Rohani et al. Reference Rohani, Earn and Grenfell1999; Earn et al. Reference Earn, Rohani, Bolker and Grenfell2000). Similarly, pertussis incidence is usually characterized by multiennial fluctuations with inter-epidemic periods ranging from 2–5 years (Hethcote, Reference Hethcote1998; Rohani et al. Reference Rohani, Earn and Grenfell1999; Broutin et al. Reference Broutin, Guegan, Elguero, Simondon and Cazelles2005). To demonstrate the epidemiological processes generating these multiennial periods, we used a simple seasonally forced deterministic model following the Susceptible (S)-Infected (I)-Recovered (R) framework (Dietz, Reference Dietz and Berger1976; Anderson and May, Reference Anderson and May1991; Keeling and Rohani, Reference Keeling and Rohani2008) with parameters that loosely correspond to pertussis. A schematic diagram of this model is provided in Fig. 1. From theory, we know that epidemic growth requires the fraction of the population in the susceptible pool to be greater than a critical threshold, given by the inverse of the basic reproduction number, R0 (Anderson and May, Reference Anderson and May1991; Keeling and Rohani, Reference Keeling and Rohani2008). In Fig. 1A, we observed the transient dynamics beginning when the fraction of susceptibles (grey line) falls above its critical threshold (thin black line), thereby allowing epidemic take-off. While the fraction susceptible individuals remains above the threshold, prevalence continues to increase and peaks at the point in which the susceptible fraction (S/N) intersects its threshold level. The epidemic depletes the susceptible pool, and with replenishment, via susceptible births, takes longer than one year, thereby generating multiennial cycles (Keeling and Rohani, Reference Keeling and Rohani2008).
A. The number of susceptible (grey) and infectious individuals (red) with vaccine uptake P = 0, generating an interepidemic period of ∼3·1 years. B. Same as A but with P = 0·5, increasing the interepidemic period to ∼4·4 years. In both, the thin black line is the mean critical threshold for S to allow epidemic growth, or N/R0 where R0=β(t)/γ and γ is the duration of the infectious period. The number of susceptibles is indicated by a dashed line when S falls above the threshold and solid elsewhere. We note that this represents the transient stage of the deterministic dynamics, resulting in a damping of the oscillations. A schematic representation of the SIR model used is provided on the right; parameters roughly correspond to pertussis with weak seasonality where seasonality is modeled as a sinusoidal curve β 0(1+β 1sin(2πt)) (parameters are day−1): γ = 1/21, β 0 = 1 (corresponding to an R 0 of 16), β 1 = 0·01, N = 1 × 10^5, μ = 1/(60*365) (i.e. mean lifespan is 60 years).

Epidemiological theory has also shown that the time between each epidemic, or the inter-epidemic period, increases following the roll-out of immunization (Anderson and May, Reference Anderson and May1991; Keeling and Rohani, Reference Keeling and Rohani2008). This is because immunization programmes effectively slow down the rate at which the susceptible class is replenished, resulting in a longer waiting time before the susceptible threshold is reached. This concept is demonstrated in Fig. 1B, where we examined the same model as in Fig. 1A, but introduced vaccination with uptake of 50%, implemented by simply discounting the birth rate accordingly. In the absence of vaccination, an inter-epidemic period of ∼3·1 years is observed and following the introduction of vaccination, the inter-epidemic period rises to ∼4·4 years; a result that has been confirmed empirically. For example, Broutin et al. (Reference Broutin, Viboud, Grenfell, Miller and Rohani2010) showed that in a number of countries for which incidence data are available prior to and after the introduction of routine infant immunization programmes that, on average, the inter-epidemic period of pertussis increases by 1·27 years.
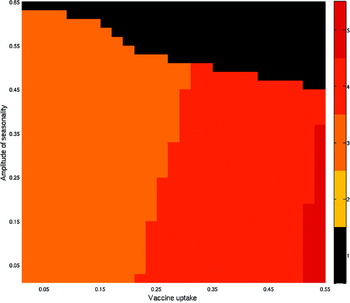
Anticipating our analysis of pertussis in Thailand as a case study, we point out that periodicity in infectious disease systems is determined by a combination of the amplitude of seasonality β 1 the vaccination coverage p and the pathogen transmission potential, as quantified by the basic reproductive ratio, R 0, (Bailey, Reference Bailey1975; Anderson and May, Reference Anderson and May1991; Bauch and Earn, Reference Bauch and Earn2003; Keeling and Rohani, Reference Keeling and Rohani2008). Focusing on the former two, we used global wavelet analysis (described in greater detail in subsequent sections) to determine the dominant, statistically significant period of model output over various values of p and β 1 (Fig. 2). For low levels of seasonality, as vaccine uptake increases, there is a clear increase in the inter-epidemic period, consistent with empirical observations (Rohani et al. Reference Rohani, Earn and Grenfell2000; Grenfell et al. Reference Grenfell, Bjørnstad and Kappey2001; Broutin et al. Reference Broutin, Guegan, Elguero, Simondon and Cazelles2005, Reference Broutin, Viboud, Grenfell, Miller and Rohani2010). Importantly, when seasonality is strong, multiennial epidemics give way to annual outbreaks, providing an example of ‘harmonic oscillation’.
Dominant statistically significant multiennial period from the global wavelet spectrum for various levels of vaccine uptake and amplitude of seasonality. Black regions indicate that the only significant period is annual, and in this example there are no parameter combinations that result in a dominant 2-year signal. The model is the same used in Fig. 1 with γ = 1/21 and the initial number of susceptible individuals (S 0) chosen to fall above its critical threshold.

Understanding the periodicity of infectious diseases has clear public health implications – the timing of epidemics could directly affect the design and effectiveness of vaccination programmes. In the model presented in this section, we considered only routine vaccination such that some fraction p of newborns were vaccinated. An alternative method that has been proposed is pulsed vaccination, which recommends episodic vaccination campaigns that ensure the fraction susceptible is always below the epidemic threshold. This approach has been discussed as a potential strategy for eliminating diseases including measles and polio (Nokes and Swinton, Reference Nokes and Swinton1997) and the current World Health Organization strategies for controlling polio are heavily centered on administering vaccines annually on a designated national immunization day (Heymann and Aylward, Reference Heymann and Aylward2004). However, as shown by Choisy et al. (Reference Choisy, Guégan and Rohani2006), under some circumstances, a pulse vaccination strategy can result potentially in increased numbers of infectious individuals. Further, these authors stress the importance of accounting for many aspects of the disease dynamics, including seasonal transmission.
Pathogen persistence, synchrony and spatial interactions
Persistence is a fundamental concept in population ecology, with long-standing contentious debates on the central determinants of population regulation. This concept is especially important in applied ecology, where conservation biologists aim to understand those factors that promote the persistence of endangered populations, or may limit the spread of invasive species in their non-native habitats. Therefore, commonly addressed questions in many ecological contexts include the determinants of persistence, the relevant spatial scale of dispersal and the appropriate spatially structured intervention strategies to ensure conservation of endangered species and the management of pest or invasive species. There is an obvious connection between spatial ecology and infectious disease systems (Nee, Reference Nee1994; Grenfell and Harwood, Reference Grenfell and Harwood1997). Studies of infectious diseases have a central goal of finding determinants of pathogen persistence within a host population and ultimately utilizing these findings to attempt to prevent epidemics and control the pathogen. Further, host-pathogen interactions operate on multiple spatial scales, making it essential to consider persistence dynamics at the appropriate scales.
First introduced in 1957 by Bartlett, the Critical Community Size (CCS), or the population size below which a particular pathogen exhibits frequent extinctions, is a central concept in disease persistence (Bartlett, Reference Bartlett1957). The CCS is expected to increase following the onset of vaccination, indicating frequent extinctions in large populations as a consequence of reduced pathogen transmission. For example, Rohani et al. (Reference Rohani, Earn and Grenfell2000) demonstrated that following the onset of pertussis immunization programmes in England and Wales, there was a dramatic increase in the observed CCS. Similar findings have been documented for pertussis in Niakhar, Senegal (Broutin et al. Reference Broutin, Simondon and Guegan2004). Importantly, estimating the CCS can identify populations that are less likely to exhibit stochastic extinctions and consequently inform vaccination strategies (Grenfell et al. Reference Grenfell, Bjørnstad and Kappey2001).
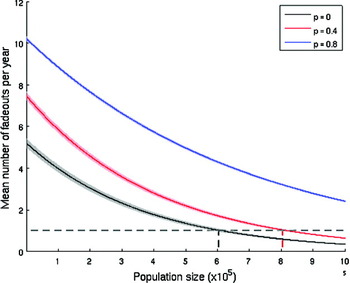
One method of quantifying the CCS is by identifying the relationship between population size and the mean number of fade-outs, or stochastic extinctions, per year. Stochastic SIR-type models provide a means to estimate the CCS; however, the resulting CCS will vary depending on model assumptions and parameters (Conlan et al. Reference Conlan, Rohani, Lloyd, Keeling and Grenfell2010). We illustrate these concepts by implementing a simple SIR model with stochastic infectious imports for three different levels of vaccine uptake. Defining a fade-out is disease specific and depends on the characteristic generation length (the time to recovery once an individual contracts an infection) of that pathogen. Pertussis, for example, has a latent period of ∼8 days followed by a mean infectious period of 14–21 days (Crowcroft et al. Reference Crowcroft, Stein, Duclos and Birmingham2003; Wearing and Rohani, Reference Wearing and Rohani2009). Here, it is reasonable to assume that a fade-out had occurred and the chain of transmission was broken when no cases were reported for at least one month. Averaging over 100 stochastic realizations of the model, we estimate the mean number of fade-outs per year over 50 years for various different population sizes. To obtain an approximation of the CCS, an exponential curve is fitted to the output and in the absence of vaccination it is estimated that the CCS is ∼600,000 for the specified per capita birth rate (Fig. 3, black line). When vaccine uptake reaches 40%, the CCS increases to ∼8 × 10⁵ (Fig. 3, red line) and when vaccine uptake is increased to 80% the CCS is in excess of 106 (Fig. 3, blue line).
Mean number of disease extinctions per year over 100 realizations of 50 years using Gillespie's algorithm to simulate a basic SIR model. Parameters are identical to those used in Fig. 1 with transmission held constant at β 0 and a stochastic import rate of 2 per 105 individuals per year. Black holds vaccine uptake p at 0, red at 0·4, and blue at 0·8. The lines represent the best fit exponential curve and the shading indicates the standard errors. The horizontal grey dashed line is the extinction threshold and the vertical black and red dashed lines represent the CCS for P = 0 and P = 0·4, which are found to be ∼6 × 10⁵ and ∼8 × 10⁵, respectively. The CCS when P = 0·8 is greater than 106.

Importantly, in the absence of importation of infectious individuals, the pathogen would remain extinct. This highlights the importance of understanding the patterns of spatial synchrony. Crucially, asynchrony in the timing of epidemics between neighbouring populations facilitates this reseeding of infections to prevent local extinction, known as the rescue effect in ecology (Brown and Kodric-Brown, Reference Brown and Kodric-Brown1977). The importance of synchrony and the rescue effect is demonstrated in measles dynamics in England and Wales. Prior to vaccination, fade-outs were only observed in rural communities, with a critical community size of 250,000–300,000. In this era, there was also strong spatial synchrony in measles epidemics across England and Wales (Bolker and Grenfell, Reference Bolker and Grenfell1996; Rohani et al. Reference Rohani, Earn and Grenfell1999). The introduction of national pediatric vaccination led to a dramatic decline in measles incidence, but, paradoxically, did not increase the critical community size as would be expected from theory (Bolker and Grenfell, Reference Bolker and Grenfell1996). A potential explanation for this surprising phenomenon lies in the spatial ecology of measles. Specifically, it has been shown that the onset of immunization coincided with a significant decline in spatial synchrony across populations (Bolker and Grenfell, Reference Bolker and Grenfell1996; Rohani et al. Reference Rohani, Earn and Grenfell1999), which may have promoted the persistence of measles at the national scale (Earn et al. Reference Earn, Rohani and Grenfell1998; Rohani et al. Reference Rohani, Earn and Grenfell1999; Grenfell et al. Reference Grenfell, Bjørnstad and Kappey2001). This example demonstrates that patterns of synchrony can shed light on important though paradoxical behaviour of infectious disease dynamics. Moreover, it stresses the importance of spatial synchrony in the context of disease control and eradication.
The rescue effect falls under the umbrella of metapopulation dynamics and these concepts are tightly bound to understanding the drivers of movement of individuals between populations, which, in turn, allows for local persistence via the rescue effect. Incidence of dengue virus in Thailand, for example, is characterized by strong annual variability (Cummings et al. Reference Cummings, Irizarry, Huang, Endy, Nisalak, Ungchusak and Burke2004). It is likely shaped by several interacting factors including climatic patterns which influence vector dynamics, thereby initially complicating the identification of clear spatio-temporal patterns. Cummings et al. (Reference Cummings, Irizarry, Huang, Endy, Nisalak, Ungchusak and Burke2004) however, analysed the spatial synchrony of multiennial epidemics finding that spatial synchrony largely declined with distance. This decline in synchrony with distance indicated diffusive spread originating in Bangkok, the country's capital and largest city. Such spatial hierarchies have also been observed in other contexts. For example, spatial signatures may arise from gravity coupling or the concept that the degree of host migration is proportional to the product of the population density of their locations divided by the square of the distance between them. This is parallel to the concept of source-sink dynamics in that high-density population centres (or sources) can reseed infection in low-density populations (or sinks). Work-flow patterns, rather than geographical distance, have been demonstrated to exhibit this type of gravity coupling with seasonal influenza spread significantly correlated with work-flow (Viboud et al. Reference Viboud, Bjørnstad, Smith, Simonsen, Miller and Grenfell2006). Clearly, understanding these dynamics has implications in both predicting and targeting high-risk regions in vaccination programs.
PERTUSSIS IN THAILAND AS A CASE STUDY
Pertussis is a highly infectious respiratory disease caused by the Gram-negative bacterium Bordetella pertussis and is transmitted directly via aerosol droplets between infected and susceptible individuals. Pertussis vaccination programmes were introduced in many developing countries in the 1940s and 1950s, leading to a substantial decline in incidence. However, a rise in incidence has been recently reported in many highly vaccinated countries, including the United States and several European countries (Bass and Stephenson, Reference Bass and Stephenson1987; Celentano et al. Reference Celentano, Massari, Paramatti, Salmaso and Tozzi2005). Moreover, the burden of pertussis remains significant and is a major public health priority accounting for nearly 300,000 pediatric deaths worldwide, primarily in developing countries (Crowcroft and Pebody, Reference Crowcroft and Pebody2006).
In the following sections, we apply several metrics founded in the ecological concepts outlined in the previous sections to a high-resolution dataset of pertussis incidence in Thailand from 1981–2000. The data were obtained from the Ministry of Public Health and are comprised of monthly case reports over the duration of the time period for each of Thailand's 72 provinces. We additionally utilize population data obtained from the National Statistical Office of Thailand (1980, 1991, 2001).
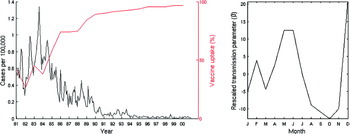
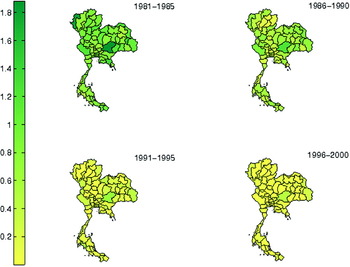
In Thailand, mass vaccination efforts began in 1977 with the National Expanded Programme on Immunization (EPI) (Bhunbhu, Reference Bhunbhu1989). We separate the data into two distinct vaccine periods: from 1981–1989 where vaccine uptake had a low of 26% in 1982 and continued to rise throughout the decade, and from 1990–2000 when vaccine uptake maintained levels greater than 90%. This level of vaccine uptake was maintained across all provinces. Over the duration of these two eras, pertussis incidence declined at the national level (Fig. 4A) as well as the provincial level (Fig. 5). This dataset allows for a comparative analysis of pre-vaccine versus vaccine era dynamics.
A. Time series of pertussis incidence in Thailand (black) and annual vaccine uptake (red). B. Monthly transmission parameters estimated using the TSIR framework. Parameters are normalized to have zero mean.

Log transform of mean annual incidence in each of Thailand's provinces from 1981–1985 (top left), 1986–1990 (top right), 1991–1995 (bottom left), and 1996–2000 (bottom right). This demonstrates a decline in incidence across all provinces corresponding the increases in vaccine uptake.

Temporal dynamics and periodicity
Seasonal transmission patterns have clear implications in infectious disease research, as described in previous sections. Given a time series of incidence data, a time series SIR (TSIR) model has been proposed as a method of estimating seasonal transmission parameters β(t) (Finkenstädt and Grenfell, Reference Finkenstädt and Grenfell2000; Finkenstädt et al. Reference Finkenstädt, Bjørnstad and Grenfell2002). These methods have been used to determine seasonal transmission rates in several other infectious diseases, including measles, mumps and pertussis (Finkenstädt et al. Reference Finkenstädt, Bjørnstad and Grenfell2002; Metcalf et al. Reference Metcalf, Bjørnstad, Grenfell and Andreasen2009; Mantilla-Beniers et al. Reference Mantilla-Beniers, Bjørnstad, Grenfell and Rohani2010). Using similar methods, Fig. 4B displays the estimated seasonal transmission of pertussis in Thailand (see ESM for details). Interestingly, the Thailand data exhibit very strong seasonality, as characterized by the high estimated seasonal amplitude. This strong seasonality is evident by observing the incidence dynamics during the 1980s (Fig. 4A). The peak of transmission occurs between May and June, which corresponds to both the beginning of the rainy season in addition to the start of the school year and consequently, one of these factors may drive this seasonal pattern.
We explore the periodicity of pertussis in Thailand using the Fourier transform (Chatfield, Reference Chatfield1996). Here, a time series is transformed into its frequency domain and the power at a particular frequency (the inverse of the period) can be quantified. This approach assumes that the time series is stationary, or that a particular periodic signal remains constant throughout the course of a time series. Infectious diseases, however, generally exhibit non-stationarity, especially when comparing pre- and post-vaccination eras. For example, pre-vaccine measles in England and Wales was characterized by a biennial period but in the post-vaccine era the epidemics were significantly smaller with a longer multiennial period (Bolker and Grenfell, Reference Bolker and Grenfell1996; Rohani et al. Reference Rohani, Earn and Grenfell1999). As previously discussed, the onset of vaccination usually corresponds to an increase in the interepidemic period by depleting susceptible recruitment, resulting in a longer waiting time before a successive epidemic. Such increases in inter-epidemic period have previously been reported in pertussis dynamics (Rohani et al. Reference Rohani, Earn and Grenfell2000; Broutin et al. Reference Broutin, Guegan, Elguero, Simondon and Cazelles2005, Reference Broutin, Viboud, Grenfell, Miller and Rohani2010; Wearing and Rohani, Reference Wearing and Rohani2009).
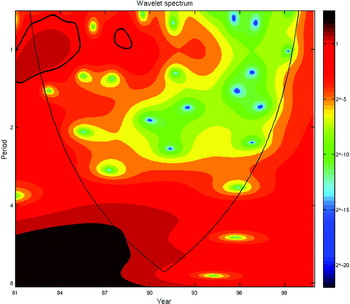
To account for non-stationarity in disease dynamics, wavelet analysis is a popular alternative approach and has been used to study periodicity in many infectious diseases including dengue fever, measles and pertussis (Broutin et al. Reference Broutin, Guegan, Elguero, Simondon and Cazelles2005; Johansson et al. Reference Johansson, Cummings and Glass2009; Mantilla-Beniers et al. Reference Mantilla-Beniers, Bjørnstad, Grenfell and Rohani2010; Thai et al. Reference Thai, Cazelles, Nguyen, Vo, Boni, Farrar, Simmons, Rogier van Doorn and de Vries2010). In summary, wavelet analysis uses a family of functions to decompose the time series into time-frequency space so that local variation in periodicity can be studied. Furthermore, analogous to the Fourier transform, the global wavelet spectrum can be computed by averaging the wavelet spectrum over time. We perform wavelet analysis by implementing the methodology and wavelet software provided by Torrence and Compo (Reference Torrence and Compo1998a, Reference Torrence and Compob).
Fig. 6 provides a wavelet analysis of the national incidence time series in Thailand, with thick black lines identifying statistically significant periods. From this, it becomes evident that there were only significant annual epidemics prior to 1990. After this period (and after vaccine uptake reached levels >90%), the annual periodicity is no longer significant. Importantly, there are no significant multiennial periods. We submit that this is a direct consequence of the high amplitude of seasonality observed in Fig. 4B. As demonstrated in Fig. 2, when the seasonal amplitude is large the epidemiological dynamics are characterized by annual outbreaks.
Wavelet analysis of pertussis in Thailand. The thin black line indicates the ‘cone of influence’, regions inside of which are not influenced by edge effects (a consequence of using a finite time series) (Torrence and Compo, Reference Torrence and Compo1998b). The thick black circles indicate statistical significant periods, and the colour map indicates power with dark red representing the highest observed power. Periods are statistically significant if their power falls above the red noise spectrum. A significant annual period is observed in the early 1980s and becomes damped following the onset of vaccination.

Pathogen persistence, synchrony and spatial interactions
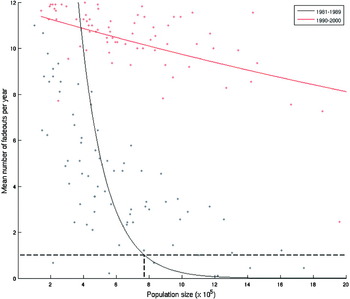
The CCS is an important metric used to determine the population size below which a pathogen exhibits frequent extinctions. Using the same definition of a fade-out as that used in Fig. 3, we estimated a CCS of ∼7·7 × 105 in the beginning years of immunization programmes in Thailand from 1981–1989 (Fig. 7). In contrast, from 1990–2000 the CCS cannot be identified because frequent extinctions occur for all population sizes of provinces in Thailand. This indicates a much larger CCS, providing indication that increased vaccine uptake has successfully reduced transmission.
Mean number of fade-outs per year in each of Thailand's provinces with exponential curves fit to the data. Bangkok is included in the fit but not shown in the figure, as its population size is much larger than the other provinces. Black is over the time period of 1981–1989 and red is 1990–2000. The horizontal dashed line indicates the fadeout threshold and the vertical line indicates the critical community size. A CCS of approximately 7·7 × 105 is observed prior to 1990 and after 1990 the CCS is greater than 2 × 10⁶.

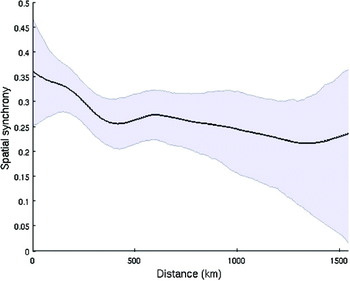
Several mechanisms can drive spatio-temporal patterns in disease incidence and synchrony plays a large role in identifying these spatial patterns. A commonly used indicator of spatial synchrony is through the non-parametric spatial covariance function, which provides a quantitative measure of spatio-temporal dependence between time series when plotted against distance between locations (Bjørnstad and Falck, Reference Bjørnstad and Falck2001). We determined the synchrony of pertussis in Thailand using the time series of pertussis case notification for each of Thailand's 72 provinces (Fig. 8). The figure displays a smoothed spline fit to the correlation coefficients, with the 95% confidence region in blue and a correlation coefficient of one corresponds to strong synchrony and a value of zero indicates no correlation. Here there is initially a small decline in synchrony with distance – which can indicate diffusive spread – but more critically there is a strong baseline synchrony between provinces in that, regardless of distance, provinces maintain roughly the same level of synchrony. Moreover, the baseline level of synchrony is higher than previous studies of pertussis. Specifically, we documented a baseline synchrony of 0·28, while the comparable value was only 0·14 in the pre-vaccine era in England and Wales (Rohani et al. Reference Rohani, Earn and Grenfell1999). Again, we consider this to be due to the strong seasonal forcing of pertussis transmission in Thailand (Fig. 4B) – the seasonality generates epidemics throughout the provinces of Thailand that peak in similar months. This consistency throughout Thailand diminishes the impact of spatial interactions.
Spatial synchrony of pertussis incidence between each of Thailand's provinces. The dark black line is a smoothed spline to the output and the blue shading indicates 95% confidence intervals.

As described in previous sections, it has also frequently been found that diffusion emanating from large population centres can promote global persistence. Declining synchrony with distance from a population centre can indicate this type of spatial spread (e.g. Grenfell et al. Reference Grenfell, Bjørnstad and Kappey2001; Cummings et al. Reference Cummings, Irizarry, Huang, Endy, Nisalak, Ungchusak and Burke2004; Viboud et al. Reference Viboud, Bjørnstad, Smith, Simonsen, Miller and Grenfell2006). To determine the presence of this type of spatial hierarchy, we additionally determined synchrony as a function of distance from Bangkok, which is the capital of Thailand and also has the largest population. Again we see a similar pattern to that observed in Fig. 8, indicating that highly synchronized annual epidemics limit the existence of spatial hierarchies (Blackwood et al. unpublished data).
DISCUSSION
Integrating concepts from population ecology into infectious disease research has led to a large body of literature dissecting the determinants of observed host-pathogen spatio-temporal dynamics. Importantly, a mechanistic understanding of epidemiological dynamics permits inferences to be made about the potential impacts of changes, be they the implementation of novel vaccination schemes, secular trends in population demography or pathogen biology. We have attempted to motivate the use of ecological concepts in disease research through simple theoretical explorations in addition to empirical examples of ecological metrics applied to case notification data of pertussis in Thailand. Importantly, each of the described concepts has implications in evaluating immunization programmes and minimizing the mortality and morbidity associated with disease.
While we have emphasized the spatio-temporal patterns that shape pathogen persistence and the periodicity of epidemics, other population-level facets affect disease dynamics. For example, demographic changes directly affect the recruitment rate of susceptibles which, in turn, affects the force of infection by modulating the proportion of the population in the immune class. These impacts of birth rate on the force of infection have been shown to have important consequences on the transmission of dengue in Thailand, which underwent a demographic transition to lower birth rates resulting in a lower force of infection (Cummings et al. Reference Cummings, Iamsirithaworn, Lessler, McDermott, Prasanthong, Nisalak, Jarman, Burke and Gibbons2009). Furthermore, integration of ecology and epidemiology is not limited to well-established infectious diseases of humans as we emphasize here; the threat of emerging and re-emerging infectious diseases in humans and wildlife poses challenges to our current understanding of host-pathogen interactions. Ecological mechanisms driving ‘emergence events’ are largely unknown, presenting unpredictable threats to human health. It is therefore a public health priority to identify these mechanisms, illustrating the urgency in fostering collaboration between ecologists and epidemiologists.
Multidisciplinary approaches to deciphering infectious disease dynamics have successfully improved our understanding of host-pathogen interactions, but infectious diseases remain a major source of mortality and morbidity worldwide. Collaboration will help to break new ground and confront future challenges caused by both pre-existing and emerging infectious diseases. Concerted efforts are required to obtain the necessary data (e.g. high resolution case notification and demographic data) to identify patterns and trends in the dynamics of host-pathogen interactions. This provides a test-bed for ecological theory, and importantly also provides a means to develop our understanding of the consequences of vaccination or other control measures on disease. Many challenges remain in infectious disease research, and we stress that the integration of ecology and epidemiology has critical implications in public health.
FINANCIAL SUPPORT
PR and DATC were supported by the RAPIDD program of the Science and Technology Directorate, Department of Homeland Security, and the Fogarty International Center, National Institutes of Health as well as the Bill and Melinda Gates Vaccine Modeling Initiative. HB was funded by the Intramural Research Group of Fogarty International Center, National Institutes of Health. DATC holds a Career Award at the Scientific Interface from the Burroughs Welcome Fund.
SUPPLEMENTARY INFORMATION
Supplementary information includes technical details of the susceptible reconstruction and TSIR estimation methods for seasonal transmission rats. See Cambridge Journals On-Line, Parasitology.