Introduction
Tar Spot Complex of Maize (TSC) is one of the major foliar fungal diseases of maize in tropical and sub-tropical environments of some parts of Latin America, mainly in places with higher humidity and moderate climates. The grain loss due to the TSC disease ranges from 50 to 75% depending on the susceptibility of the host and favorable environmental conditions (Hock et al., Reference Hock, Krans and Renfro1989; Pereyda-Hernández et al., Reference Pereyda-Hernández, Hernández-Morales, Sandoval-Islas, Aranda-Ocampo, de León and Gómez-Montiel2009). Three different fungal pathogens are involved in the disease complex: Phyllachora maydis, Monographella maydis and Coniothyrium phyllachorae (Hock et al., Reference Hock, Kranz and Renfro1992). It is believed that P. maydis and M. maydis play the most important part in the complex causing the maximum damage to the host (Hock et al., Reference Hock, Kranz and Renfro1995).
Resistance to TSC is an important trait that is incorporated to most of the maize lines and hybrids developed by CIMMYT for lowland tropical areas of Latin America. Selection for TSC resistance starts at early generations of breeding population by eliminating susceptible plants. Later on, more advanced generations of the maize lines and hybrids are screened for disease resistance in trials in multiple locations for several years.
The first symptoms of the disease appear as dark spots (stromas) of P. maydis on the leaf surface (both lower and upper leaves) usually 2–3 weeks before flowering and the pustules gradually increase in numbers and size. Approximately two weeks later, the area surrounding the dark spots becomes chlorotic due to the development of the second parasite, M. maydis, and develop into the typical “fish eye” symptoms. Usually the chlorotic spots are round or oval in shape but if the disease is developing aggressively the chlorotic circles coalesce and the entire leaves become necrotic, thus affecting the photosynthetic activity and reducing the grain yields.
The phenotyping for TSC resistance is performed on a 1 to 5 scale where 1 represents a completely resistant reaction and 5 is a completely susceptible reaction. The evaluation is done in the field, in adult plants, usually at or just after flowering by visually observing the diseased plots and recording the disease score. This is repeated three to five times during the growing season depending on the disease development. Often the notes, for the severity of the disease are recorded by different personnel causing discrepancies in the disease severity score notes. In addition, preliminary field phenotyping trials are often very large and are time consuming for disease note taking.
Light interception on the leaf surface is differentially absorbed, transmitted or reflected by the leaf depending on its internal structure, chemical composition or physiological status. Spectral imaging sensors detect electromagnetic waves including those not visible to the human eye such as infrared radiation. These data can be combined to identify specific plant features that may not be evident in the visible spectrum. Measuring spectral reflectance can thus be used to inform on the health status of the whole plant or to quantify disease infected areas of the plant (Simko et al., Reference Simko, Jimenez-Berni and Sirault2016).
Laboratory-based spectroscopy technologies have been used to detect different kind of diseases in different crops (Bauriegel and Herppich, Reference Bauriegel and Herpich2014; Bauriegel et al., Reference Bauriegel, Giebel and Herpich2011a, Reference Bauriegel, Giebel, Geyer, Schmidt and Herpich2011b; Bergsträsser et al., Reference Bergsträsser, Fanourakis, Schmittgen, Cendrero-Mateo, Jansen, Scharr and Rascher2015). Remote sensing aspects, multispectral and hyperspectral imagery had been previously used for disease phenotyping in different crops, such as powdery mildew and leaf rust on wheat (Franke and Menz, Reference Franke and Menz2007), Cercospora leaf spot, sugar beet rust and powdery mildew on sugar beet (Mahlein et al., Reference Mahlein, Steiner, Hillnhütter, Dehne and Oerke2012), huanglongbing disease in orange trees (Garcia-Ruiz et al., Reference Garcia-Ruiz, Sankaran, Maja, Lee, Rasmussen and Ehsani2013) and cotton root rot in cotton (Yang et al., Reference Yang, Everitt and Fernandez2010). However, to our knowledge, no such study has been conducted regarding phenotyping TSC on maize. Therefore, the current study was designed to explore how multispectral and thermal images taken from an unmanned aerial vehicle (UAV) may be used to phenotype maize genotypes for TSC resistance, by analyzing the phenotypic and genetic correlations among grain yield, disease scorings and the imaging data. If successful, the study may also help with minimizing the chances of human error in disease phenotyping and potentially reduce the workload in preliminary field trials.
Material and Methods
Field site and data collection
The experiment was conducted at the Aguafria Experimental Station of the International Center for Wheat and Maize Improvement – CIMMYT in Mexico. The experiment was planted in a square lattice design consisting of 25 maize genotypes in two main blocks, one under fungicide treatment to control TSC development (figures and tables coded as 714) and the second without the treatment (figure and tables coded as 715) in the spring of 2016. Each block contained three randomized replications. Each experimental plot consisted of four 4.5 m length rows with 0.75 m inter-row and 0.25 m plant spacing within row.
The flight campaign were carried out using a fixed wings eBee UAV from SenseFly, equipped with multispectral MultiSpec 4C (550, 660, 735, 790 nm) and ThermoMAP thermal cameras from Arinov, flying at 55 m above ground, yielding a ground resolution of 6 and 12 cm, respectively. Radiometric calibrations were performed before each flight using the standard panel of the multispectral camera provided by the manufacturer. The first disease scoring and a flight were performed simultaneously at the flowering stage (79 days after planting) and a total of four flights and scorings have been conducted at ten-day intervals.
Images were properly geotagged for orthomosaic process using Pix4D mapper®. Later, 10 different vegetation indices (NDVI, RDVI, OSAVI, MSR, MCARI1 and MCARI2 – structural indices; TVI, GM1, PSSRa - chlorophyll indices; G – RGB ratio) were calculated for each image using the necessary wavelengths from the multispectral signal (Rouse et al., Reference Rouse, Haas, Schell, Deering and Harlan1974; Rougean and Breon, Reference Rougean and Breon1995; Rondeaux et al., Reference Rondeaux, Steven and Baret1996; Chen, Reference Chen1996; Haboudane et al., Reference Haboudane, Miller, Pattey, Zarco-Tejada and Stra-Chan2004; Broge and Leblanck, Reference Broge and Leblanc2000; Gitelson and Merzlyak, Reference Gitelson and Merzlyak1997; Blackburn, Reference Blackburn1998; Zarco-Tejada et al., Reference Zarco-Tejada, Berjón, López-Lozano, Miller, Marin, Cachorro, Gonzales and de Fruto2005).
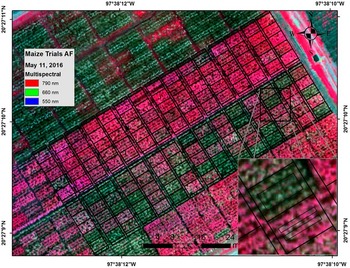
Two approaches for image data extractions were tested: (1) average of all pixels contained in a single polygon of both central rows and (2) average of all pixels contained in double polygons, one for each central row (Fig 1).
Zooming of the data extraction approaches: single polygon of both central rows (1), and double polygons, one for each central row (2).

Data analysis
The results of the two different image data extraction approaches were compared by the Pearson’s correlation coefficient using all available information. The phenotypic data were adjusted with respect to the experimental design terms using the restricted maximum likelihood method and the genotypes’ least square means (genotypic) were estimated. The effects of trials, days after sowing and genotypes were considered as fixed, while replication and blocks within replication were considered as random effects. Thus, both phenotypic and genotypic data were used for individual association by means of the Pearson’s correlation coefficients among grain yield, diseases scorings and vegetation indices in each treatment and each survey date (79, 90, 100 and 113 days after sowing). All analyses were performed with the R software and lme4 and lsmeans packages.
Results and discussion
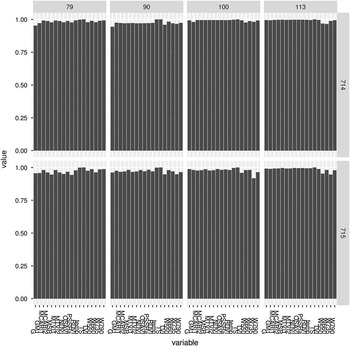
The comparison between both data extraction approaches is presented in Figure 2. Although it was expected that approach 2 (double polygons, Figure 1) would be more accurate since it did not carry the furrow data reflectance, both approaches yielded similar results, with the coefficient of correlation of all VIs, wavelengths and canopy temperature close to 1 (Figure 2). Based on these results, it had been decided to use only the data extracted with approach 2 for the following data analysis.
Coefficient of correlation between both data extraction approaches for VIs, wavelengths and canopy temperature. Where: NDVI, RDVI, OSAVI, MSR, MCARI1 and MCARI2 – structural indices; TVI, GM1, PSSRa – chlorophyll indices; G – RGB ratio; TS – visual disease scoring; temp – canopy temperature; W550, W660, W735, W790 – reflectance wavelengths (nm); 714 – fungicide treatment; 715 – Non-fungicide treatment.

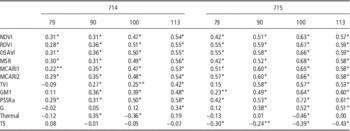
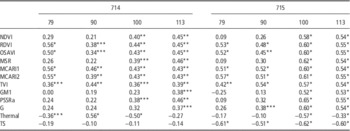
The correlation of the yield phenotypic and genotypic data with VIs, thermal information and disease scoring (TS) are shown in Tables 1 and 2, respectively. The phenotypic correlations demonstrated how the secondary data (images and TS) were related to yield variation in the field without taking into account the genotypic effects, while the genotypic correlations were analyzed based on the least square means of the grain yield, which took into account the effect of the genotype on yield.
Phenotypic correlation between yield, image data and visual scoring (n=75).

Where: NDVI, RDVI, OSAVI, MSR, MCARI1 and MCARI2 – structural indices; TVI, GM1, PSSRa – chlorophyll indices; G – RGB ratio; thermal – canopy temperature; TS – visual disease scoring; 714 – fungicide treatment; 715 – Non-fungicide treatment. 79, 90, 100 and 113 days after sowing. * Coefficients of correlation statistically significant at 1% probability; ** coefficients of correlation statistically significant at 5% probability.
Genetic correlation between yield, image data and visual scoring (n=25).

Where: NDVI, RDVI, OSAVI, MSR, MCARI1 and MCARI2 – structural indices; TVI, GM1, PSSRa – chlorophyll indices; G – RGB ratio; thermal – canopy temperature; TS – visual disease scoring; 714 – fungicide treatment; 715 – Non-fungicide treatment. 79, 90, 100 and 113 days after sowing. * Coefficients of correlation statistically significant at 1% probability; ** coefficients of correlation statistically significant at 5% probability; *** coefficients of correlation statistically significant at 10% probability.
The majority of the image variables showed different degrees of phenotypic correlation with yield in the fields with and without the fungicide treatment, although some variables were not significant (p>0.1). TS showed non-significant correlations with the fungicide treatment since the disease development was controlled. The highest coefficient of TS across the dates was −0.43 in the non-fungicide treatment, which was lower than the correlations of the VIs of the corresponding images. The correlation of the VIs with the yield under the fungicide treatment was slightly higher (p<0.01) with the images acquired from the last flight performed at 113 days after sowing (das). Furthermore, under the non-fungicide treatment the disease scores had lower coefficients than the majority of VIs correlations of the whole flight campaign, being considerably lower in comparison with VIs correlations at with the second flight (90 das; TS=−0.24).
As in case of the phenotypic correlation, no significant genotypic correlation between TS and yield under the fungicide treatment was observed due to the absence of the disease that would have resulted in the reduction of the grain yield. However, correlations have been observed between the VIs, thermal indices and yield. Even though the disease scores showed slightly higher genotypic correlations than the VIs under no fungicide treatment just at the first and last images (-0.61 and -0.60, respectively), the maximum difference of the correlation coefficients reached only 5 units. The correlations of the structural and chlorophyll VIs were higher than and/or equal to TS at the second and the third dates of the flight campaign (90 and 100 das, respectively). The structural and chlorophyll indices, such as MSR and PSSRa, had the highest coefficients among all of the remote sensing variables (0.62 and 0.65, respectively) from the image obtained at 100 das. In other previous studies it was demonstrated that NDVI – which is a structural index, had moderate to high accuracy on distinguishing levels of resistance of wheat infected with leaf rust (Franke and Menz, Reference Franke and Menz2007) and Sunn pest (Genc et al., Reference Genc, Genc, Turhan, Smith and Nation2008).
These preliminary results showing the potential of the remote sensing approach is the first step for developing high throughput phenotyping methods for TSC resistance in maize. Furthermore, the combination of different VIs into multivariate models and machine learning procedures will need to be explored further targeting early detection of the reduction of photosynthetic activities caused by TSC. This could also open further possibilities to develop techniques for upscaling the use of remote sensing in estimating damages cause by TSC in the farmers’ fields, providing information for timely crop management.
Conclusions
Structural and chlorophyll VIs proved to be a promising tool for the estimation of yield losses caused by TSC and offering new opportunities for high throughput phenotyping for resistance of maize to this highly important foliar disease. The experiment will be repeated in the next maize growing cycle to account for possible environmental variability and to ensure the repeatability of the methodology. Also different imagery data extraction methods will be tested to optimize the phenotyping effectiveness and precision while minimizing the possibilities of errors occurring during the process.
Acknowledgements
We would like to thank the Maize CGIAR Research Program (Maize CRP) for providing funds for the study. We are thankful to Mr. Carlos Muñoz for his technical assistance in the field, Ms. Lorena González Pérez for her assistance with the image processing and the Biometric and Statistics Unit of CIMMYT for their support on the data analysis.