Children live within multiple contexts, including the family, the school, and the neighborhood, and characteristics of those contexts contribute to the development of competence or adjustment problems (Bronfrenbrenner, Reference Bronfrenbrenner1979; Cicchetti, Reference Cicchetti1993). Although it can be useful to examine the role of individual risk factors, they seldom operate in isolation (Cicchetti, Reference Cicchetti1993). In fact, they often are highly related both within and across ecological levels (e.g., child, family, school, and neighborhood). Findings from numerous longitudinal studies support the value of a holistic/ecological approach to examining the multiple risk factors associated with children's future adjustment problems (Gorman-Smith, Tolan, & Henry, Reference Gorman-Smith, Tolan and Henry2000; Greenberg, Lengua, Cole, Pinderhuges, & The Conduct Problems Prevention Research Group, Reference Greenberg, Lengua, Coie and Pinderhughes1999; Greenberg, Speltz, DeKlyen, & Jones, Reference Greenberg, Speltz, DeKlyen and Jones2001; Keller, Spieker, & Gilchrist, Reference Keller, Spieker and Gilchrist2005; Rutter, Reference Rutter, Kent and Rolf1979; Sameroff & Seifer, Reference Sameroff, Seifer, Rolf, Masten, Cicchetti, Nuechterlein and Weintraub1990).
This study assumed such a multivariate approach, in which children's characteristics and outcomes are influenced by factors including the social context of their family, the nature of interactions they have with their parents, the quality of their neighborhoods, their experiences with their teachers and classmates, and the climate of their schools. Although we know that each of those factors is contributory, it is less clear how all of those factors interact to lead toward or deflect children from specific outcomes. The beginning of elementary school and the beginning of middle school represent two critical developmental time periods during which the transition in context, along with developmental changes in the child, may place him or her at greater risk for behavior and academic problems (Conduct Problems Prevention Research Group [CPPRG], 1992; Kellam et al., Reference Kellam, Werthamer-Larson, Dolan, Brown, Mayer and Rebok1991). For these reasons, the purpose of this study was to identify in a large and diverse sample of children how known risk factors at different ecological levels co-occurred in kindergarten and led to problematic outcomes by the end of fifth grade.
Individual Risk Factors for Problematic Outcomes
Substantial research has shown that children's own characteristics affect their outcomes. For example, when children have trouble processing information in school, because of specific learning challenges or difficulties paying attention, they are less successful academically, and they often feel frustrated and act out (Hinshaw, Reference Hinshaw1992). It is not surprising that children with lower intellectual or cognitive abilities are at increased risk for a host of future negative outcomes, including poor academic achievement (Montague, Enders, & Castro, Reference Montague, Enders and Castro2005) and serious conduct problems (Burchinal, Roberts, Zeisel, Hennon, & Hooper, Reference Burchinal, Roberts, Zeisel, Hennon and Hooper2006; Burt, Hay, Pawlby, Harold, & Sharp, Reference Burt, Hay, Pawlby, Harold and Sharp2004; Leech, Day, Richardson, & Goldschmidt, Reference Leech, Day, Richardson and Goldschmidt2003). Children's cognitive skills appear to be particularly important in the prediction of later academic and behavioral outcomes for children who are exposed to high-risk social and environmental contexts (Burchinal et al., Reference Burchinal, Roberts, Zeisel, Hennon and Hooper2006; Easterbrooks, Davidson, & Chazan, Reference Easterbrooks, Davidson and Chazan1993; Garmezy, Masten, & Tellegen, Reference Garmezy, Masten and Tellegen1984; Gudonis, Giancola, & Tarter, Reference Gudonis, Giancola, Tarter and Sentowski2007).
When children are hypervigilant to perceived threat in social situations and tend to interpret ambiguous behaviors of peers as hostile, they are more likely to respond aggressively and to have social difficulties (Dodge, Reference Dodge and Perlmutter1986). As such, deficits in early social–cognitive skills, like emotion recognition capabilities and problem-solving strategies, have also been related to a number of negative outcomes, including poor academic achievement, peer rejection, aggression, delinquency, and internalizing problems (Denham, Reference Denham1998; Dodge, Bates, & Petit, 1990; Gumora & Arsenio, Reference Gumora and Arsenio2002; Howse, Calkins, Anastopoulos, Keane, & Shelton, Reference Howse, Calkins, Anastopoulos, Keane and Shelton2003; Izard et al., Reference Izard, Fine, Schultz, Mostow, Ackerman and Youngstrom2001; Leech et al., Reference Leech, Day, Richardson and Goldschmidt2003; Mostow, Izard, Fine, & Trentacosta, Reference Mostow, Izard, Fine and Trentacosta2002; Shields et al., Reference Shields, Dickstein, Seifer, Giusti, Magee and Spritz2001; Sullivan, Reference Sullivan2006).
Once children become oppositional and aggressive, they are more likely to be rejected by children without behavior problems (Patterson, Reid, & Dishion, Reference Patterson, Reid and Dishion1992); this makes it more likely that aggressive children associate with other aggressive children, a situation that can result in reinforcement and further escalation of maladaptive behaviors (Patterson et al., Reference Patterson, Reid and Dishion1992). Early behavior problems are one of the strongest predictors of later antisocial behavior, serious delinquency, school failure, later mental health problems, and eventual unemployment (Burt et al., Reference Burt, Hay, Pawlby, Harold and Sharp2004; Caspi, Moffitt, Wright, & Silva, Reference Caspi, Moffitt, Wright and Silva1998; Hanlon, Bateman, Simon, O'Grady, & Garswell, Reference Hanlon, Bateman, Simon, O'Grady and Garswell2004; Hill, Lochman, Coie, Greenberg, & The Conduct Problems Prevention Research Group, Reference Hill, Lochman, Coie and Greenberg2004; Moffitt, Reference Moffitt1993; Montague et al., Reference Montague, Enders and Castro2005; Robins & Price, Reference Robins and Price1991).
In addition to child characteristics, family demographic factors are among the most important predictors of a wide range of negative child outcomes (Costello, Compton, Keeler, & Angold, Reference Costello, Compton, Keeler and Angold2003; Evans, Reference Evans2004). Family structure is among the most predictive demographic factor for children's outcomes; children from households with single (unmarried) parents have access to fewer economic and psychological resources (Carlson & Corcoran, Reference Carlson and Corcoran2001; McLanahan & Sandefur, Reference McLanahan and Sandefur1994). On average, single parents give less time and attention to their children, have weaker control, make fewer demands, and exhibit lower levels of warmth toward their children compared to two-parent (married) families (Amato, Reference Amato1987; Astone & McLanahan, Reference Astone and McLanahan1991). Living with a single parent, living in poverty, and having parents with low levels of education and/or few job skills places children at increased risk for academic problems (Duncan, Brooks-Gunn, & Klebanov, Reference Duncan, Brooks-Gunn and Klebanov1994; Gutman, Sameroff, & Cole, Reference Gutman, Sameroff and Cole2003; Gutman, Sameroff, & Eccles, Reference Gutman, Sameroff and Eccles2002; National Institute of Child Health and Human Development [NICHD] Early Child Care Research Network, 2005; Prelow & Loukas, Reference Prelow and Loukas2003; Rauh, Parker, & Garfinkel, Reference Rauh, Parker and Garfinkel2003; Yeung, Linver, & Brooks-Gunn, Reference Yeung, Linver and Brooks-Gunn2002). These family demographic risks are also positively related to children's conduct problems (Cote, Vaillancourt, LeBlanc, Nagin, & Tremblay, Reference Cote, Vaillancourt, LeBlanc, Nagin and Tremblay2006; Dodge, Pettit, & Bates, Reference Dodge, Pettit and Bates1994; Duncan et al., Reference Duncan, Brooks-Gunn and Klebanov1994; Harland, Reijneveld, Brugman, Verloove-Vanhorick, & Verhulst, Reference Harland, Reijneveld, Brugman, Verloove-Vanhorick and Verhulst2002; NICHD Early Child Care Research Network, 2005; Sampson & Laub, Reference Sampson and Laub1994; Schultz & Shaw, Reference Schultz and Shaw2003; Yeung et al., Reference Yeung, Linver and Brooks-Gunn2002).
To some degree, those family demographic factors affect children's outcomes because those factors tend to be associated with problems in adult functioning and more stressful life events (Klebanov, Brooks-Gunn, & Duncan, Reference Klebanov, Brooks-Gunn and Duncan1994). Both parent mental health, especially depression, and stressful life events are related to poor cognitive and behavior outcomes in children (Burt et al., Reference Burt, Hay, Pawlby, Harold and Sharp2004; Dodge et al., Reference Dodge, Pettit and Bates1994; Gutman et al., Reference Gutman, Sameroff and Eccles2002, Reference Gutman, Sameroff and Cole2003; Hair, McGroder, Zaslow, Ahluwalia, & Moore, Reference Hair, McGroder, Zaslow, Ahluwalia and Moore2002; Harland et al., Reference Harland, Reijneveld, Brugman, Verloove-Vanhorick and Verhulst2002; Martin, Linfoot, & Stephenson, Reference Martin, Linfoot and Stephenson2005; Prelow & Loukas, Reference Prelow and Loukas2003). Marital conflict, which is often closely tied to parent mental health and stressful life events, further increases children's risk for later conduct problems (Conger & Ge, Reference Conger and Ge1994).
One means by which family demographic characteristics, parent mental health, stressful life events, and marital conflict affect children's outcomes might be by undermining more optimal parenting (Belsky, Reference Belsky1984). Poor parenting practices including child maltreatment, overly harsh discipline, lack of warmth and sensitivity, and inconsistency in implementing routines or enforcing rules have been linked to children's adjustment problems in multiple areas (Cote et al., Reference Cote, Vaillancourt, LeBlanc, Nagin and Tremblay2006; Dodge et al., Reference Dodge, Pettit and Bates1994; McCabe, Lucchini, Hough, Yeh, & Hazen, Reference McCabe, Lucchini, Hough, Yeh and Hazen2005; McMahon & Forehand, Reference McMahon, Forehand, Mash and Terdal1988).
Child and family functioning are also affected by broader ecological environments. For example, concentrated poverty in a community is related to children's lower academic achievement (Gutman et al., Reference Gutman, Sameroff and Eccles2002; Prelow & Loukas, Reference Prelow and Loukas2003; Rauh et al., Reference Rauh, Parker and Garfinkel2003). In addition, when children live in poor and disorganized neighborhoods, they are more likely to display conduct problems and engage in criminal behavior (Sampson & Groves, Reference Sampson and Groves1989; for a review, see Leventhal & Brooks-Gunn, Reference Leventhal and Brooks-Gunn2000). Similarly, when children attend schools that have a greater proportion of poor and/or aggressive students, they are more likely to display externalizing problems themselves (Ingoldsby & Shaw, Reference Ingoldsby and Shaw2002; Kroneman, Loeber, & Hipwell, Reference Kroneman, Loeber and Hipwell2004; McCabe et al., Reference McCabe, Lucchini, Hough, Yeh and Hazen2005; Rutter, Maughan, Mortimore, Ouston, & Smith, Reference Rutter, Maughan, Mortimore, Ouston and Smith1979).
Other important factors to consider when examining the association between individual risks and children's outcomes include race or ethnicity and the urban or rural contexts in which children live. Regardless of socioeconomic differences, children's exposure to various risks, including parenting practices and contextual experiences, vary by race (Bradley, Corwyn, McAdoo, & Garcia Coll, Reference Bradley, Corwyn, McAdoo and Garcia Coll2001; Kilmer, Cowen, Wyman, Work, & Magnus, Reference Kilmer, Cowen, Wyman, Work and Magnus1998). Some risk factors are more prevalent in urban contexts, whereas others are more prevalent in rural contexts (Atav & Spencer, Reference Atav and Spencer2002; Pedersen & Mortensen, Reference Pedersen and Mortensen2001). In addition, the meaning, salience, and impact of risk factors vary by the context in which children live (Armistead, Forehand, Brody, & Maguen, Reference Armistead, Forehand, Brody and Maguen2002; Ackerman, Schoff, Levinson, Youngstrom, & Izard, Reference Ackerman, Schoff, Levinson, Youngstrom and Izard1999; Deater-Deckard, Dodge, Bates, & Pettit, Reference Deater-Deckard, Dodge, Bates and Pettit1998; Garcia Coll & Magnusson, Reference Garcia Coll, Magnusson and Masten1999).
Variable-Centered Approaches to Multiple Risks
Broadly speaking, researchers have taken two general approaches to understand how the presence of multiple risk factors at multiple ecological levels relates to child development: variable-centered approaches and person-centered approaches (Magnusson & Bergman, Reference Magnusson, Bergman and Rutter1988). Variable-centered approaches allow for the quantification of individual risk factors or cumulative indices of risk that, on average, relate to poor outcomes (Sameroff & Seifer, Reference Sameroff, Seifer, Rolf, Masten, Cicchetti, Nuechterlein and Weintraub1990). Burchinal et al. (Reference Burchinal, Roberts, Hooper and Zeisel2000) and Deater-Deckard et al. (Reference Deater-Deckard, Dodge, Bates and Pettit1998) provide good overviews of the advantages and limitations of variable-centered approaches, including multiple regression analysis and the cumulative risk index.
Early work by Rutter (Reference Rutter, Kent and Rolf1979) using the cumulative risk index emphasized the importance of examining multiple risks that exist in conjunction with each other. This represented an important step forward both conceptually and statistically in modeling multiple risks, and was used widely to demonstrate that more risk factors are associated with less adaptive outcomes, but often in a nonlinear manner (e.g., Appleyard, Egeland, van Dulmen, Manfred, & Stroufe, Reference Appleyard, Egeland, van Dulmen, Manfred and Stroufe2005; Gerard & Buehler, Reference Gerard and Buehler2004; Luthar, Reference Luthar1993; Sameroff, Seifer, Baldwin, & Baldwin, Reference Sameroff, Seifer, Baldwin and Baldwin1993; Seifer, Sameroff, Dickstein, Keitner, & Miller, Reference Seifer, Sameroff, Dickstein, Keitner and Miller1996). One disadvantage of this approach is that all risk factors are weighted equally and, perhaps more important, are assumed to be interchangeable. The exposure to two risk factors also is considered to be equal regardless of how highly related they are. For example, the presence of two highly related risk factors, such as parent education and occupational prestige, would provide more redundant information in predicting children's outcomes than the presence of two unrelated or mildly related risk factors, such as parent education and depression. Moreover, such risk indices do not provide insight into how particular risk factors may interact with each other, or how their effects might vary across different subpopulations.
Person-Centered Approaches to Multiple Risks
Although variable-centered approaches have been invaluable in understanding how multiple risks are associated with children's development, a person-centered approach can provide unique insight regarding how an individual's entire spectrum of risk factors interact to predict negative outcomes (Cicchetti & Rogosch, 1993). Person-centered approaches to multiple risks intuitively map on to the real-life experiences of individual children and are more closely aligned with a holistic view of development (von Eye & Bergman, Reference Von Eye and Bergman2003). In such a view, the significance of any one aspect of individual development gains meaning mostly in terms of its relations to other parts of the person–environment system (Lovden, Bergman, Adolfsson, Lindenberger, & Nilsson, Reference Lovden, Bergman, Adolfsson, Lindenberger and Nilsson2005). In other words, the whole is greater than the sum of the individual parts (Bergman & Magnusson, Reference Bergman and Magnusson1997). Previous studies have demonstrated that specific combinations of risk factors that cut across multiple domains better explain the association between early risk and later academic and behavioral outcomes than any single risk factor (e.g., Ackerman et al., Reference Ackerman, Schoff, Levinson, Youngstrom and Izard1999; Burchinal, Roberts, Hooper, & Zeisel, Reference Burchinal, Roberts, Hooper and Zeisel2000; Corapci, Reference Corapci2008).
One person-centered approach is the classification of individuals into groups based on the presence or absence of a small number of risk factors (e.g., Greenberg et al., Reference Greenberg, Speltz, DeKlyen and Jones2001). As the number of individual risk factors increases, however, the number of risk profiles increases exponentially and can become unwieldy. Other studies have used cluster analysis to identify a small number of subgroups of individuals with different risk profiles (e.g., Murdock & Bolch, Reference Murdock and Bolch2005; Roberts et al., Reference Roberts, Seidman, Pedersen, Chesir-Teran, Allen and Aber2000; Sameroff et al., Reference Sameroff, Seifer, Baldwin and Baldwin1993; Seidman et al., Reference Seidman, Chesir-Teran, Friedman, Yoshikawa, Allen and Roberts1999; Yoshikawa & Seidman, Reference Yoshikawa and Seidman2001).
Latent class analysis (LCA) is conceptually similar to cluster analysis but is based on a measurement model much like factor analysis. This person-centered approach posits that there are underlying subgroups, or latent classes, of individuals who share similar characteristics, but that true subgroup membership is unknown and can be inferred only through the measurement of a set of observed characteristics, which in the case of LCA are categorical indicators. LCA is a model-based procedure in which models with different numbers of latent classes (e.g., one vs. two, two vs. three, three vs. four) can be compared by using parameter estimates, fit statistics, and model information criteria to determine the most parsimonious summary of all observed patterns of responses to the individual items. The optimal number of latent classes is identified, and each individual child has a (typically nonzero) probability of being a member of each of those classes. A comprehensive overview of LCA can be found in Collins and Lanza (Reference Collins and Lanza2010).
Although LCA has been applied to many multidimensional constructs, including temperament (Stern, Arcus, Kagan, Rubin, & Snidman, Reference Stern, Arcus, Kagan, Rubin and Snidman1995), depression (Lanza, Flaherty, & Collins, Reference Lanza, Flaherty, Collins, Schinka and Velicer2003), teaching style (Dewilde, Reference Dewilde2004), and alcohol use behavior (Lanza, Collins, Lemmon, & Schafer, Reference Lanza, Collins, Lemmon and Schafer2007), it has not been well demonstrated in the literature, as applied to the study of multiple risks. Only very recently has this type of approach been proposed for modeling multiple risks. For example, Parra, DuBois, and Sher (Reference Parra, DuBois and K. J2006) used a related technique, latent profile analysis, to identify four underlying groups of adolescents based on continuous indicators from five ecological levels (i.e., individual, family, peer, school, and neighborhood) and related group membership to depression and conduct problems.
The Current Study
We investigated how combinations of diverse risk factors interact to predict outcomes in children living in diverse but disadvantaged communities. We relied on multiple methods and multiple informants, including direct child assessments, parent interviews, teacher questionnaires, interviewer ratings, direct observations, and public records to assess risk factors in 13 domains related to the child, family, parenting, and community that were present at the end of kindergarten. As part of our analyses, we compared the cumulative risk index to the innovative person-oriented method, LCA, in predicting children's functioning at the end of elementary school in Grade 5 and summarized prevention implications that could be drawn based on the different approaches to modeling multiple risks.
Hypotheses
We expected there would be a relation between the cumulative risk index, computed in kindergarten, and each of the indicators of academic and behavior problems in Grade 5. We hypothesized, however, that those relations would be less informative than the results from our LCA analyses in terms of specific implications for prevention.
The purpose of LCA and related analytic techniques is primarily descriptive. It distills vast amounts of information and identifies patterns that are difficult to detect a priori. We hypothesized that we could identify a relatively small number of risk profiles that would capture parsimoniously the variability in the intersection of risks in our large sample. We did not anticipate that the structure of the latent classes of risk factors would differ by race and locality (i.e., urban vs. rural), but we did expect prevalence rates to differ substantially across those dimensions (Rowe, Reference Rowe1994). Despite the fact that all participants lived in relatively disadvantaged communities, we expected to identify a substantial portion of our sample that was experiencing relatively few risk factors (Werner & Smith, Reference Werner and Smith1992; Wyman et al., Reference Wyman, Cowen, Work, Hoyt-Meyers, Magnus and Fagen1999). Because the LCA approach can be used effectively to identify sample heterogeneity even within a single risk factor, we also expected to be able to differentiate distinct classes of one-parent families and distinct classes of two-parent families that were and were not characterized by other risk factors. For instance, we expected that some one-parent families would experience relatively few risk factors and that some two-parent families would experience multiple risk factors (Foster & Kalil, Reference Foster and Kalil2007). Because of the cascading effects of some problems, we also expected that many children in our sample would experience risk factors at most ecological levels.
With regard to the association between risk profile membership and Grade 5 academic and behavioral problems, we had two hypotheses. First, we expected that profiles characterized by risks that cut across multiple domains would be associated with increased academic and behavioral difficulties, compared to profiles characterized by risks in any single domain. Second, given evidence that children's skills are particularly important within the context of risky environments (e.g., Garmezy et al., Reference Garmezy, Masten and Tellegen1984), we expected that profiles that are characterized by low levels of risk in the child domain would be at lower risk for later academic and behavior problems relative to those profiles characterized by high levels of risk in the child domain.
Methods
This study relied on data from Fast Track, a multisite, multicohort research project designed to study and change the development of serious conduct problems among aggressive children (CPPRG, 1992). This study included children and their families from the schools assigned to the control condition in Fast Track. It did not include those children from the schools assigned to the intervention condition; none of the children in this study received prevention services from Fast Track.
Fast Track recruited children and families from four distinct communities in the United States. These communities were (a) Durham, North Carolina, a small city with many low- to middle-socioeconomic status (SES) African American families; (b) Nashville, Tennessee, a moderate-sized city with many low- to middle-SES African American and European American families; (c) Seattle, Washington, a moderate-sized city with many low- to middle-SES, ethnically diverse families, including European Americans, African Americans, Asian and Pacific Islanders, Latinos, and Native Americans; and (d) central Pennsylvania, a rural area with mostly low- to middle-SES, two-parent, European American families.
Screening and recruitment
Schools within each of the four sites were selected because they served neighborhoods with high rates of poverty and crime. Teachers completed the 10-item Authority Acceptance Scale of the Teacher Observation of Child Adjustment—Revised (Werthamer-Larsson, Kellam & Wheeler, Reference Werthamer-Larsson, Kellam and Wheeler1991) for all children attending kindergarten in those schools during three successive academic years. When children received scores in the top 40% for their schools, their parents completed similar ratings about behavior problems at home.
A “normative” sample of 387 children was selected to represent the full range of behavior problems (or lack thereof) in these high-risk schools, based on teacher ratings alone. A high-risk sample of 446 children were selected to represent the 10–20% most extreme cases of aggressive and oppositional behavior problems, based on a standardized sum of the teacher and parent ratings. Starting with the highest total score and moving downward, we successfully recruited about 90% of all eligible children and families until desired sample sizes were reached within schools and cohorts.
Although we did not use the Teacher's Report Form (TRF; Achenbach, Reference Achenbach1991b) to screen children, we did use it to assess the relative severity of our sample. The children in our normative sample received an average externalizing scale t score of 55.93 (SD = 11.80), which was about 0.5 SD above the average for a large nationally representative sample of children and consistent with the fact that the “normative” children in Fast Track were from schools serving relatively poor and dangerous neighborhoods. The children in our high-risk sample received an average externalizing scale t score of 66.35 (SD = 10.59), indicating that average behavior problems were in the clinical range and comparable to those of children receiving treatment services in mental health settings.
Sample
This study included the children and families from both the normative and high-risk control samples. By design, the severity of behavior problems in the highest quintile of the normative sample were comparable to the severity of behavior problems in the high-risk sample; thus, 79 children were considered part of both samples. There were 185 European American families living in one of the three urban sites, 373 African American (including 30 biracial or ethnic minority) families living in one of the three urban sites, 192 European American families living in rural Pennsylvania, and 4 African American families living in rural Pennsylvania. Because of the small size of this last locality–race group, those four families were excluded from all analyses, resulting in a final sample of 750 children and their families (i.e., 387 children in the normative sample + 446 children in the high-risk sample – 79 children who were part of both samples – 4 rural African American children in our rural site).
Fifty-eight percent of the children in this sample were male, and 42% were female. At the beginning of the study, children were an average of 6 years, 5 months old (SD = 5 months). At the end of this study, they were 5 years older.
Forty-four percent of the families in this study included a single parent only (>95% of whom were mothers or female relatives). Approximately 64% of the families were in the lowest two categories of SES (Hollingshead, Reference Hollingshead1975). Twenty percent of the families did not include a parent who had graduated from high school, and 31% of families did not include a parent who had a job requiring specialized skills.
Procedure
Data were collected from teachers, school records, and government records, as well as from parents and children during summer home interviews. Research staff members completed extensive training in conducting home interviews and were required to make reliable ratings before collecting data on their own. During home interviews, one research staff member met with the parent, and another research staff member met with the child in a separate room. All questionnaire items were read to both parents and children.
Measures
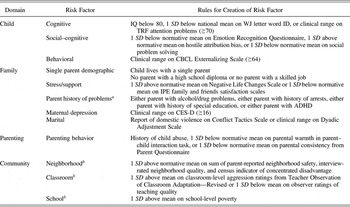
We assessed the presence or absence of risk present at the end of kindergarten in 13 domains related to the child, family, parenting, and community. Within certain domains, we chose to combine two or more indicators of risk to assess whether any risk was present in the broader conceptual domains. For example, an indicator reflecting “no parent with a high school degree” was combined with an indicator reflecting “no parent with a job requiring specialized skills” to create a single risk indicator within the family demographic risk domain (see below for more details). In theory, each specific risk indicator could be included in a latent class model, although the number of possible response patterns can become unwieldy, causing issues with model identification. Although indicators of risk that were combined within domains were not equivalent, the composites we created were supported by the literature or based on very high correlations among the indicators, and were formed in a way to represent the presence of any risk in the domain.
Although many risk factors in this study were dichotomous by nature, several continuous measures of risk were transformed to dichotomous risk factors to facilitate our examination of the relation between exposure to multiple risks and adverse outcomes. This was also necessary to make a direct comparison between the cumulative risk index and LCA. Modeled on previous research (e.g., Burchinal et al., Reference Burchinal, Roberts, Hooper and Zeisel2000; Deater-Deckard et al., Reference Deater-Deckard, Dodge, Bates and Pettit1998; Gerard & Buehler, Reference Gerard and Buehler2004), dichotomous indicators for risk factors were created according to commonly accepted criteria, such as parents' graduation from high school, or using previously established clinical range thresholds. In the absence of such cut points, we used 1 SD from the national mean, or, if unavoidable, 1 SD from the Fast Track normative sample mean, as our demarcation of the presence or absence of risk. Outcomes were based on children's academic and social–emotional functioning and were assessed at the end of Grade 5. For some of our outcomes, we included continuously distributed measures of functioning as well as dichotomous indicators of problems. Information on the many measures included in this study is summarized in Table 1. Additional information on any measure included in this study is available at www.fasttrackproject.org.
Kindergarten risk factors by ecological level

Note: WJ, Woodcock–Johnson; TRF, Teacher Report Form; CBCL, Child Behavior Checklist; IPE, Inventory of Parent Experiences; ADHD, attention-deficit/hyperactivity disorder; CES-D, Center for Epidemiological Studies Depression Scale.
aOverall prevalence of history of problems was 35% among mothers and 48% among fathers.
bVariables standardized within locality–race group.
Child risk
Three risk factors were created at the child level. The child cognitive risk factor represented those aspects of functioning most likely to interfere with children's academic success (Duncan et al., Reference Duncan, Dowsett, Claessens, Magnuson, Huston and Klebanov2007; Freberg, Vandiver, Watkins, & Canivez, Reference Freberg, Vandiver, Watkins and Canivez2008; McCall, Reference McCall1977) and was based on children's intellectual ability, early reading skills, and attention problems. Intellectual ability was assessed with the block design and vocabulary subtests of the Wechsler Intelligence Scale for Children—Third Edition (Wechsler, Reference Wechsler1991). Age-normed standard scores on these subtests were used to estimate total IQ (Satler, Reference Satler1992). Early reading skills were assessed with the letter–word identification subtest from the Woodcock–Johnson Psycho-Educational Battery—Revised (Woodcock & Johnson, Reference Woodcock and Johnson1989). The letter–word identification subtest (standard score mean = 100, SD = 15) assesses early literacy skills, such as knowledge of letters and the ability to read short words. Attention problems were assessed with the TRF attention problems syndrome (Achenbach, Reference Achenbach1991b); teachers were asked to rate 20 items, such as “Can't concentrate, can't pay attention for long,” on a 3-point Likert scale (0 = not true to 2 = very true or often true; α = 0.94). All pairwise associations among intellectual ability, early reading skills, and attention problems were significant (p < .0001 for all pairs). Children received a score of one (signifying risk) for the overall child cognitive risk factor if they received an estimated IQ score below 80, were 1 SD below the national mean on the letter–word identification subtest, or received a T score in the clinical range (≥70) on the TRF attention problems syndrome.
The child social–cognitive risk factor represented aspects of emotional intelligence (Mayer, Salovey, & Caruso, 2008) and social information processing (Dodge, Reference Dodge and Perlmutter1986) that predict social competence and the absence of behavior problems; it was based on children's emotion understanding, hostile attributions, and social problem solving skills. Emotion understanding was assessed with the Emotion Recognition Questionnaire (Ribordy, Camras, Stafani, & Spaccarelli, Reference Ribordy, Camras, Stafani and Spaccarelli1988), in which children were asked to correctly identify how a child would feel (happy, sad, mad, or scared) in each of 16 vignettes (α = 0.66). Hostile attributions were assessed in the Home Interview With Child (based on Dodge, Reference Dodge1980). After looking at each of eight drawings depicting a failed attempt at peer entry or minor harm under conditions of ambiguous intent (i.e., being bumped), children were asked to state why the undesired event might have occurred. Interviewers then rated each explanation as hostile or nonhostile (interrater reliability κ = 0.94; α = 0.76). Social problem solving skills were assessed using the Social Problem Solving Scale (based on Dodge et al., Reference Dodge, Bates and Pettit1990, and Rubin & Krasnor, Reference Rubin and Krasnor1986). Children were presented with drawings of eight challenging peer situations and asked to generate possible solutions. Interviewers then rated each solution as competent or not (interrater reliability κ = 0.91; α = 0.77). All pairwise associations among emotion understanding, hostile attributions, and social problem solving skills were significant (ps = .04–.0001). Children received a score of one (signifying risk) for the overall child social–cognitive risk factor if the number of feelings they identified correctly on the Emotion Recognition Questionnaire was 1 SD below the normative sample mean, if their percentage of hostile attributions on the Home Interview With Child was 1 SD above the normative sample mean, or if their percentage of competent solutions on the Social Problem Solving Scale was 1 SD below the normative sample mean.
The child behavioral risk factor was based on the externalizing scale of the Child Behavior Checklist (CBCL; Achenbach, Reference Achenbach1991a). Parents were asked to rate 33 items, such as “disobedient at home” and “gets in many fights,” on a 3-point Likert scale (0 = not true to 2 = very true or often true; α = 0.90). Children received a score of one (signifying risk) for the child behavioral risk factor if they received a nationally normed t score in the clinical range (64 or above).
Family risk
Six risk factors were created within the family level. Children received a score of one for the single-parent risk factor if their primary caregiver was unmarried or had not been living with a partner for more than a year. Children received a score of one for the family demographic risk factor if their families did not include a parent with a high school degree or a job requiring specialized skills. Having no high school degree and having a low-skilled job were significantly related (p < .0001).
Because of the relation between stress, social support, and children's adjustment (Crnic & Greenberg, Reference Crnic and Greenberg1990, Pianta & Ball, Reference Pianta and Ball1993), we created a stress/support risk factor, based on the number of stressful life events parents experienced and the amount of social support they received. In the Life Changes interview (developed for Fast Track), parents were asked whether each of 16 different events, such as a serious illness or the loss of a job, had occurred within the last year and how stressful each of those events had been (0 = did not occur, 1 = minor stress, 2 = major stress). In the Inventory of Parent Experiences (Crnic & Greenberg, Reference Crnic and Greenberg1990), parents were asked six questions about how satisfied (0 = very dissatisfied to 3 = very satisfied) they had been with the amount of instrumental and emotional support they received from family members and friends (α = 0.74). The association between stressful life events and social support was significant (p < .01). Children received a score of one on the stress/support risk factor if the frequency and severity of stressful life events was 1 SD above the normative sample mean or if the amount of social support their primary caregiver received was 1 SD below the normative sample mean.
The parent history of problems factor assessed characteristics of parents that might confer genetic and/or environmental risks for children (Jaffee, Moffitt, Caspi, & Taylor, Reference Jaffee, Moffitt, Caspi and Taylor2003; Sonuga-Burke, Daley, & Thompson, Reference Sonuga-Burke, Daley and Thompson2002). Children received a score of one on this risk factor if either of the child's biological parents had ever been arrested, had ever had alcohol or drug problems, had ever been diagnosed with attention problems, or was placed in special education classes as a child. All pairwise associations among parents' history of arrests, alcohol/drug problems, and attention problems were significant (p < .0001 for all pairs).
The maternal depression risk factor sought to quantify some of the biological and social challenges children face when their mothers are impaired (Goodman, Reference Goodman2007). It was assessed with the Center for Epidemiological Studies Depression Scale (Radloff, Reference Radloff1977). Children received a score of one on this risk factor if their mothers' responses to 20 questions about the frequency of symptoms associated with depression (0 = rarely to 3 = almost all the time) were in the measure's established clinical range (≥16; α = 0.88).
The marital risk factor reflected problems in the parents' relationship. Children received a score of one for this risk factor if their parents reported any physical violence during the prior year on a revised version of the Conflict Tactics Scales (Straus, Reference Straus1979). Based on research suggesting that many forms of marital conflict, not just physical aggression, can affect children's adjustment (Grych & Fincham, Reference Grych and Fincham1990), children also received a score of one on this risk factor if their parents reported so much conflict and so few positive interactions on the 28 items of the Dyadic Adjustment Scale (Spanier, Reference Spanier1976) that their scores fell into the measure's established clinical range (≥88; α = 0.93). Because they could not be exposed to marital conflict, children from single-parent families received a score of zero for this risk factor.
Parenting risk
Our parenting risk factor included the most important domains of the caregiving relationship identified over several decades of empirical research (Baumrind, Reference Baumrind1966; Maccoby & Martin, Reference Maccoby, Martin, Mussen and Hetherington1983; Steinberg, Mounts, Lamborn, & Dornbusch, Reference Steinberg, Mounts, Lamborn and Dornbusch1991) and the focus of most parent management training (McMahon & Forehand, Reference McMahon and Forehand2003; Webster-Stratton, Reference Webster-Stratton1992). Parent–child warmth was based on a 20-min semistructured play session. While observing this play session, child interviewers used six items from the Interaction Ratings Scales (Crnic & Greenberg, Reference Crnic and Greenberg1990) to assess how sensitive and responsive parents were to their child (interrater intraclass correlation coefficient = .73; α = 0.87). Parental consistency was based on a revised version of the Parenting Practices Scale (Strayhorn & Weidman, Reference Strayhorn and Weidman1988). As part of this measure, parents were asked seven questions such as “How often is your child able to get out of a punishment when she or he really sets her or his mind to it?” (0 = never to 4 = all the time; α = 0.70). Extremely harsh discipline and potential child maltreatment was based on an interviewer rating (Dodge et al., Reference Dodge, Bates and Pettit1990). After asking numerous questions about the child's life and how parents had addressed various child-rearing challenges, interviewers rated the likelihood that the child had been severely harmed (1 = extremely unlikely, 3 = suspected/possible, 5 = authorities involved) in the time before kindergarten or during kindergarten. Children received a score of 1 on the parenting risk factor if observed parent–child warmth was 1 SD below the normative sample mean, if parental consistency was 1 SD below the normative sample mean, or if interviewers rated the likelihood of extremely harsh discipline and child maltreatment as “suspected/possible” or higher. Although warmth and maltreatment were not significantly related (p = .17), low consistency was significantly related to warmth (p = .01) and maltreatment (p = .01).
Community risk
Three risk factors were included within the community level: neighborhood, school, and classroom risk. Analyses were initially conducted with these risk factors standardized within the entire sample, just as all of the other risk factors were. Although reasonable, that decision meant that almost all urban African American children experienced the community risk factors, and virtually no rural White children experienced them. This provided little information about the relation of community risk and Grade 5 outcomes within each locality–race group, and we did not want neighborhood, classroom, and school factors to function as simple proxies for locality and race. That decision also neglected to account for the relative risk within children's more immediate reference group: children might be more attuned to and affected by the way in which their circumstances compare to those of children like themselves whom they are most likely to encounter on a daily basis. Thus, we determined that it would be most meaningful for the three community-level risk factors to be standardized within the three locality–race groupings. For each of these factors, individuals were coded as being at risk relative to others within their locality–race group.
A neighborhood risk factor was created because poor and disorganized communities can affect child outcomes, even after controlling for characteristics of the children and families living within them (Leventhal & Brooks-Gunn, Reference Leventhal and Brooks-Gunn2000); this risk factor was based on information from the United States Census Bureau, parent ratings, and interviewer ratings. A measure of concentrated disadvantage (Sampson, Raudenbush, & Earls, Reference Sampson, Raudenbush and Earls1997) reflected five characteristics of the Census tract, such as the percentage of families living in poverty and the percentage of families who do not own their homes (α = 0.89). A measure of safety was based on parent ratings of five items from the Neighborhood Questionnaire (developed for Fast Track), such as “How often are there problems with muggings, burglaries, assaults, or anything else like that around here?” (α = 0.80). A measure of neighborhood quality was based on interviewers' reports of four factors such as noise level (interrater reliability = 0.70; α = 0.72). Children received a score of 1 on the neighborhood risk factor if their mean standardized score on those three measures was 1 SD below the normative sample mean within the child's locality–race group.
A classroom risk factor was included because of the long-term impact of early school experiences on children's development (Kellam, Ling, Merisca, Brown, & Ialongo, Reference Kellam, Ling, Merisca, Brown and Ialongo1998; Bierman, Thomas, & CPPRG, 2006). For this risk factor, teachers rated 10 items regarding the aggressive and oppositional behavior of every child in their classroom (Werthamer-Larsson et. al, 1991), and observers rated 10 characteristics of the classroom atmosphere, such as the quality of teaching practices (interrater reliability κ = 0.62–0.81; α = 0.92). These two aspects of classroom risk were significantly related (p = .03). Children received a score of one on the classroom risk factor if the average level of aggressive and oppositional behavior of their classmates was 1 SD above the normative sample mean in their locality–race group or if the quality of the classroom atmosphere was 1 SD below the mean in their locality–race group. Finally, because attending schools serving low-SES students adversely affects academic performance even controlling for individual student and institutional characteristics (Palardy, Reference Palardy2008), we created a school risk factor, based on public records indicating the percentage of students who received free or reduced-price meals. Children received a score of one on this risk factor if they attended a school in which that percentage was more than 1 SD above the normative sample mean in their locality–race group.
Grade 5 outcomes
Two Grade 5 outcomes measured behavior problems in late childhood. Externalizing problems at home were assessed with the 33 items of the externalizing scale of the parent-reported CBCL (Achenbach, Reference Achenbach1991a; α = 0.92). Externalizing problems at school were assessed with the 34 items of the externalizing scale of the TRF (Achenbach, Reference Achenbach1991b; α = 0.97). For these two outcomes, we retained the raw scores for analysis, and we created dichotomous variables, on which children received a score of 1 if their parents' or teachers' ratings placed them in the nationally normed clinical range (≥64).
The final two Grade 5 outcomes assessed failing grades and academic achievement. To assess failing grades, research staff members reviewed children's Grade 5 school records. Children received a score of 1 if they were making Ds or Fs in any academic subject (e.g., math, language arts, science, or social studies). Academic achievement was based on the average standard scores of the calculation, passage comprehension, and letter–word identification subtests of the Woodcock–Johnson Psycho-Educational Battery—Revised (Woodcock & Johnson, Reference Woodcock and Johnson1989). In addition to the continuous version of this scale, a categorical versions was created, on which children received a score of 1 if their average standard score was 1 SD below the normative sample mean.
Analysis
Logistic regression models for examining the effects of the cumulative risk index on Grade 5 outcomes were estimated using SAS PROC LOGISTIC. Latent class models were estimated using SAS PROC LCA (Lanza et al., Reference Lanza, Collins, Lemmon and Schafer2007).Footnote 1 Maximum-likelihood parameter estimates were obtained using an EM-type procedure. Missing data on the latent class indicators are accounted for using a full-information maximum-likelihood procedure, and are assumed to be missing at random. This means that missingness can be accounted for by the set of variables included in the LCA model. Although this assumption cannot be tested empirically, it is reasonable in the current study given the broad range of risk indicators included in the model. The software to conduct LCA is available for download free of charge at http://methodology.psu.edu. Details on PROC LCA can be found in the user's guide (Lanza, Lemmon, Schafer, & Collins, Reference Lanza, Lemmon, Schafer and Collins2008).
Results
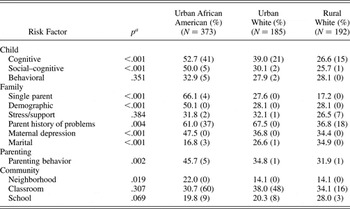
Descriptive statistics
Table 2 shows the percent of children who were classified as at risk on each risk factor within each locality–race group. There were statistically significant locality–race differences in the prevalence of all risk factors except for child behavioral risk, stress/support risk, classroom risk, and school risk. The proportion of children exposed to single-parent risk shows the largest group differences, with 66.1% for urban African American children, 27.6% for urban White children, and 17.2% for rural White children. Urban African American children had the highest rates of exposure to most risk factors and rural White children usually had the lowest risk. The one exception was marital risk. Because rural White families were most likely to include two parents, they were most likely to experience domestic violence or high levels of conflict. These proportions suggest that there will be large locality–race differences in the prevalence of different risk profiles.
Descriptive statistics: Proportion of each locality–race group at risk in kindergarten

Note: The values in parentheses are the total number missing.
aChi-square test of group differences in proportion reporting risk factor.
For each locality–race group, the proportion of children exhibiting each negative outcome at Grade 5 appears in Table 3. Just as there were group differences in the prevalence of risk factors, there were statistically significant locality–race differences in the proportion of children who displayed each negative outcome, with the exception of parent report of externalizing problems. White children, in particular those living in rural areas, were less likely to have clinically significant externalizing behavior problems, to be failing a class in school, and to have low academic achievement.
Descriptive statistics: Grade 5 outcomes by locality–race group

Note: The values in parentheses are the total number missing.
aChi-square test of group differences in proportion reporting adverse outcome.
Significant univariate relations between each of the 13 risk factors and the dichotomous indicators of adverse outcomes are marked in Table 4. For each locality–race group, p values are based on chi-square tests of differences in the proportion of individuals with the adverse Grade 5 outcome for children who were or were not exposed to the corresponding risk factor. All effects were in the expected direction, with a higher rate of the adverse outcome among individuals exposed to the risk factor. As expected, the early child cognitive risk factor is strongly predictive of poor academic outcomes and the early child behavioral risk factor is strongly predictive of adverse behavioral outcomes for all locality–race groups. Risk factors in the child and family domains have widespread relations to Grade 5 outcomes. Risk factors in the parenting, neighborhood, classroom, and school domains were less consistently related to the Grade 5 outcomes across locality–race groups.
Relations between individual risk factors and outcomes for each locality–race group

Note: AA, African American; WT, White.
†p < .10. *p < .05. **p < .01. ***p < .001.
Cumulative risk index
A cumulative risk index ranging from 0 to 13 was created by summing the number of risk factors each child displayed or experienced.Footnote 2 The mean index among urban African Americans (M = 5.1, SD = 2.4) was significantly higher than that among urban Whites (M = 4.0, SD = 2.5; p < .0001) or rural Whites (M = 3.6, SD = 2.4; p <.0001), although the mean index did not differ between the two White groups.
As expected, the risk index was a significant predictor of all four dichotomous outcomes. Each additional risk factor was associated with significantly higher odds of all Grade 5 outcomes: CBCL externalizing problems (odds ratio [OR] = 1.3, p < .0001), TRF externalizing problems (OR = 1.3, p < .0001), failing grades (OR = 1.3, p < .0001), and low academic achievement (OR = 1.4, p < .0001). In other words, with each additional risk factor a child was exposed to, she or he was 1.3 to 1.4 times more likely to exhibit the problematic outcome. None of these effects varied significantly across locality–race groups.
To examine possible nonlinear associations between the cumulative risk index and the log-odds of Grade 5 outcomes, the cumulative risk index score for each child was squared and included in the logistic regression equations. This term was not significant for TRF externalizing problems, failing grades, and low academic achievement, although for CBCL externalizing problems the term was significant (p = .02), with a smaller positive effect corresponding to a higher number of risk factors.
LCA
Modeling risk profiles
With 13 dichotomous risk factors, there would be 213 or 8,192 possible combinations of those risk factors. If we were to classify children based on their observed risk profiles, it would be difficult to make any meaningful conclusions about them. Thus, LCA was used to identify a set of risk profiles that can represent sufficient heterogeneity in risk among the 750 children, and still be a parsimonious description of multiple risks. Indices like the Akaike information criterion (AIC) and Bayesian information criterion (BIC) are useful tools for selecting the number of latent classes that optimizes the balance between model fit and parsimony. We relied on these information criteria as well as substantive meaning of the parameters to determine the optimal number of risk profiles.
Preliminary analyses were conducted within locality–race groups to gain a clear understanding of the constellations of risk factors within the different ecological contexts. However, because a primary goal was to make direct comparisons of the prevalence of the risk profiles across locality–race groups, we ultimately chose to model all children together and include a grouping variable indicating children's locality and race.
Models with one through six latent classes were compared, although the six-class model could not be identified sufficiently well. Results were as follows (note that for both the AIC and BIC, lower values are preferable): for one latent class BIC = 4,151.4 and AIC = 4,091.4; for two latent classes BIC = 3,661.2 and AIC = 3,527.2; for three latent classes BIC = 3,526.8 and AIC = 3,318.9; for four latent classes BIC = 3,546.3 and AIC = 3,264.5; for five latent classes BIC = 3,602.2 and AIC = 3,246.4. These results suggest that a model with three to five classes should be considered further. Based on a careful interpretation of the latent classes (including interpretability of the solution, clean structure in the measurement model, and correspondence of the resultant latent classes with those identified in preliminary group-specific analyses) and because the five-class model was not well identified, we selected the four-class model.
Measurement of the four latent classes was constrained to be equal across the locality–race groups for several reasons. First, the BIC strongly favored the model with measurement invariance (and the AIC was nearly equal). Second, we wanted to be able to interpret the risk profiles in the same way across groups. Third, the four-class model with no constraints on the measurement model was highly unstable because of the large number of parameters being estimated.
In a latent class model, two sets of parameters are estimated. Latent class membership probabilities describe the underlying distribution of the latent class variable; in this study, these quantities reflect the prevalence of each risk profile. Item–response probabilities express the correspondence between each observed item and each latent class (i.e., these are the measurement parameters); in this study, this is the relation between each of the 13 risk factors and each risk profile. The top panel of Table 5 shows the item–response probabilities for the final model with four risk profiles. Each column represents the probability of individuals in a particular latent class reporting each risk factor. Higher probabilities signify defining characteristics of risk profile membership. Latent classes were given descriptive labels based on the risk factors that had high item–response probabilities for that class.
Item–response probabilities for four-class model (probability of reporting risk factor given latent class) and class membership probabilities for each locality–race group

Note: AA, African American; WT, White.
aRow sums to 100%.
The two-parent low-risk latent class comprised individuals with a low probability of reporting any risk factor. A single-parent/history of problems latent class was characterized by a high probability of being in a single-parent household and by a high probability of having a biological parent with a history of problems such as arrests, substance use, or learning difficulties. Note that children with this risk profile also had a somewhat higher probability of reporting child cognitive or social–cognitive risk and demographic risk than children in the two-parent low-risk class. A single-parent multilevel risk class was characterized by children in a single-parent household with a high probability of child cognitive risk, child social–cognitive risk, family demographic risk, parental history of problems, maternal depression, and parenting risk. Finally, the two-parent multilevel risk profile consisted of children who were very likely to live in a two-parent household. Like children in the single-parent multilevel risk class, these children were exposed to a host of risk factors at many ecological levels, including child cognitive risk, family demographic risk, parental history of problems, maternal depression, marital risk, and parenting risk.Footnote 3
Locality–race differences in the prevalence of risk profiles
In multiple-groups LCA, both the class membership probabilities and item–response probabilities can be conditioned on group membership. When the same measurement model is imposed across groups (i.e., all item–response probabilities are constrained to be equal across groups), an examination of group differences in the prevalence of the different latent classes is meaningful. In the current study, applying the same measurement model across locality–race groups allowed for a comparison of the proportion of children with each risk profile, with risk profiles having the same meaning across groups.
The bottom panel of Table 5 shows the prevalence of each risk profile within each locality–race group. Group differences are apparent for all risk profiles. Most notably, urban African American children were least likely to belong to the two-parent low-risk class (11% vs. 38% for urban White and 55% for rural White) and more likely to have a single-parent multilevel risk profile (38% vs. 5% urban White and 4% rural White). Children in urban environments were more likely to have a single-parent/history of problems profile (33% urban African American and 25% urban White vs. 11% rural White). White children were more likely to have a two-parent multilevel risk profile (32% urban White and 30% rural White vs. 18% urban African American).
Relation between risk profiles and dichotomous Grade 5 outcomes
After identifying the four risk profiles, we examined how membership in the profiles was related to the Grade 5 outcomes. In the current study, we did this by including the measures of the Grade 5 outcomes in the LCA models. Although technically “covariates” in the statistical models, we will refer to them as outcomes because they were assessed 6 years after the risk factors. Such variables can be incorporated in a latent class model as predictors of latent class membership. A multinomial logistic regression model is used to predict latent class membership probabilities from these variables (Bandeen-Roche, Miglioretti, Zeger, & Rathouz, Reference Bandeen-Roche, Miglioretti, Zeger and Rathouz1997; Chung, Flaherty, & Schafer, Reference Chung, Flaherty and Schafer2006; Dayton & Macready, Reference Dayton and Macready1988). This approach allowed us to describe the associations between risk profile membership and the outcomes of interest while taking into account classification uncertainty in latent class membership. In addition, this model allowed us to include locality–race as a moderator of these associations. A set of logistic regression coefficients, which can be transformed into odds ratios, expresses the relation between each covariate and latent class membership.Footnote 4 In the case of categorical covariates, Bayes theorem can be used to reverse the direction of the interpretation of effects.Footnote 5 By doing this, we can report the proportion of children in each locality–race group expected to experience each (categorical) adverse outcome given risk profile membership in kindergarten, taking into account classification uncertainty. More details about LCA with covariates appear in Lanza et al. (Reference Lanza, Collins, Lemmon and Schafer2007).
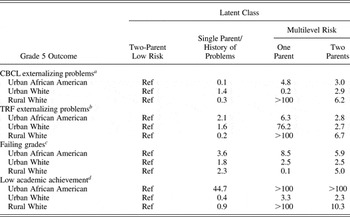
Table 6 shows the odds ratios reflecting the relation between risk profile membership and outcomes at Grade 5 for each locality–race group. Specifically, the odds ratios reflect the change in odds of membership in a particular risk profile, relative to membership in the two-parent low-risk profile, for children who exhibit the negative outcome at Grade 5. An odds ratio of 1.0 indicates that children are no more likely to belong in a particular risk profile, relative to the two-parent low-risk profile, given that they exhibit a poor outcome at Grade 5. Odds ratios of greater than 1.0 suggest that children with a poor outcome are more likely to have been in a particular risk profile, relative to the two-parent low-risk profile. For example, among those children displaying clinically significant externalizing problems in Grade 5 according to their parents, the odds of membership in the two-parent multilevel risk profile, relative to the two-parent low-risk profile, were between 2.9 and 6.2 times higher (top-right entries in Table 6) depending on locality–race group. Conversely, odds ratios of less than 1.0 suggest that children with a poor outcome are less likely to have been in a particular risk profile relative to the two-parent low-risk profile. The p values in this table are based on a log-likelihood difference test with 9 degrees of freedom, indicating the significance of the overall relation between class membership and the outcome. Note that the inclusion of covariates did not result in any substantial changes to the structure of the latent classes, indicating that our models did not violate the important underlying assumption of marginal homogeneity.Footnote 6
Odds ratios for Grade 5 outcomes by locality–race group

Note: Ref indicates the reference class in the logistic regression model, and p values represent the overall relation between risk profile membership and Grade 5 outcome based on a log-likelihood difference test. For the White groups, the odds ratios corresponding to membership in the single-parent multilevel risk latent class are based on a very small expected number of children.
aN = 644, p < .001.
bN = 622, p < .001.
cN = 639, p < .001.
dN = 630, p < .001.
It is not surprising that the findings from these analyses revealed that children who were having problems in Grade 5 were much more likely to have had a single-parent/history of problems, single-parent multilevel risk, or two-parent multilevel risk profile than a two-parent low-risk profile in kindergarten. The relations between risk profile membership and all outcomes were statistically significant (p < .001 for all outcomes).
Relative to the two-parent low-risk profile, membership in the single-parent/history of problems profile conferred substantial risk. For example, among the children receiving failing grades at the end of elementary school, the odds of membership in the single-parent/history of problems profile relative to the two-parent low-risk profile in kindergarten were 3.6 (urban African American), 1.8 (urban White) or 2.3 (rural White) times higher. Overall, poor outcomes tended to be more strongly associated with an increased likelihood of membership in the two-parent multilevel risk profile, which is characterized by exposure to risk factors in numerous ecological levels, and they were most strongly associated with an increased likelihood of membership in the single-parent multilevel risk profile. For many of the negative outcomes, the magnitude of the effect is quite striking.Footnote 7
Although the relation between risk profile membership and Grade 5 outcomes is fairly consistent across locality–race groups, one effect stands out among all others: Urban African American children who scored 1 SD below the normative mean on the tests of academic achievement were between 44.7 and 181.0 times more likely to belong in any of the three higher risk profiles relative to the two-parent low-risk profile. Such large odds ratios suggest that virtually none of the 29.4% of urban African American children with low academic achievement in Grade 5 (see Table 3) were likely to have had a two-parent low-risk profile in kindergarten.
Many effects are stronger in the rural White group than the urban White group. For example, rural White children with scores in the clinical range on parent- and teacher-reported externalizing problems at Grade 5 were 6.2 and 6.7 times more likely to have been in the two-parent multilevel risk profile, respectively, than to have been in the two-parent low-risk profile in kindergarten. In contrast, the increased risk was only 2.9 and 2.7, respectively, among urban White children.
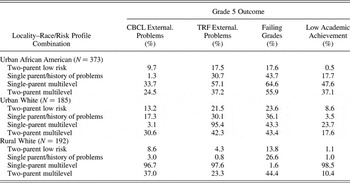
As shown in Table 7, results based on reversing the direction of the effects better quantify the differential risk associated with early-childhood profiles. For low academic achievement, it is the higher order interactions of risk factors (i.e., membership in the single-parent multilevel risk group or two-parent multilevel risk group) that confer the greatest risk. For this outcome, less than 20% of children with two-parent low risk and single parent/history of problems profiles are expected to have adverse outcomes regardless of locality–race group, compared to as much as 98.5% of children in the multilevel risk groups. For failing grades, however, a single parent/history of problems risk profile also confers high risk among children in urban settings. One interesting finding in the two urban groups is that teachers are more likely than parents to report externalizing problems regardless of risk profile membership.
Percentage of individuals in each locality–race/risk profile combination expected to report each adverse outcome in Grade 5

Relation between risk profiles and continuous Grade 5 outcomes
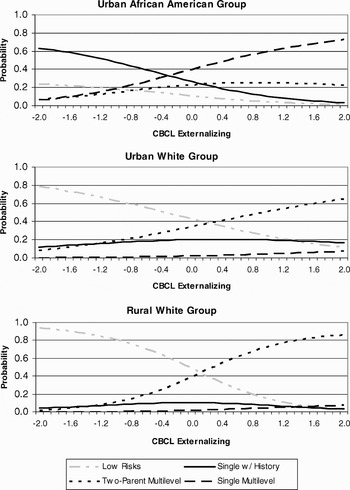
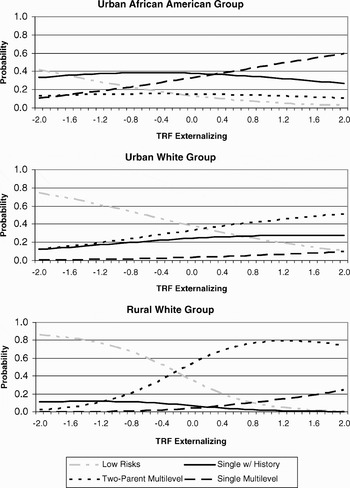
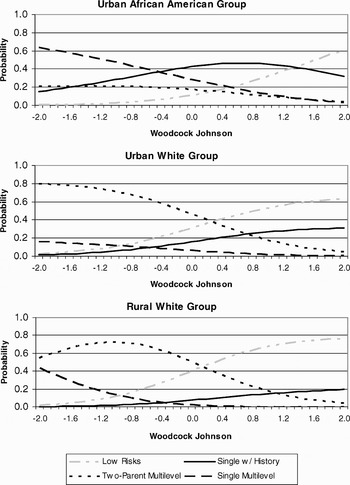
The logistic regression coefficients from the LCA models with continuous outcomes can be used to plot the prevalence of membership in each risk profile across the range of values on the outcome (see Figures 1–3). For example, the top panel of Figure 1 shows the prevalence of risk profile membership among urban African American children corresponding to values from 2 SD below the mean to 2 SD above the mean on parent reports of externalizing behavior. The slope of the lines corresponds to the strength of the relation between externalizing behavior problems and membership in the risk profiles for this locality–race group.
The prevalence of risk profiles across levels of parent-reported externalizing behavior. For any given level on Child Behavior Checklist externalizing, the class membership probabilities sum to 1.0.

The prevalence of risk profiles across levels of teacher-reported externalizing behavior. For any given level on Teacher Report Form externalizing, the class membership probabilities sum to 1.0.

The prevalence of risk profiles across levels of academic achievement. For any given level on intellectual achievement, the class membership probabilities sum to 1.0.

These plots reveal risk profiles that are most prevalent among children who exhibit worse outcomes at Grade 5. For urban African American children, membership in the single-parent multilevel risk group corresponds strongly to high levels of externalizing behavior problems (particularly when reported by parents) in Grade 5 and low academic achievement. The prevalence of both the two-parent low risk and the single-parent/history of problems risk profiles increase substantially with better outcomes, suggesting that both environments may be protective for African American children in urban environments. Both urban and rural white children with very low scores on externalizing behavior at Grade 5 almost exclusively had a two-parent low-risk profile in kindergarten. Children with very high scores on externalizing behavior most likely had a two-parent multilevel risk profile. These effects were stronger among rural White children than urban White children. Membership in the single-parent multilevel risk profile was not related to parent-reported externalizing behavior for White children. Also for both urban and rural White children, membership in the two-parent low risk or the single-parent/history of problems profiles was related to higher academic achievement, whereas membership in both multilevel risk profiles was related to lower academic achievement. These effects were again stronger among rural children, which is interesting.
Discussion
This study demonstrated the utility of a person-centered approach to modeling multilevel risk factors in a diverse population of high-risk children and families. LCA maps well onto a holistic/ecological framework for childhood development. Thirteen risk factors from six ecological levels (child, family, parenting, classroom, school, and neighborhood) were modeled. Out of the thousands of possible constellations of risk factors, however, a set of four risk profiles provided a concise and interpretable description of risk exposure during kindergarten at multiple ecological levels. Developmental and clinical researchers are often overwhelmed by the sheer number and combination of risk factors present in community-based samples. This study demonstrates that a person-centered approach can provide an insightful and parsimonious depiction of the interplay between many risk factors.
Results from a cumulative risk index and LCA
A more traditional approach to modeling multiple risks, the cumulative risk index, demonstrated that urban African American children were, on average, exposed to more risk factors than urban White or rural White children. On average, urban African American children were exposed to approximately 5 of the 13 risk factors considered in this study. For all children, exposure to each additional risk factor corresponded to a 20% to 40% increase in odds of a poor Grade 5 outcome. This type of analysis confirms many previous findings that more risk factors are associated with less adaptive outcomes (e.g., Appleyard et al., Reference Appleyard, Egeland, van Dulmen, Manfred and Stroufe2005; Luthar, Reference Luthar1993; Sameroff, Seifer, Baldwin, & Baldwin, Reference Sameroff, Seifer, Baldwin and Baldwin1993). Although interesting, these findings provide little information regarding how we should design future preventive interventioins and whom we should target. These findings simply imply that the most effective intervention approach would be to try to reduce the number of risk factors for all children, regardless of their level of risk exposure or, importantly, which risk factors are present in their lives.
In contrast, LCA provided a somewhat more nuanced description of the intersection of risk in these populations, both in terms of the amount of risk exposure in each risk profile subgroup and in terms of which risk factors dominated the profiles. As hypothesized, the risk profiles that emerged in the present analyses illustrated the diversity of experiences within one- and two-parent families (Foster & Kalil, Reference Foster and Kalil2007). One two-parent class with no risks (i.e., two-parent low risk) and one two-parent class with multiple risks (i.e., two-parent multilevel risk) emerged. Similarly, one single-parent class with only one other risk (i.e., single-parent/history of problems) and one single-parent class with multiple risks (i.e., single-parent multilevel) emerged. The characteristics of these risk profiles, along with their differential expected rates of poor outcomes, provide information on which future intervention programs can be based.
Embedded within the four risk profiles are two important features. First, the profiles characterize subgroups of children that exist in the sample. Although the true latent class membership of a particular child is unknown, key features of an individual child's exposure to the 13 risk factors suggest his or her most likely risk profile. In LCA, each individual's posterior probability of latent class membership can be obtained. Rather than identifying each individual's likely class membership, however, these latent class models are more useful in summarizing key combinations of risk that children are exposed to, and determining which of those combinations or risk profiles are most strongly predictive of specific negative outcomes.
Second, an important feature of these four risk profiles is the implicit higher order interactions by which they are characterized. Although the latent class model does not include interaction terms as they are typically conceptualized in a regression framework, an examination of Table 5 provides an immediate picture of which of the 13 risk factors tend to coexist within each risk profile. For example, the single-parent multilevel risk profile encompasses the intersection of risk factors both within and across several ecological levels. Although a multiple regression approach could be used to target specific risk factors that are most strongly predictive of a poor outcome, even two- or three-way interaction terms are often difficult to model (Aiken & West, Reference Aiken and West1991). Because of this, the differential effect of one particular risk factor often cannot be ascertained for children who differ in their exposure to other risks either within or across ecological levels.
A practical example of these features of the LCA model is found in the single-parent/history of problems group. Although single parenthood, especially in urban, high-risk neighborhoods, has been shown to predict poor outcomes for youth (e.g., McLanahan & Sandefur, Reference McLanahan and Sandefur1994), this LCA-derived group, which accounted for about one-third of White and African American youth, showed very low rates of behavior problem outcomes. One could characterize this family configuration as providing reasonably strong protective effects compared to other risk profiles. That is, urban children in single-parent homes that have few other risk factors (i.e., show at least average parenting warmth and consistency and report relatively low stress and high social support) are at quite low risk for externalizing problems. As a result, given an effective screening process, this family/child configuration might not be targeted for preventive interventions directed at this outcome, which might save needed resources that could be allocated to children and families at greater risk. In contrast to low behavioral risk, this group is still at relatively high risk for poor grades and academic achievement. Thus, although in low need of interventions focused on parent management and externalizing problems, such children and families may need more support for academic outcomes, like tutoring and afterschool homework support.
Group differences in risk
Many of the group differences in prevalence of the risk profiles were driven by the fact that single-parent households were much more common among urban African American families. This important difference required the inclusion of both the single-parent multilevel risk and the two-parent multilevel risk profiles, even though the former was rare among both urban and rural White children.
Careful consideration was given to the coding of risk exposure within the neighborhood, classroom, and school levels. To assure that neighborhood, classroom, and school factors did not function as proxies for locality and race and to account for the relative risk within children's most salient reference group, these three risk factors were standardized within each locality–race group. Because of this, any conclusions made about community risks must be interpreted in terms of risk levels within this more circumscribed context. This approach may be necessary in communities that show high rates of ethnic segregation. This approach also might need to be expanded to include other locality–race groups, such as rural Latino or urban Asian American, in studies that include substantial numbers of these potential subgroups (Coll & Garrido, Reference Coll, Garrido, Sameroff, Lewis and Miller2000; Quintana et al., Reference Quitana, Aboud, Chao, Contreras-Grau, Cross and Hudley2006).
Risk profiles and developmental outcomes
As expected, all five negative outcomes in Grade 5 were significantly related to risk profile membership in kindergarten. These findings extend our knowledge, however, by highlighting the importance of specific multilevel ecological configurations of risk for maladaptive outcomes in school-age children. The profiles characterized by several risks that cut across multiple domains (single-parent and two-parent multilevel risk profiles) conferred the highest risk for negative outcomes. This also confirms our hypothesis that profiles characterized by lower levels of child-level risk, particularly in a context of risk (i.e., single-parent status), would fare relatively better than profiles with higher levels of child-level risk.
It is interesting that the effects of different risk profiles on negative outcomes appear to be stronger for urban African American children than urban White children and stronger for rural White children than urban White children. In both cases, this might be because of the relative distributions of risk profiles and negative outcomes. Urban African American children were least likely to have a two-parent low-risk profile in kindergarten and were most likely to display a negative outcome in Grade 5. In contrast, rural White children were most likely to have a two-parent low-risk profile in kindergarten and least likely to display a negative outcome in Grade 5. When so many of our urban African American children come from challenging circumstances and fare poorly, the ones who come from relatively benign circumstances and fare well might stand out. Likewise, when so many of our rural White children come from relatively benign circumstances and fare relatively well, the ones who come from challenging circumstances and fare poorly might stand out.
The relations between the four higher risk profiles in kindergarten and low academic achievement in Grade 5 were exceptionally strong for urban African American and rural White children. Low academic achievement was nonexistent among two-parent low-risk children in the urban African American group. This suggests that a low-risk developmental context might be especially protective for later academic success within this group.
Because of the ongoing debate between the dimensional or categorical nature of adverse outcomes in research on psychopathology (e.g., Beauchaine, Reference Beauchaine2003; Pickles & Angold, Reference Pickles and Angold2003), we examined externalizing problems and academic achievement as continuous variables based on their original metric as well as categorical variables. One finding that emerged when examining the full dimensional values of externalizing behavior is that risk profile membership is more strongly related to parent-reported than teacher-reported externalizing behavior. This finding may reflect the fact that parents are embedded in the same ecological environments as the children and, therefore, have different standards about what kinds of behaviors are typical or normative.
Exposure to risk can change over time, so an important future direction will be to build on LCA models like the one described here to accommodate measures of risk longitudinally (e.g., latent transition analysis; Lanza & Collins, Reference Lanza and Collins2008). Such models would be useful to establish whether earlier, more distal risk factors or recent, more proximal risk factors have stronger associations with externalizing behavior, school failure, and academic achievement. They may also help us elucidate whether stability or instability in risk factors across time is more strongly associated with children's developmental outcomes.
Limitations
Although this study advances our understanding of how multiple risk factors interact to influence child development, certain limitations affect the conclusions that can be drawn from it. First, this study was exploratory. It sought to identify latent classes that existed within our sample. We did not know a priori what risk factors would describe each risk profile. When studies are exploratory, their findings might be more dependent on specific sample characteristics. The fact that most of our risk profiles emerged in all three of our locality–race groups when examined in group-specific analyses gives us increased confidence in the robustness of our findings; even so, replication of these results will be important.
Second, confidence intervals for individual odds ratios presented in Table 6 are not available in the current version (Version 1.1.5) of PROC LCA, thus we were only able to rely on overall hypothesis tests of significance in the relations between risk profiles and Grade 5 outcomes. Despite the lack of confidence intervals, however, when the overall test is statistically significant the odds ratios provide a sense of the direction of the effects.
Third, the associations between the various risk profiles in kindergarten and negative outcomes in Grade 5 are not necessarily causal. Our only goal was to identify early risk profiles that were associated with later problems.
Fourth, although many of the risk factors considered in this study were categorical by nature, we had to choose cut points for several risk factors. We found that the results were not especially sensitive to different cut points based on the distribution of the risk factor in the normative sample, and chose to use 1 SD from the mean to be consistent with previous studies that have used a similar approach. However, other researchers (e.g., Loeber et al., Reference Loeber, Pardini, Homish, Wei, Crawford and Farrington2005) have used techniques such as receiver operating characteristic curves that provide a statistically based justification for the selection of cut points for continuous variables.
Fifth, latent class models with many risk factors can become fairly complex. The addition of each binary risk factor expands the size of the contingency table of observed data exponentially, causing issues of sparseness common to all categorical methods. Such sparseness ultimately can result in estimation failure, particularly when relating latent class membership to other variables through logistic regression. To avoid that problem, we chose to implement a data-derived prior to stabilize our logistic regression models when necessary (Clogg, Rubin, Schenker, Schultz, & Weidman, Reference Clogg, Rubin, Schenker, Schultz and Weidman1991). Of interest, the sparseness issues we confronted were mainly because of the presence of incredibly strong associations between risk profile membership and Grade 5 outcomes, most notably for low academic achievement among urban African American children. Such strong effects could not be estimated without a statistical approach such as this.
Sixth, because we did not sample a representative population of children or neighborhoods (Fast Track oversampled children living in disadvantaged neighborhoods), the percentage of children in particular risk groups, the rate of problematic outcomes, and perhaps even the relation between risk and outcomes is not likely representative of all urban or rural children. An important next step will be to utilize this method of analyses with a nationally representative sample of children.
Prevention implications
A major research, clinical, and policy concern in prevention science is how to target funds effectively so that families that will benefit from services in a cost-effective manner are targeted. To the extent that we can more effectively predict which children are at greatest risk, it is likely that resources can be rationed more successfully.
The findings of this study draw attention to the intriguing possibility that screenings across multiple ecological levels might capture particularly worrisome constellations of risk factors. For example, although poverty is clearly a risk factor that is related to later problems, many poor children do not develop problems. Further, as discussed above in regard to the single-parent/history of problems group, children may show risk in one outcome area (grades) and not in another area (behavioral problems). We assume that, despite the presence of poverty, there are other features of their ecological configurations that protect some children from adverse outcomes.
This information could be used to inform decisions about where intervention resources should be focused within a particular community. This may be especially important when multilevel (e.g., universal and indicated) or multicomponent interventions are planned. The identification of latent classes can help to better identify persons who might benefit from different types or different dosages of treatment in adaptive designs (Collins, Murphy, & Bierman, Reference Collins, Murphy and Bierman2004). Although a variable-centered approach, such as a cumulative risk index, may demonstrate that a specific number of risk factors places children at substantial risk for a negative outcome, such an approach is not very helpful in considering how to target prevention and intervention efforts, either to particular children and families or to particular ecological levels.
Another issue raised by this kind of person-oriented analysis regards multifinality (Cicchetti & Rogosch, Reference Cicchetti and Rogosch1997). It may be that poor behavioral or academic outcomes associated with certain combinations of risk factors are best treated with one kind of intervention, whereas other sets of etiologic factors are best treated in other ways (Greenberg, Reference Greenberg, Cassidy and Shaver1999). By using person-centered LCA profiles, it may be possible to rationally pick subgroups, all of whom have elevated risk, but for whom different kinds or levels of preventive services may be differentially effective. Clearly, there is a need for careful empirical testing of preventive interventions that more closely match service delivery mechanisms to particular risk combinations in children and their families.
Conclusions
A person-centered approach to multiple risks allows for the identification of meaningful groups of children who share particular constellations of risk factors and differential developmental outcomes. LCA, the approach used in the current study, takes into account higher order interactions among risk factors that exist across multiple ecological levels. This holistic approach may serve prevention and treatment efforts by summarizing critical combinations of risk factors that children and families experience and are most strongly predictive of negative outcomes. In contrast to studies relying primarily on demographic and family history variables, using a multiecological approach demonstrated that families with different profiles varied dramatically in their child's outcomes 5 years later. Further, these outcomes also varied by locality and race. The understanding of multiple risks that is gained from a risk profiles approach could be used to modify future interventions by suggesting which treatment components should be paired together and by indicating where resources should be focused within a particular population.