


Introduction
The rat-race hybrid circuits are well-known and indispensable components in various microwave integrated circuit applications, especially in power dividers and combiners. Its circuit topology is a four-port network with a 0° or 180° phase difference between the two output ports, that allows the circuit to operate in either an in-phase or out-of-phase mode [Reference Collin1–Reference Chang3]. The traditional rat-race hybrid coupler is designed on a ring structure with a mean circumference of 3/2 wavelength, and the I/O ports mostly are in a tapping line form. Even-odd mode decomposition method is frequently used to analyze a symmetrical hybrid-ring's scattering matrix [Reference Reed and Wheeler4]. The 3-dB scattering parameters design is normally applied to circuits of an equally coupling case, but with carefully chosen impedances of composing sections, the hybrid ring coupler can comply with various coupling design [Reference Pon5, Reference Wilkinson6]. However, the process was somewhat complicated and the isolation and phase integrity were slightly affected due to circuit's asymmetric configuration and multiple junction discontinuities. A variety of reverse-phase lines of quarter-wavelength was applied to the hybrid-ring circuit for widening the bandwidth (BW) and/or reducing the circuit size [Reference Rehnmark7–Reference Ho12]. More efforts in size-reduction of rat-race coupler were achieved by different technologies [Reference Kuo, Wu and Chiou13–Reference Chung16]. They included the step-impedance line [Reference Kuo, Wu and Chiou13], artificial transmission line [Reference Tseng and Chen14], and technology of multiple shunt open-stubs [Reference Eccleston and Ong15, Reference Chung16]. Most of them were suitable for 3-dB coupling design, and some might be considered tedious and complicated.
Beside the pre-mentioned 3-dB ring hybrid circuits, the recent progress [Reference Ahn and Tentzeris17–Reference Hsu, Kuo and Chang23] on the rat-race couplers with arbitrary power division ratios have seized the attention for their wide and flexible applications. In general, the power division ratio relies on the characteristic impedances of the high/low impedance lines which compose the ring hybrid [Reference Pon5]. In [Reference Ahn and Tentzeris17, Reference Ahn and Nam18], the circuit reduction was performed with a wideband response, and the high-power division was obtained by replacing the high impedance lines with the coupled line and the line embedded with lumped inductors or shunt open-stubs. But these circuits were only suitable for high-power-division ratio, and the design of the high impedance lines was complicated. For examples, work in [Reference Honari19] required as many as four chip inductors which deteriorated the obtained BW and isolation, and in [Reference Chaudhary and Jeong20], the rat-race coupler focused on the negative group delay character obtained by using shunt elements of coupled line together with chip resistances. The power-division ratio also depended on the high/low characteristic impedance ratio of the ring's arms. Consequently, the power-division-ratio range is very limited due to the unfeasible high impedance line. Alternatively, artificial transmission lines [Reference Ho and Chi21] were applied to miniaturize the ring's high impedance arms for a large power-division-ratio case, but somehow it was rather complicated to extract the equivalent circuit model's element reactance values that correspond to their counterpart artificial line structures. In [Reference Park and Lee22], a uniform ring of 50 Ω with calculated arm lengths were used to achieve desired power-division ratio and size miniaturization, however, a large power-division ratio might cause some of I/O ports too close to secure a good isolation, and the power-division ratio is valid only around the design frequency. The work in [Reference Hsu, Kuo and Chang23] implemented a dual-band operation with a size reduction effect and an arbitrary power-division ratio. Again the power-division ratio also relied on the ring-arms’ high/low impedance ratio, that consequently restrained its applicable range.
Recently, the rat-race couplers of substrate integrated waveguide (SIW) were proposed [Reference Dong and Itoh24, Reference Rosenberg25]. They have revealed the potential of SIW in building hybrid couplers or in other circuits alike. Especially, in [Reference Rosenberg25] the 3-dB rat-race coupler which using two-pole filter configuration widened the obtainable BW which was usually quite narrow for an SIW resonator. Recognized in [Reference Piloto26–Reference Deslands and Wu28], the SIW (or laminated waveguide) used printed circuit board technology to create a waveguide-alike transmission line. Obviously, it inherits waveguide's merits and avoids waveguide's bulkiness and high fabrication cost, but still preserves the substrate's versatility and flexibility. More literature shows that the SIW has gained a better privilege in designing the filters [Reference Deslands and Wu29–Reference Chen, Hong and Ho34] and the hybrid coupler circuits [Reference Liu35–Reference Hong, Ho and Feng38]. Besides, the SIW is a better choice for filter and coupler design due to the reasons of high Q value, high power handling, low losses, excellent electromagnetic interference immunity, and sometimes circuit compactness. Furthermore, the SIW diversifies circuit design due to its various forms which include the regular SIW, the half-mode SIW (HMSIW), and the folded HM SIW (FHMSIW). It should be noted that the aforementioned comparison between the SIW circuitry and those of planar structures such as microstrip line, slot line, and coplanar waveguide has still remained arguable, since they are not in the same category (the SIW is considered as a three-dimensional configuration), and the planar structures excel the SIW in an easier manufacturing process.
As previously mentioned that couplers of various types have been developed by a variety of SIW structures, but the rat-race coupler is rarely observed in the literature. This might be owing to the nature of the circuit which is a closured transmission line of more than one wavelength. It is not easily realized by the SIW because of its large transversal dimension, and the structural discontinuities may arise in I/O port junctions, seriously affects the circuit performance. These all together hinders the SIW from the rat-race coupler applications. And the transmission-line composed rat-race couplers were very difficult to achieve an arbitrary power-division ratio in a wide range since the high/low impedance ratio of an extreme value is not feasible [Reference Ahn and Tentzeris17–Reference Hsu, Kuo and Chang23]. Hence, in this paper, we propose a novel rat-race coupler design which is based on the combination of the SIW cavity (SIWC)’s two degenerate modes to cope with the difficulty for achieving a truly wide range arbitrary power-division ratio without the possibly high numerical cost and design complexity. The coupler is built by a circular SIWC which supports two orthogonal degenerate modes. The combination of the two modes, its weighting ratio, literally defines the coupling coefficient. The two output ports are formed by subminiature version A (SMA) connectors and the two input ports (also termed as the summation port, Σ-port, and the difference port, Δ-port) are built of the microstrip line combined a perpendicular coupling slot. The angle between the microstrip line's longitudinal axis and the cavity's vertical bisector determines the combining weightings of the two degenerate modes. The two coupling slots are perpendicularly oriented to assure the optimal isolation between the output ports, and the one between the input SMAs relies on the orthogonality of the two degenerate modes. Since the SIWC rat-race coupler has ridded of the coupler's high/low impedance rule, and the power-division ratio is only determined by the degenerate modes’ weighting ratio which is arbitrary and can be analytically evaluated, hence the range of applicable power-division ratio is not limited. The degenerate modes are mutually orthogonal, and each of the modes is solely extracted by an optimal impedance-matched SMA probe with its position invariant to the power-division ratio, thus the I/O ports’ impedance matching and their isolation are easily accomplished without resorting to a complicated design procedure. In summary, the proposed SIWC rat-race coupler gains the advantages over the others in a wide range power-division ratio, an analytical solution for the power-division ratio, high power handling capacity, better I/O impedance matching, high isolation, and simple design method. Besides, compared with the previously mentioned arbitrary power-division-ratio designs, our circuit has a better fabrication tolerance for the power-division ratio, since it does not rely on the rule of high/low impedance lines. However, its drawbacks are a narrow BW and the power-division ratio is sensitive to the slot's tilted angle.
Sample experimental circuits are fabricated to verify the circuit design for both the 3- and 10-dB coupling cases. Circuit performance is evaluated in terms of the coupling precision, isolation, and phase imbalance about 0° and 180°. Owing to the nature of the cavity, the BW is quite narrow and not to be judged in this paper. The remainder of this paper is organized as follows. In the section ‘Degenerate modes analysis’, circuit analysis based on the degenerate modes combination is presented. Then, we accomplish the sample designs of the 3- and 10-dB coupling cases in the section ‘Sample circuits design and tolerance analysis’. Conclusions are given in the section ‘Conclusion’.
Degenerate modes analysis
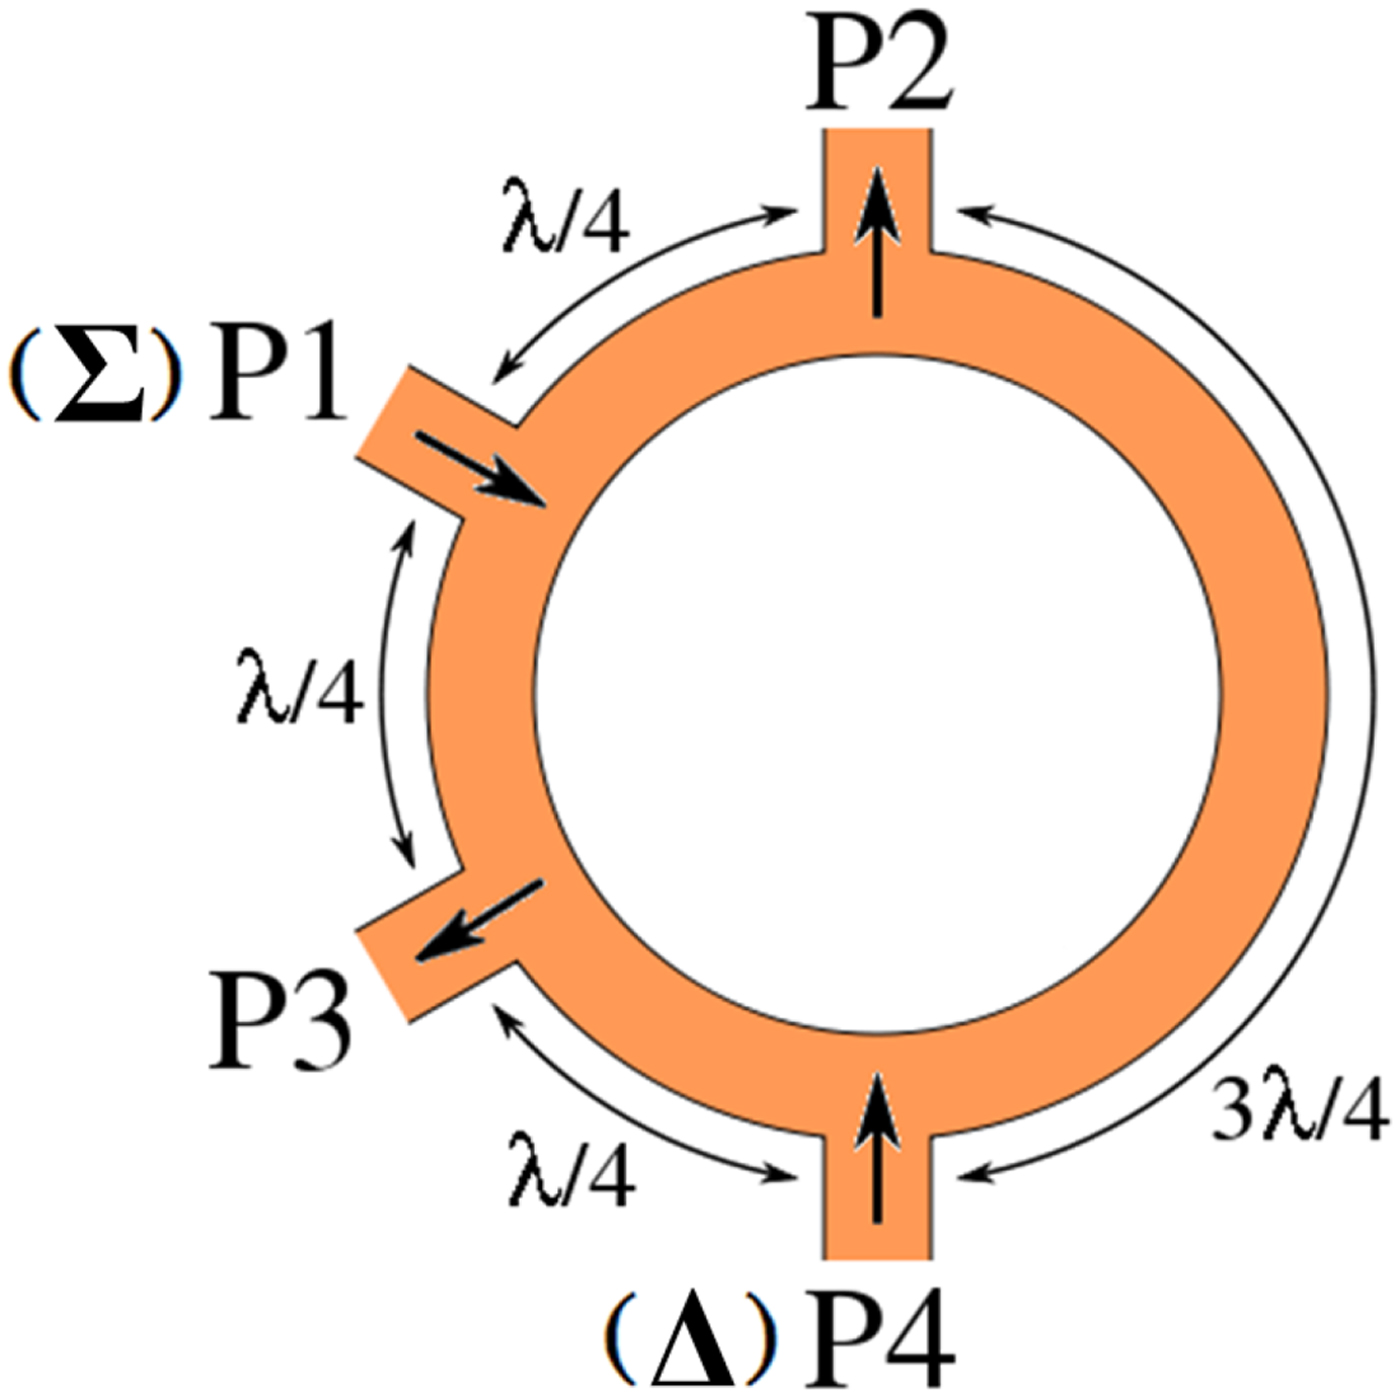
Traditional 3-dB rat-race coupler as shown in Fig. 1, a six quarter-wavelength ring, belongs to a four-port network with the adjacent ports apart by a quarter-wavelength. In Fig. 1 the ports P2 and P3 are output (input) ports, whose signals are equal amplitude with either a 0° or 180° phase difference. The ports P1 and P4 are the input (output) ports with the former used in the in-phase mode (where P2 and P3 in phase) and the latter in the out-of-phase operation (P2 and P3 out of phase). Hence, P1 is also termed as the Σ-port, and the P4 is the Δ-port. Such mechanism relies on the ring's precision dimension and impedance matching of ports [Reference Collin1–Reference Chang3]. Different coupling coefficients are available by this circuit structure with carefully chosen impedances, but the design procedure might be tedious, and the performance is deteriorated by the multiple discontinuities and structure asymmetry.
The typical 3-dB rat-race coupler structure.
Instead of the ring structure, we propose the concept of degenerate modes combination. In a substrate integrated circular cavity, which coexists two co-frequency modes having E-field distribution patterns perpendicular to each other. For example, equation (1) shows the TM 110 degenerate modes of the circular cavity with the resonance frequency given in equation (2). Although a square cavity has a similar phenomenon, the square shape has an inferior structural symmetry that slightly deteriorates the circuit performance, and hence it does not refer to this paper.
 $$\psi _{110}^{TM} = J_1\left( {\displaystyle{{x_{11}} \over b}\rho} \right)\left\{ \matrix{\sin \phi \hfill \cr \cos \phi \hfill} \right\},$$
 $$f_{110}^{TM} = \displaystyle{{x_{11}\,c} \over {2\pi {\kern 1pt} b\sqrt {\varepsilon _r}}}. $$
Here, b is the radius of the circular cavity, J 1 represents the 1st order Bessel function of the first kind, x 11 symbolizes the 1st zero of the function J 1, c stands for the value of light velocity, and ε r denotes the dielectric constant of the substrate. The equivalence between the proposed SIWC rat-race coupler and the conventional counterpart shown in Fig. 1 is that the former's TM 110 sine (cosine) mode signal is extracted to be the analog of the latter's P2 (P3) signal in Fig. 1. And the combined in-phase signals of TM 110 sine and cosine modes is equivalent to the one at P1 of Fig. 1, the out-of-phase sine and cosine modes combined signal imitates the one of P4. The merit of our circuit design is easy to implement an arbitrary combination ratio of these sine and cosine modes in a wide range without resorting to a complicated design procedure, and the achieved combination ratio is analytically evaluated.
In the design, the degenerate TM 110 sine and cosine modes are excited in the circular cavity. It is well known that these modes are orthogonal, satisfy equation (3) with the angled parenthesis denoting the surface integral over the cavity's transversal area [Reference Harrington39].
 $$\left\langle {{J_1}\left( {{{{x_{11}}} \over b}\rho } \right)\sin \phi ,\;{J_1}\left( {{{{x_{11}}} \over b}\rho } \right)\cos \phi } \right\rangle = 0.$$
The valid cavity field can be expressed as a linear combination of TM 110 sine and cosine modes given in equation (4). Upon equation (4), the field distributions of TM 110 sine mode and cosine mode are plotted in Figs 2(a) and 2(b), respectively. The sine (cosine) mode has a null field area by the central horizon (vertical), and it exhibits two E-fields maximums of opposite polarizations, marked by black dots and “x” signs, on the central vertical (horizon) in the up (right) and low (left) semicircles, respectively. The E-field pattern of the sine mode has its E-field variation along the vertical direction, and the one of the cosine mode is in the direction of x-axis. Accordingly, we might term the sine mode as the “v-mode” whose E-field has a pattern vector  $\hat y$ (a unit vector along y-axis) and the cosine mode namely “h-mode” which has
 $\hat x$ (a unit vector along x-axis) as its pattern vector. Note that the E-field pattern vector represents the same meaning to the term, E-field polarization, in [Reference Deslands and Wu29], however, the latter might confuse with the genuine E-field polarization.
The field distribution and the E-field pattern (shown in arrow) of the (a) TM 11 sine mode (v-mode) and (b) TM 11 cosine mode (h-mode).

The applied degenerate modes, v- and h-modes, are orthogonal and their E-field pattern vectors are perpendicular. In practical, the mode signals (energies) need to be extracted independently as much as possible. In observing the field distribution in Fig. 2, a probe locates to the E-field maximum of v-mode (on the y-axis) should extract the most of its signal with a minimum interference of h-mode, and this probe is apart from the circle center by the distance of  $\rho = {{({{x}^{\prime}}_{11}} / {x_{11}}})\,b$, which is obtained by solving
 ${J}^{\prime}_1(x_{11}\,\rho /b) = 0$. The same rule applies to the probe location (on the x-axis) for the h-mode extraction. For an arbitrarily combined field of equation (4), its E-field pattern vector,
 $\hat p$, is defined in equation (5). The corresponding weighting coefficient, c v, of the v-mode signal can be evaluated by an inner product of
 $\hat p \cdot \hat y$ and the one of h-mode is determined by
 $\hat p \cdot \hat x$, with the resultant values given in equation (6). Here, the ϕ p defined in a traditional cylindrical coordinate system is the angle of pattern vector
 $\hat p$.
 $$c_h\;J_1\,\cos \phi \;\; + \;c_v\;J_1\,\sin \phi, $$
 $$\hat p = \displaystyle{1 \over {\sqrt {c_v^2 + c_h^2}}} (c_h\,\hat x + c_v\,\hat y),$$
 $$\left\{ \matrix{c_v = \hat p \cdot \hat y = \sin \phi _p \hfill \cr c_h = \hat p \cdot \hat x = \cos \phi _p \hfill} \right.\,,\quad \phi _p \in (0^\circ, \,180^\circ ).$$
To see how these modes can be excited, let us consider the circular cavity shown in Fig. 3, in which there are two probe ports and two slot-coupled microstrip ports. Each probe is through via and is connected to the center conductor of a coaxial cable through a small circular slot on the cavity's top wall. The microstrip line above is coupled to the cavity through a perpendicular narrow slot located at the center of the cavity's top wall. Note here, the slot coupled microstrip feed on the back side of the cavity is not shown in the figure for the sake of circuit layout clarity. The probe of port 2 (3) has a normalized position vector of  $\hat y$ (
 $\hat x$). The microstrip line feeds the cavity along the direction that has an angle of ϕ p with respect to the x-axis. According to equations (5) and (6), the microstrip line excited E-field has the field pattern
 $\hat p = \,\hat x\cos \phi _p + \,\hat y\sin \phi _p$, and the extracted v- and h-mode portions from the port 2 and port 3 are proportional to sinϕ p and cos ϕ p, respectively. In Fig. 4, we plot the curves of c v and c h versus the angle ϕ p using equation (6). And for comparison, we also show the |S 21| and |S 31| curves that are simulated using Ansys HFSS. In the HFSS simulations, the dielectric and metal are both assumed free of loss. In addition, the impedance match at port 1 has been optimized by adjusting the dimensions of the narrow slot and the length of the microstrip line section that goes beyond the narrow slot; the impedance match at the two probe ports have also been optimized by adjusting the location of the probe in the radial direction and the radius of the circular slot that allows the probe to penetrate. It is of no surprise that c v agrees very well with |S 21| except for ϕ p very close to 0, around which the transmission coefficient is very small and hence is very sensitive in the simulation. Similarly, c h agrees very well with |S 31|. These results prove that the coupling coefficients defined by equation (6) are not only intuitive but also reasonable. Because of symmetry, we only show the results in the scope of (0°, 90°) but omit the data in the range of (90°, 180°). Note that if ϕ p ∈ (0°, 90°), c v and c h have the same sign, leading to in-phase output signals at ports 2 and 3. In contrast, if ϕ p ∈ (90°, 180°), c v and c h have opposite signs, causing the out-of-phase output signals at ports 2 and 3.
The feed structure of the cavity modes combined field in equation (5).

The combination weightings, c v and c h, versus ϕ p (the angle of E-field pattern vector).

In Fig. 3, port 2 and port 3 are mutually isolated since one probe is located in the null region of the mode excited by the other. In case the two position vectors of the ports are not perpendicular to each other, the isolation in between will downgrade. It is reasonable to define the isolation as
 $${\rm isolation}\,{\rm (dB)} = - 20\log _{10}( \vert \hat u_2 \cdot \hat u_3 \vert ),$$
with the vectors  $\hat u{}_2$ and
 $\hat u{}_3$ shown in the inset of Fig. 5 being the normalized position vectors of the port 2 and 3, respectively. Hence, in Fig. 5 we show the isolation between port 2 and port 3 as a function of the deviation angle ϕ d when the original port 1 is removed (i.e. the microstrip line is removed and the narrow slot in the top wall is filled with metal). The solid line is the analytic result computed using equation (7), The dashed line pertains the HFSS-simulated result of − 20 log 10|S 23|, where S 23 is the transmission coefficient from port 3 to port 2, and the maximum isolation is associated with the perpendicular position vectors. It is not surprising that two curves are very close to each other, and only very small discrepancies are observed between them. These discrepancies are owing to the field perturbations caused by the probes.
The isolation of the SMA probes versus the deviation angle, ϕ d.

Sample circuits design and tolerance analysis
Shown in Fig. 6 is the structure and dimensions of the sample circular SIWC 3-dB rat-race coupler's layouts of the first two metal layers and its side view. The circular cavity's radius is 31 mm measured from the via-hole's center to cavity center, and the via's diameter is 0.6 mm with a 2-mm period distance between adjacent via-holes. In the 3-dB design, c v = c h and the angle of E-field pattern vector is 45°. The circuit is composed of three tightly stacked RO4003 substrates with four metal layers. The substrate thickness is 32 mil for the cavity substrate and 20 mil for the microstrip ones. The dielectric constant is 3.55 with a loss tangent 0.0027. The top and bottom layers are 50-Ω microstrip feed, and the second and third layers together with a circular fence of buried via-holes form the SIWC. Two mutually perpendicular slots are etched on the SIWC's top and bottom walls, respectively. The microstrip together with the slot constructs the coupler's Σ-port and Δ-port. The output port 2 and port 3 are made of SMAs with the probe-ends shorting to the cavity's bottom wall. Port 2 is placed on the cavity's vertical bisector and is about a distance of 1/1.841 radius from the center, Port 3 location is on the horizontal one with about the same distance from the center. The layer of bottom wall slot and the one of microstrip are omitted here because their dimensions are same to the ones in Figs 6(a) and 6(b) and the circuit layouts can be duplicated by a 90° rotation of the ones of the first two layers. In Fig. 7, we show the simulated fields of v-mode, h-mode, and those of 45° and 135° E-field patterns. The v- and h-mode are excited by SMA probes of ports 2 and 3, respectively, and in which field nulls are clearly appeared by the vertical and horizontal bisectors. These field nulls elucidate the high isolation between the SMA probes since the passive port experiences a very weak signal due to the null field, which was just as mentioned in the section ‘Degenerate modes analysis’. The fields of 45° (135°) patterns are excited by Σ-port (Δ-port), respectively, from which the E-field pattern caused by Σ-port (Δ-port) is perpendicular to that of Δ-port (Σ-port) and the resultant signals at ports 2 and 3 exhibit the same (opposite) phase, suitable for an in-phase (out-of-phase) operation.
The (a) first, (b) second metal layer patterns, and (c) the side view for the 3-dB circular SIWC coupler structure and the dimensions (unit in mm).

The circular cavity's field distribution of (a) v-mode and (b) h-mode, (c) 45° E-field pattern, and (d) 135° E-field pattern.

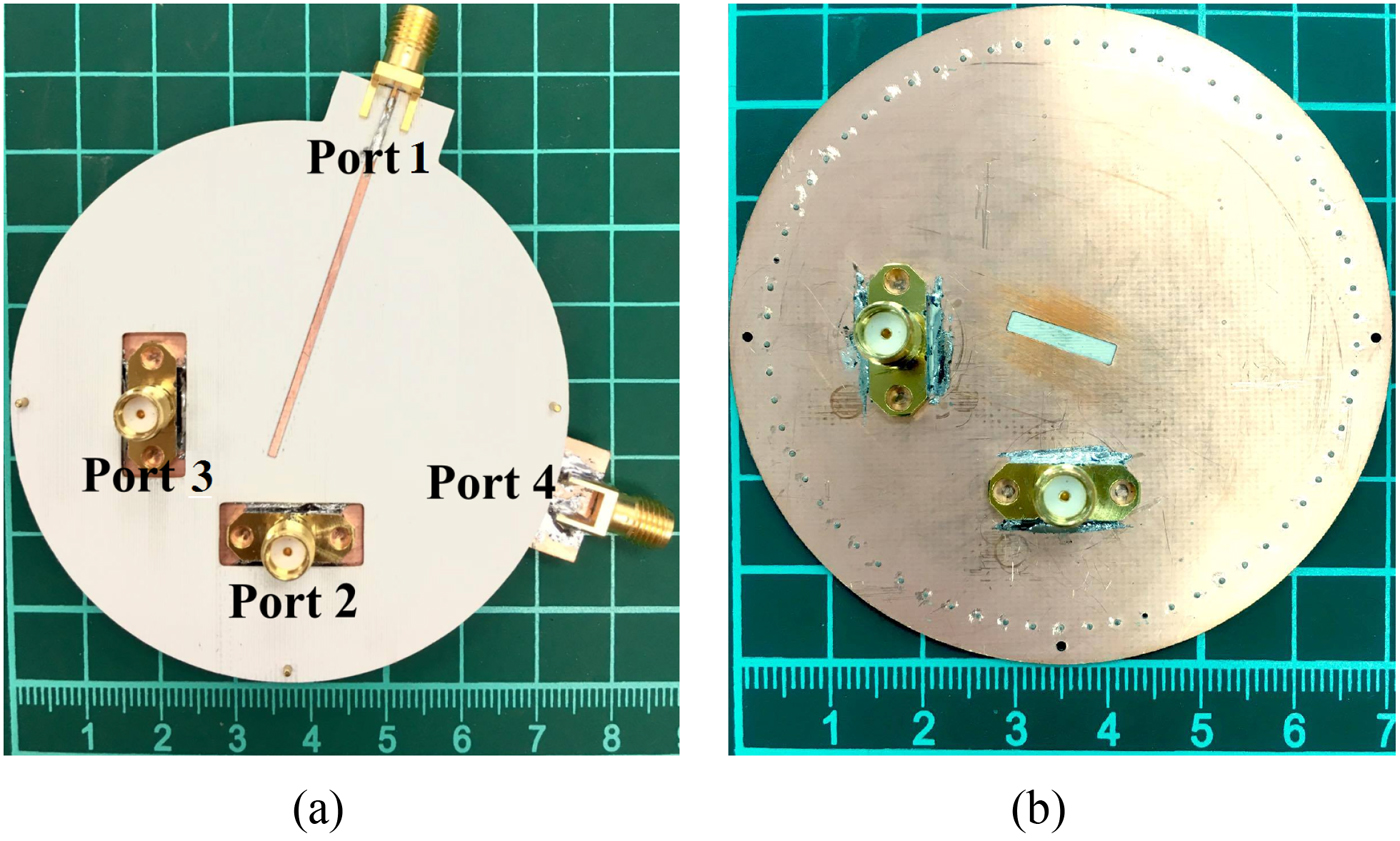
The circuit structure of the 10-dB coupler design is omitted here for conciseness since the circuit dimensions are the same as the ones of the 3-dB design except that the E-field pattern angle is set to 18.4°, and the length of microstrip beyond the slot's edge is tuned to be 5.6 mm for impedance matching. The performance of 3- and 10-dB couplers are given in Figs 8 and 9, respectively. In general, the measured data coincide with the simulated ones. In Fig. 8, the measured (simulated) peak values of S 21 and S 31 are −4.05 (−4.02) dB at 2.97 (2.99) GHz. The excess losses exceeding 3 dB count the ones of dielectric, conductor, and SMA connectors, and the frequency discrepancy is mainly due to manufacturing tolerance. The measured (simulated) isolations between ports 2 and 3 are greater than 30 (34) dB under the 1-dB BW criterion, and the ones between ports 1 and 4 are larger than 40 dB. The phase imbalances of both the in- and out-of-phase operations are considered to be excellent, all values are within ±1.2°. Shown in Fig. 9, the 10-dB coupling circuit's performance is equally well as the one of Fig. 8. The measured (simulated) 10-dB coupling S 21 and S 34 are −10.62 (−10.36) and −10.6 (−10.34) dB. Again, the extra 0.6 dB loss is caused by the aforementioned factors. The isolations are as good as the ones in Fig. 8. The phase imbalances for the circular cavity design are excellent due to the circle's structural symmetry. Even in the 10-dB case, the phase imbalances are kept within ± 5.2° For conciseness, in Fig. 10 we only present the photos of an experimental circuit for 10-dB circular SIWC rat-race coupler.
The measured and simulated scattering parameters and phase imbalances versus frequency for Fig. 6. (a) S 21, S 31, and S 23, (b) S 24, S 34, and S 14, (c) S 11, S 22, S 33, and S 44, and (d) phase imbalances for in-phase and out-of-phase operations.

The measured and simulated scattering parameters and phase imbalances versus frequency for 10-dB circular SIWC design. (a) S 21, S 31, and S 23, (b) S 24, S 34, and S 14, (c) S 11, S 22, S 33, and S 44, and (d) phase imbalances for in-phase and out-of-phase operations.

The photos of the 10-dB circular SIWC rat-race coupler circuit, (a) first metal layer and (b) the second layer with the SMAs.
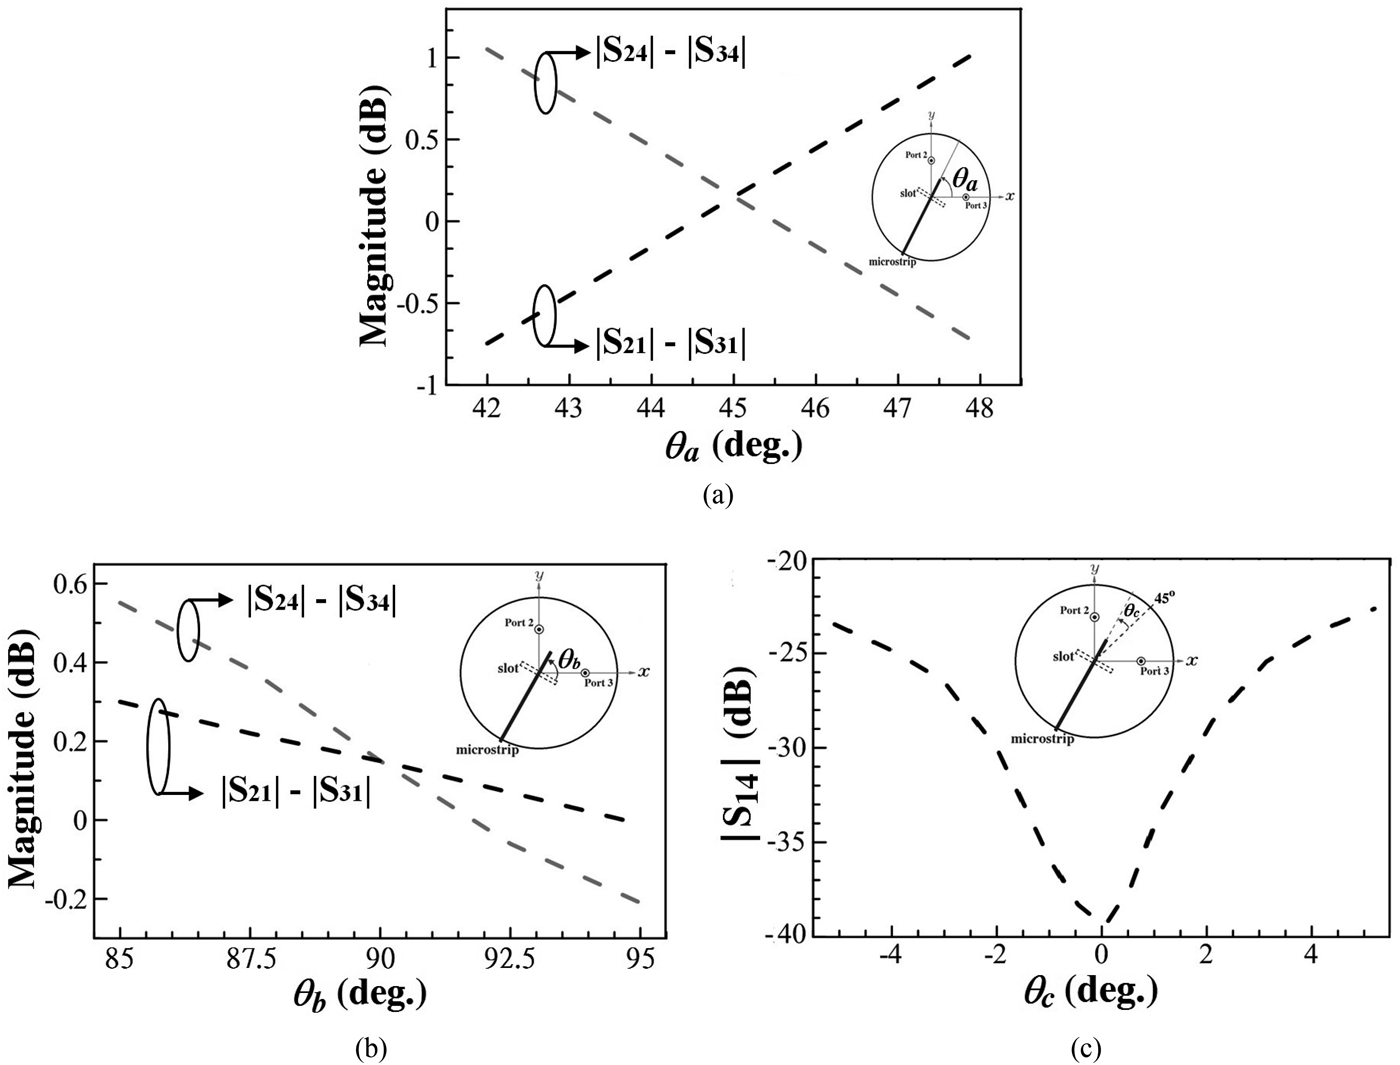
Since the circuit exhibits a very narrow BW and its performance including output ports’ amplitude imbalance and the isolations between the ports 2/3 and ports 1/4 greatly depend on the orthogonality of the degenerate modes and the two feeding slots’ perpendicular, respectively. Hence, the influence on performance due to manufacturing tolerances is analyzed, especially for the tolerances due to the microstrip line and slot misalignment. Herein and after, the manufacturing tolerance effects are calculated at the SIWC's resonance frequency based on the 3-dB coupler structure of Fig. 6. Figure 11(a) plots the amplitude imbalances of ports 2/3 defined by |S 21|–|S 31| and |S 24|–|S 34|, respectively, versus the orientation angle, θ a, of the microstrip line in port 1. Noted here in Fig. 11(a), the alignment of port 4 structure remains untouched and the port 1's coupling slot is kept perpendicular to the microstrip line. It is observed that the amplitude imbalances are slightly degraded due to θ a deviation from its original 45° axis. Not shown in the figure, the corresponding phase imbalances of ports 2/3 are very slightly affected. Figure 11(b) shows the amplitude imbalances of the output ports 2/3 due to the angle misalignment of the microstrip line to the slot in port 1. Here, θ b is the angle between the microstrip and the slot, and it purposely deviates from its original 90°. In the calculation, only the port 1's microstrip line is rotated and the other components keep the same position as they were in Fig. 6. It is observed that the amplitude imbalances are slightly affected by this port 1's microstrip/slot misalignment, and only a 0.5 dB difference occurs while θ b deviates 5° from its 90° perpendicular configuration. The isolation (in term of S 14) shown in Fig. 11(c), however, is dramatically deteriorated while the two coupling slots (ports 1 and 4) are not orthogonally oriented. In Fig. 11(c), the microstrip/slot of port 1 is managed to deviate from its original 45° axis and those of port 4 remain unchanged. It is obvious that the isolation is downgraded from 40 to 23 dB while the misalignment angle, θ c, is enlarged from its perpendicular configuration by ±5°. The performance due to distance offset of the microstrip line to the slot is also investigated in Fig. 12 that gives the amplitude imbalance of |S 21|–|S 31| versus the offset (d) defined by the deviation distance of the microstrip line from the slot's middle. We observe that a minor amplitude imbalance is caused by this microstrip line offset. Not shown in the figure, the input port impedance matching is also insignificantly affected by this offset. The isolation deterioration of the two SMA outputs due to the SMAs’ misalignment has been given in Fig. 5, which also indicates that the isolation between ports 2 and 3 can be significantly affected by the misalignment of the two SMAs.
Simulated amplitude imbalances, |S 21|–|S 31| and |S 24|–|S 34|, versus (a) the axis angle, θ a, of microstrip line, (b) the angle, θ b, between the port 1's microstrip line and the coupling slot, and (c) the simulated isolation between ports 1 and 4 (in term of |S 14|) versus the angle deviation, θ c, of the port 1 structure from its original 45° axis.
Simulated amplitude imbalances, |S 21|–|S 31| versus the distance, d, of the microstrip line deviated from the slot's middle point.

Conclusion
The novel design of the SIWC rat-race coupler of arbitrary coupling coefficient has been presented in this paper. Experimental circuits of 3- and 10-dB cases are fabricated to validate the circuit performance. The influence of manufacturing tolerance on circuit performance is also discussed in this paper. The proposed design method allows the circuit to be operated in an arbitrary combination of two degenerate modes, results in an arbitrary coupling coefficient ratio. Upon the orthogonality of the two degenerate modes, a simple v-h mode diagram is presented to excite the cavity mode which can be a precisely designated combination of the v-mode and h-mode. The arbitrary coupling effect is then achieved by solely extracting each of the two degenerated modes (namely, v- and h-modes) via one of the well field-isolated SMA probes. High isolation between the two exciting slots (ports 1 and 4) and insignificant phase imbalances are also accomplished in this paper as well. This intuitive and simple design method is helpful to improve the coupling precision without extensive numerical efforts.
Acknowledgements
This work is supported by the Ministry of Science and Technology, R. O. C. under the Grant contracts MOST 105-2221-E-018-003 and MOST 106-2221-E-018-005.
 Min-Hua Ho received the B.Sc. degree in control engineering from the National Chiao-Tung University, Hsinchu Taiwan, in 1985, the M.Sc. degree in electrical engineering from Syracuse University, Syracuse NY, in 1989, and the Ph.D. degree in electrical engineering from the Texas A&M University, College Station TX, in 1993. He was a faculty of the National Formosa University, Taiwan, from 1993 to 2000, and in 2000 he joined the National Changhua University of Education in Taiwan as an associate professor and was promoted to a professor in 2007. His research interests include microwave devices, antenna designs, and microwave integrated circuits.
 Yi-Hao Hong received his Diploma in 2014 from the Feng Chia University and received his M.Sc. degree at the National Changhua University of Education in 2016. He is currently serving as a microwave circuit research engineer in Wistron NeWeb Corp., Taiwan.
 Jen-Chih Li received his Bachelor and M.Sc. degree both in the National Changhua University of Education in 2015 and 2017. He joined the Quanta Computer Inc. in Taiwan serving as a microwave circuit research engineer, His research interests include the antenna and microwave circuit design.



