Introduction
Crystalline aluminum nitride (AlN) films have attracted considerable interest because they possess a very large band gap compared to the rest of the group III nitrides (6.2 eV) [Reference Hasegawa, Takahashi, Kubo and Nannichi1]. In addition, it has a high heat conductivity, excellent chemical and thermal stability; it will decompose rather than melt at 2400°C [Reference Tsvetdov, Zubrilov, Nikolaev, Soloviev and Dmitriev2]. Amorphous AlN films have also attracted some interest because the band gaps of these semiconductors are close to those of the corresponding crystalline materials (5.6 eV vs 6.2 eV), with localized electronic states that do not extend into the bandgap. The amorphous AlN films have many of the desirable qualities of the crystalline materials, most importantly, they are not easily recrystallized. Recently, rare earth doped III-V semiconductors have been the subject of great interest because of their strong visible luminescence [Reference Steckl and Birkhahn3,Reference Lozykowski and Jadwisienczak4]. The films have been doped with rare earth elements, and light emission from doped crystalline and amorphous AlN in both the visible and infrared has been confirmed [Reference Tucceri, Caldwell and Richardson5,Reference Gurumurugan6]. Manganese has been incorporated in powder samples of AlN [Reference Karel and Pastrnák7-Reference Serra, Magtoto, Ingram and Richardson9], with the tetravalent manganese ion, Mn4+, occupying tetrahedral sites. The incorporation of manganese into semiconductor hosts is of interest because the manganese activated AlN exhibits a maximum in the emission spectrum in the red region (∼600 nm).
Experimental
Crystalline aluminum nitride (AlN) films were grown by metal organic chemical vapor deposition (MOCVD) in a high vacuum stainless steel reaction chamber. This system consists of a growth chamber, pumping unit, and a gas inlet. An Alcatel corrosive resistant turbo pump evacuates the chamber into the 10−5 Torr range. The source gases for the AlN were ammonia (NH3) and trimethylaluminum (TMA). The gases were maintained in the chamber at a ratio of 2.5:1, respectively. Silicon (Si) (100) substrates, 5 mm. by 15 mm., were mounted onto a boron nitride ceramic heater and held in place by a molybdenum metal holder. A nichrome thermocouple was attached to the holder to determine the temperature during the deposition period. Pressures in the chamber were monitored with an ion gauge. The Si(100) substrates were flashed above 1050°C to remove the surface oxide coating. The substrates were then kept at a constant temperature around 850°C. A stoichiometric ration of 2.5:1 NH3 to TMA was used for growth and manganese decacarbonyl, ([Mn(CO)5]2), the dopant source, was introduced into the flow reactor via a pulse valve.
Amorphous AlN-Mn thin films were sputtered onto quartz substrates using a RF sputter system. The target was an aluminum disk with an Al/Mn pellet pressed into the disk. Typical growth parameters were 8 × 10⁻⁴ torr N2, 240 W rf power and approximately 0.6 Å second growth rates.
These films were characterized ex situ with IR reflectance microscopy, SEM imaging, X-ray fluorescence (XRF), X-ray diffraction (XRD), and cathodoluminescence (CL). An imagining fiber optic probe (boroscope) was placed ∼5 mm away from the sample. Cathodoluminescence from the samples were collected by the fiber and focused onto a CCD camera. The cathodoluminescence spectrum was collected with a lock-in amplifier, dual grating monochromator and photomultiplier tube.
Results
Sample 211 consists of a 2.1 µm Mn doped AlN film above of a 15.78 µm undoped AlN layer. A molybdenum mask was placed on half of the sample when the overlayer was grown. An image of sample 211, taken with the fiber optic probe, along with the schematic diagram of the sample is shown in Figure 1. IR reflectance microscopy was used to identify the thickness and chemical composition of the different layers. The entire sample (labeled A in figure 1) has an overall thickness of 17.88 µm while the pure AlN layer (labeled B) has a thickness of 15.78 µm. The IR reflectance measurements showed a strong (A1) LO mode for AlN at 920 cm−1 and 900 cm−1 with a shoulder at 849 cm−1. The relatively fast growth rates (3-5 µm per hour) produces multiple nucleation centers that lead to a very rough surface. X-ray Diffraction yielded three diffraction peaks at a 2θ position of 33, 36 and 38 degrees corresponding to 100, 002, and 101 lattice planes respectively. Films can be grown with the c-axis exclusively either parallel or perpendicular to the substrate but this particular film has texture both parallel and perpendicular to the substrate. The elemental composition of the film was examined with x-ray fluorescence (EDX). The amount of manganese in sample 211 was below the detection limit (0.01 %) of the X-ray fluorescence spectrometer.
(left) Schematic diagram (side view) and (right) picture taken inside the CL chamber with the boroscope of sample 211.

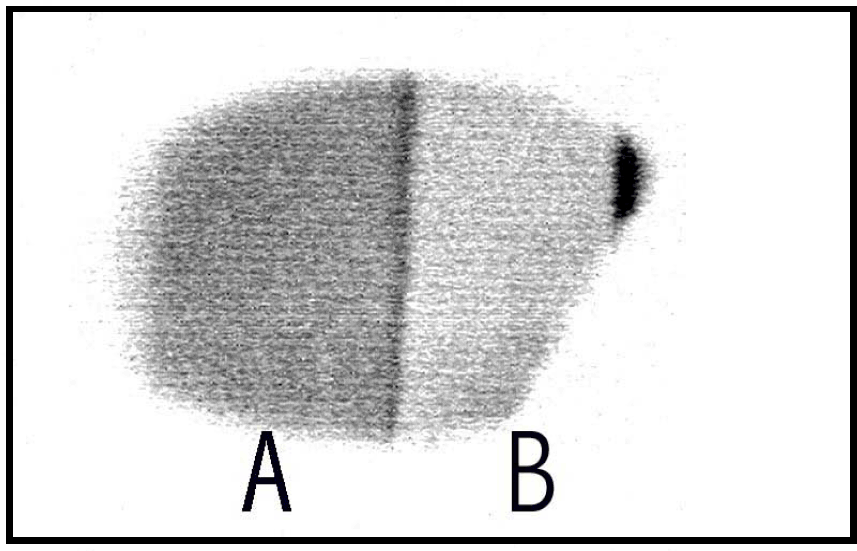
This sample showed strong cathodoluminescence. A reverse intensity image of the cathodoluminescence taken with the boroscope (2.8 keV beam excitation) is shown in figure 2. The luminescence could be observed through a CaF2 window and the region labeled A appeared yellow-orange to the eye while the region labeled B appear blue. The yellow-orange luminescent region is from the Mn doped overlayer while the blue luminescent region is from the “pure” AlN underlayer. The distance across the sample is ∼8 mm and the dark stripe separating region A from B is ∼250 µm. The topography of the sample is observable in figure 2. The oriented growth parallel to the substrate is observed as lines across the sample and epitaxial growth can be inferred from the image because the lines transverse across the entire sample including the region where the overlayer is grown on top of the underlayer. A magnification of a region of figure 2 is shown in figure 3 (real image) where the topography of the sample is easily discernible.
The cathode luminescence image of sample 211shows the two regions.

The real intensity CL image of sample 211 taken with the boroscope. The white vertical line in the center of the image is ∼250 µm in width.

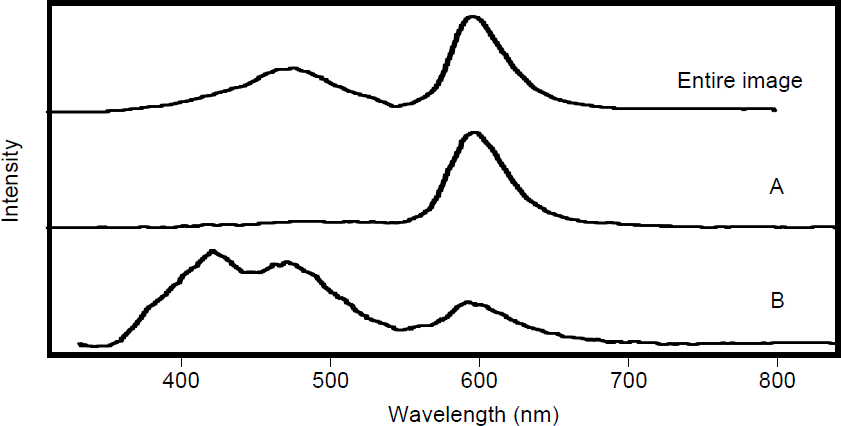
The CL spectrum taken from different regions of sample 211 is shown in figure 4. The spectrum of the entire image shown in figure 2 is presented in the top frame of figure 4. Three bands are observed. The bands are at 420 nm, 470 nm and 600 nm. The CL spectrum of region A (overlayer) is shown in the middle frame of figure 4. A band at 600 nm dominates the overlayer region (region A) with only minor intensity in the 420 nm band and 470 nm band. The underlayer region (region B) has two intense bands at 420 nm (blue) and 470 nm (blue-green) with a weaker band at 600 nm (red). The activation of Mn in AlN corresponds to a suppression of the 420 nm and 470 nm band with a corresponding increase in the 600 nm band.
CL spectra of sample 211 from the entire image shown in figure 2, from the overlayer of AlN-Mn (A) and from the underlayer of pure AlN (B).

A previous study of Mn doped single crystals of AlN showed absorption bands in the 400 to 600 nm region and an emission band around 600 nm [Reference Karel and Mares8]. A theoretical analysis of the spectroscopic results suggested that Mn4+ ions are incorporated in tetrahedral lattice sites [Reference Karel and Mares8]. The energy level diagram derived from these spectroscopic results is shown in figure 5. The CL bands shown in Figure 4 agrees with the energy level diagram, presented in figure 5, for single crystal AlN doped with Mn. SIMS analysis on a different sample that has similar CL to sample 211 showed a higher level of Mn incorporation than any background impurity [Reference Tucceri, Caldwell and Richardson5].
Energy levels for manganese centers in AlN, taken from F. Karel, J. Mareš, Czech. J. Phys. B 22, 847 (1972).

For cathodoluminescence, the direct gap excitation of AlN is accomplished with bombardment of the sample with 2.8 keV electrons. This energy is then transferred into the manganese ions incorporated into the lattice structure. The CL spectrum from the activated Mn sample (region A) is dominated by the lowest energy transition (600 nm). This implies that there is either a very effective energy transfer mechanism from higher to lower electronic states in activated Mn/AlN or that only energy transfer from the AlN populates the lowest electronic state of Mn. Region B must have small amount of Mn incorporated in the AlN because it is possible to observe cathodoluminescene. No cathodoluminescence is observed for thin films of pure AlN. Presumably, the concentration of Mn in region B is significantly less than that of region A. Observation of strong CL bands at 420 nm and 470 nm indicates that either the excited electronic states of Mn in this region must be comparable or that there is efficient energy transfer into all the upper electronic states of Mn.
The CL properties of Mn incorporated into amorphous AlN was investigated. Amorphous AlN thin films (∼5000 Å in thickness) incorporated with varying amounts of Mn (0.5% to 4%) were grown with RF sputtering at room temperature. Unfortunately, the amorphous AlN samples showed little or no cathodoluminescence. It is possible that the manganese is incorporated in the interstitial cavities of the lattice and energy transfer from the AlN lattice to the Mn is very inefficient. High temperature annealing of amorphous AlN does not significantly alter the properties of the film and a temperature region might exist where Mn can be activated (movement from interstitial to lattice sites) but the AlN film remains unchanged.
Conclusions
The incorporation of a small amount of manganese (<0.1%) in crystalline AlN gives rise to three emission bands at 420 nm, 470 nm, and 600 nm in the CL spectrum. These emission wavelengths correspond to previously published excitation and emission data for crystalline AlN films doped with manganese. The manganese activated crystalline AlN layer shows a strong emission band at 600 nm with minor intensity bands at 420 nm and 470 nm. The unactivated Mn crystalline AlN layer shows intnese bands at 420 nm, and 470 nm with a weaker band at 600 nm. The activation of Mn in crystalline AlN corresponds to a suppression of the 420 nm and 470 nm band with a corresponding increase in the 600 nm band. The amorphous AlN films incorporated with varying amounts of Mn showed little or no cathodoluminscence.
Acknowledgements
This work is supported by a BMDO URISP grant N00014-96-1-0782 entitled “Growth, Doping and Contacts for Wide Band Gap Semiconductors” and grant N00014-99-1-0975 entitled “Band-Gap Engineering of the Amorphous In-Ga-Al-Nitride Semiconductor Alloys for Luminescent Devices on Silicon from the Ultraviolet to the Infrared”.