


1. Introduction
Global government debt is on a remarkably upward trajectory in recent years, with the ratio of government debt to Gross Domestic Product (GDP) in major economies approaching historical peak since 1960 (Reinhart and Rogoff, Reference Reinhart and Rogoff2011; Yared, Reference Yared2019), posing a significant threat to long-term economic stability and growth. (Reinhart et al. Reference Reinhart, Reinhart and Rogoff2012; Eberhardt and Presbitero, Reference Eberhardt and Presbitero2015). As a fast-developing economy, China has also witnessed a substantial rise in government debt, as evidenced by Figure 1 (Bai et al. Reference Bai, Hsieh and Song2016; Huang et al. Reference Huang, Pagano and Panizza2020; Chen et al. Reference Chen, He and Liu2020). However, unlike advanced economies, the surge in government debt in China is primarily driven by local governments rather than the central government. Despite the Budget Law’s prohibition on official government debt, local prefectures are still able to issue “de facto” debts by establishing local government financing vehicles (LGFVs)Footnote 1 to fund stimulus spending (Bai et al. Reference Bai, Hsieh and Song2016).
Investment rate and the ratio of local government financing vehicle (LGFV) Debts to GDP.
Notes: The investment rate is the ratio of the gross fixed capital formation to GDP. The gross fixed capital formation series and GDP series are from China National Bureau of Statistics. Total LGFV debts series is aggregated from the total debt, which consists of outstanding bank loans, outstanding bonds and various payables, of LGFVs issuing municipal corporate bonds by the end each year. Firm-level LGFV debt data were drawn from WIND.

The rise in local government debt can potentially be attributed to the unique political bureaucratic system. Career promotions for local officials are primarily determined by central government directives rather than electoral processes, and are intricately linked to the economic performance of their respective regions. This “economic tournament,” in which local officials are incentivized to prioritize economic growth (Li and Zhou, Reference Li and Zhou2005; Xiong, Reference Xiong2019). This competition leads local officials to adopt expansionary fiscal policies, especially amidst adverse economic shocks, in pursuit of favorable economic outcomes.
Similar to many other countries, one of the adverse economic shocks experienced in China in the past decade has stemmed from the stringent enforcement of environmental regulations (Greenstone et al. Reference Greenstone, List and Syverson2012; Martin et al. Reference Martin2014; Chen et al. Reference Chen, Li and Lu2018; Cui et al. Reference Cui, Wang, Zhang and Zheng2021). Since 2006, the attainment of local environmental targets established by higher-level governments has, in addition to the promotion of economic growth, become another prerequisite for the promotion of local officials.Footnote 2 In this context, the goal of this paper is to investigate how environmental policies affect local government debt when local officials face the (potentially conflicting) dual tasks of protecting the environment and promoting local economic growth. Answering this question offers a new perspective of debt accumulation under the global emphasize on environmental protection when economic development or stabilization is still pursued by the government, thereby enhancing our understanding of the costs associated with environmental regulations originating from the (potential) policy-induced over-accumulation of debt.
While we describe environmental regulations as adverse economic shocks in this paper, we do not, by any means, indicate that they are socially bad. In fact, the vast environmental economics literature has rigorously estimated the health benefits of pollution control (Chay and Greenstone, Reference Chay and Greenstone2003; Greenstone and Hanna, 2011; Tanaka, Reference Tanaka2015, to name a few). Our focus on the cost implications of these regulations is intended to highlight areas where there remains potential to reduce policy costs.
We approach the research question by first setting up a theoretical model based on Xiong (Reference Xiong2019) to elucidate the effects of environmental policy on local government debt accumulation within China’s distinct bureaucratic context. In the model, we distinguish between two types of local officials: “benevolent” and “politically incentivized”. The former group optimally determines the debt amount to maximize social welfare by equating the marginal social benefits with the marginal social costs associated with debt expansion, wherein the benefits come from short-term GDP stabilization and the costs come from a higher debt repayment in the future. A growing number of theoretical studies, however, have shown that government officials are far from being benevolent: they document “political budget cycles” related to the tenures of officials who are present-biased towards public spending (Alesina and Tabellini, Reference Alesina and Tabellini1990; Yared, Reference Yared2010). Such “present bias” can have various origins but the implications are similar: it creates a wedge between the incentives of the benevolent officials and the officials with their private career incentives. These “politically incentivized” local officials’ objective may then deviate from benevolent social planning: there is also an additional marginal private benefits of issuing debt for the purpose of achieving a promotion; thus, they tend to over-issue LGFV debts.
The primary conclusion drawn from the model is that both benevolent officials and those motivated by private career incentives are inclined to issue more debt in response to the economic downturn caused by the stringent enforcement of environmental policies; however, the latter group is more prone to excessive debt accumulation due to the presence of a private “promotion benefit” in addition to the social benefits of issuing debt.
Guided by the theoretical model, we then proceed to empirically test these implications by exploring the Air Pollution Prevention and Control Action Plan (hereafter, “the Action Plan”) in China as a natural experiment. Unsurprisingly, the policy resulted in a significant contraction in local industrial business, consequently reducing local tax revenues and adversely affecting economic growth. Meanwhile, local governments’ land financing income, one of the most important sources of off-balance-sheet local government income, did not change significantly in response to the Action Plan. Consistent with the predictions of our theoretical model, Chinese local governments inevitably increased their debt levels to stabilize local economy under shocks. Given their constrained capacity to run budget deficits, as discussed earlier, local officials resorted to off-balance-sheet debts for fiscal stimulus (Bai et al. Reference Bai, Hsieh and Song2016). Our empirical results indicate that, on average, a one-standard-deviation increase in the tightness of the Action Plan resulted in approximately a 5% rise in the annual issuance of less-regulated off-balance-sheet LGFV debts. Our findings elucidate how a policy shock that aims to enhance environmental quality can affect government leverage, which, in turn, increases the costs of environmental policies.
The results above confirm the first part of the theoretical implications but have not differentiated between debt-sourcing behaviors of benevolent local governors and those motivated by private career incentives under the Action Plan. To illustrate the latter implication, we collect data from 2011 to 2017 on prefecture-level local officials and further categorize LGFV debts into “other payables” and “non-other payables,” with the former presenting higher risk. As expected, LGFV debts sourced from higher-risk channels increased more significantly in prefectures with more “politically incentivized” local officials after the implementation of the Action Plan. Therefore, we demonstrate that political fiscal cycles, driven by local officials’ concerns regarding their political careers, incentivize deviations from the socially optimal debt accumulation under environmental policies. These results also empirically validate the prediction of macro-political models, indicating that the absence of fiscal rules, in conjunction with present-biased governance – particularly in the context of economic tournament among local governors – may lead to welfare loss through excessive debt accumulation risk. Finally, consistent with the predictions of fiscal policy theories that long-run level of debt depends on initial debt conditions (Lucas et al., Reference Lucas, Robert and Nancy1983), we also find evidence of path dependence in local government responses to the Action Plan that accelerates risk accumulation and may further increase the costs of environmental policies.
China is currently on a fast-track of “going green” but still keeps a moderate high economic growth rate. Overall, our findings suggest that local officials in China resort to issuing debts to mitigate economic slowdowns caused by tightening environmental regulations, which, however, may create future financial risk when interacting with social-economic and political conditions. An emerging body of literature emphasizes the need to design fiscal rules that mitigate debt over-accumulation (Halac and Yared, Reference Halac and Yared2022). Our findings underscore the necessity for enhanced coordination between fiscal and environmental policies in China, particularly in light of the prevailing strength of political forces and the increasing stringency of environmental protection measures.
The remainder of the paper proceeds as follows. Section 2 places our study in the broad literature. Section 3 derives testable hypotheses from a theoretical model. Section 4 briefly introduces the institutional background. Data, the construction of key variables, and the empirical methodology are presented in Section 5. Section 6 presents the estimation results and Section 7 concludes the paper.
2. Literature review
This paper relates to the extant literature in three aspects. First, there is a growing body of literature focusing on local government debt in China. Bai et al. (Reference Bai, Hsieh and Song2016) document the evolution of LGFV debts since the global financial crisis. Xiong (Reference Xiong2019) theoretically explains the local government debt over-accumulation by building a dynamic macroeconomic model with the “economic tournament” among local officials, which is empirically demonstrated by Li and Zhou (Reference Li and Zhou2005), Guo (Reference Guo2009), and Xu (2011). Several other studies examine the macroeconomic or financial effects of local government debt accumulation (Ambrose et al. Reference Ambrose, Deng and Wu2015; Huang et al. Reference Huang, Pagano and Panizza2020; Chen et al. Reference Chen, He and Liu2020).
Our paper fits into to these literatures by embedding environmental policy into this “tournament” framework and analyzing the effects of environmental policy on local government debt accumulation within China’s distinctive political system theoretically and empirically. The focus on the relationship between environmental policy and government debt is both new and important. The potential risk under the country’s promise to transit into a green economy cannot be ignored given its reliance on government debt to stabilize local economy.
Second, in this vein, our paper also contributes to a large body of literature on the benefit-cost of environmental policies. Most micro-level studies in this literature investigate the costs of environmental regulations separately from the potential welfare effects induced by government’s reaction to these regulations. For example, the literature has examined the negative impacts of the policies on firm behavior, productivity and employment (Greenstone, Reference Greenstone2002; Greenstone et al. Reference Greenstone, List and Syverson2012; Yamazaki, Reference Yamazaki2022; He et al. Reference He, Wang and Zhang2020; Fan et al. Reference Fan, Zivin, Kou, Liu and Wang2019; Fan et al. Reference Fan, Ge, Li and Zhao2021; Mao et al. Reference Mao, Wang and Yin2022; Walker, Reference Walker2011; Walker, Reference Walker2013). The “double dividend” literature initiated by Bovenberg and De Mooij (Reference Bovenberg and De Mooij1994) and Goulder (Reference Goulder1995) focus on policy design: they demonstrate that government can recycle the revenue collected from environmental taxes, which helps to reduce distortive labor taxes, thereby reducing the costs of the regulations. Therefore, the role of government in their studies is policy maker, rather than entities directly affected by the policy.
Our paper fills the literature gap by explicitly considering how the response of government, as an affected party under environmental policies, may result in policy cost implications. Given the pivotal role of local governments in the Chinese economy, only Ye and Lin (Reference Ye and Lin2020) have examined how these governments respond to environmental policies through tax instruments, which create immediate distortions. In contrast, we focus on the debt instrument, which poses risks for the future rather than the present.
Third, more generally, this study also contributes to a large literature on global government debt. Reinhart and Rogoff (Reference Reinhart and Rogoff2010, Reference Reinhart and Rogoff2011) study global government debt cycles and investigate their impacts on the macroeconomy with a country-level database. Alesina and Tabellini (Reference Alesina and Tabellini1990) and Yared (Reference Yared2010) theoretically show that governments tend to have an inefficiently high level of debt when their roles depart from a “benevolent social planner.” Yared (Reference Yared2019) surveys that various political forces that results in “myopic” government with present-biased preferences in advanced economies significantly contribute to the long-run trajectory of government debt, including the increasing political polarization and heightened electoral uncertainty. Pappa (Reference Pappa2021) documents that the increase in the fiscal flexibility in EU during “Great Recession” led to a large surge in government debt.
Our paper provides empirical evidence supporting the theoretical predictions of this literature within the context of a developing country, wherein the distinct political structure can also interact with adverse economic shocks to facilitate debt accumulation. On the one hand, although the political incentive in China is distinct, its existence precisely illustrates that debt over-accumulation happens when, for example, governors are “myopic” with present-biased preferences. Our empirical analysis supports this general theory. On the other hand, traditional empirical evidence on debt accumulation is largely based on aggregate time-series data and economy-wide shocks (Marcet and Scott, Reference Marcet and Scott2009), making it difficult to tease out the effects of other aggregate concurrent events from the effects of the shock being considered. Meanwhile, it is also difficult to test how differentiated socioeconomic conditions shape the debt accumulation problem with aggregate data. Our study can address these issues by adopting micro-econometric technique.
3. A theoretical model
In this section, we establish a stylized theoretical model to analyze the impact of environmental policy on local government debt within the context of China’s unique bureaucratic system. The majority of the model’s framework is based on Xiong (Reference Xiong2019), with the novel introduction of an environmental policy component.
3.1. Model environment
An economy consists of
 $N$
regions, each governed by one local government and served by a representative firm. The representative firm produce output with a Cobb-Douglas technology:
 \begin{equation*} Y_{it}=A_{it}Z_{it}K_{it}^{\alpha }\left(L_{it}G_{it}\right)^{1-\alpha }, \end{equation*}
where
 $A_{it}$
is local productivity,
 $Z_{it}$
is the flow emission input for production that is controlled by central government’s environmental policy,
 $K_{it}$
is capital used for production,
 $L_{it}$
is local labor input, and
 $G_{it}$
is infrastructure created by the local government.
In each period, the representative firm first observes local productivity
 $A_{it}$
, emission
 $Z_{it}$
, infrastructure
 $G_{it},$
and then hires capital
 $K_{it}$
, and labor
 $L_{it}$
to maximize its profit:
 \begin{equation*} max_{\left\{{Z_{it}},{K_{it}},{L_{it}}\right\}}A_{it}Z_{it}K_{it}^{\alpha }L_{it}^{1-\alpha }G_{it}^{1-\alpha }-RK_{it}-\Phi _{it}L_{it}, \end{equation*}
where
 $\Phi _{it}$
is the competitive wage,
 $R$
is the rental price of capital that equals to the interest rate.
 $R$
is globally determined since each region is a small open economy. Suppose the labor is immobile and each region has a fixed labor supply
 $L_{it}=1$
. The first order conditions are
 \begin{equation*} \Phi _{it}=\left(1-\alpha \right)A_{it}Z_{it}K_{it}^{\alpha }G_{it}^{1-\alpha }, \end{equation*}
 \begin{equation*} K_{it}=\left(\frac{\alpha A_{it}Z_{it}}{R}\right)^{\frac{1}{1-\alpha }}G_{it}. \end{equation*}
By substituting
 $K_{it}$
and
 $L_{it}$
into the production function, we have
 \begin{equation*} Y_{it}=\left(\frac{\alpha }{R}\right)^{\frac{\alpha }{1-\alpha }}\left(A_{it}Z_{it}\right)^{\frac{1}{1-\alpha }}G_{it}. \end{equation*}
In each region, there are overlapping generation of households, with each generation living for two periods. Each individual born at period
 $t$
has identical preferences given by
 \begin{equation*} ln\left(C_{it}^{t}\right)+\beta ln\left(C_{it+1}^{t}\right), \end{equation*}
where
 $C_{it}^{t}$
and
 $C_{it+1}^{t}$
denote consumption chosen by the individual across his/her lifetime at
 $t$
and
 $t+1$
.Footnote
3
The budget constraints for each individual is
 \begin{equation*} C_{it+1}^{t}=\left(1-\tau \right)RS_{it}^{t}, \end{equation*}
where
 $S_{it}^{t}$
is individual’s saving and
 $\tau$
is the tax rate on both labor and capital income.
Local government’s tax revenue in period
 $t$
is
 \begin{equation*} \tau \left(\Phi _{it}L_{it}+RK_{it}\right)=\tau Y_{it}, \end{equation*}
which contributes to its budget at the end of period
 $t$
:
 \begin{equation*} W_{it}=\tau Y_{it}+\left(1-\delta _{G}\right)G_{it}-RD_{it-1}, \end{equation*}
where
 $W_{it}$
is the budget resources owned by local government,
 $\delta _{G}$
is the depreciation rate of infrastructure,
 $D_{it-1}$
is local government debt issued at
 $t-1$
. Local governor can issue new debt
 $D_{t}$
, in addition to
 $W_{t}$
, to fund government employees’ consumption
 $E_{it}^{G}$
in the current period and the infrastructure for next period
 $G_{it+1}$
:
 \begin{equation*} W_{it}+D_{it}=G_{it+1}+E_{it}^{G}. \end{equation*}
3.2. Role of career incentives amidst environmental regulation
There exists an agency problem between the central and local governments. We adopt the following specification of the productivity of region
 $i$
:
 \begin{equation*} A_{it}=e^{{f_{t}}+{a_{it}}+{\varepsilon _{it}}}. \end{equation*}
where
 $f_{t}$
denotes a countrywide common shock,
 $a_{it}$
represents the local governor’s ability in developing the local economy,
 $\varepsilon _{it}$
is an idiosyncratic noise component. These components are independent of each other, and all are not publicly observable. Central government promotes local governors based on their anticipated economic abilities. The central government forms posterior prediction on local governors’ ability based on the realized economic outcome of all local governors:
 \begin{equation*} \hat{a}_{it+1}=E\left[a_{it+1}|\left\{Y_{it+1}\right\}_{i=1,2,\ldots, M}\right]. \end{equation*}
To derive
 $\hat{a}_{it+1}$
above, we need to get an expression for
 $Y_{it+1}$
, which, in log-scale, is given by:
 \begin{equation*} y_{it+1}\equiv ln\left(Y_{it+1}\right)=ln\left[\left(\frac{\alpha }{R}\right)^{\frac{\alpha }{1-\alpha }}\left(A_{it}Z_{it}\right)^{\frac{1}{1-\alpha }}G_{it+1}\right] \end{equation*}
 \begin{equation*} =\frac{1}{1-\alpha }\left(f_{t+1}+a_{it+1}+\varepsilon _{it+1}\right)+\frac{1}{1-\alpha }ln\left(Z_{it+1}\right)+\frac{\alpha }{1-\alpha }ln\left(\frac{\alpha }{R}\right)+ln\left(G_{it+1}\right). \end{equation*}
Following Xiong (Reference Xiong2019), there exists a general sufficient statistic for governor’s economic ability:
 \begin{equation*} m_{it+1}\equiv \left(1-\alpha \right)\{y_{it+1}-\left[\frac{1}{1-\alpha }ln\left(Z_{it+1}\right)+\frac{\alpha }{1-\alpha }ln\left(\frac{\alpha }{R}\right)+ln\left(G_{it+1}^{\mathrm{*}}\right)\right]. \end{equation*}
The central government expects that local governor will choose
 $G_{it+1}$
equaling to
 $G_{it+1}^{\mathrm{*}}$
. Hence, from the central government’s perspective in interpreting the information content of this statistics,
 $m_{it+1}$
becomes
 \begin{equation*} m_{it+1}^{c}=f_{t+1}+a_{it+1}+\varepsilon _{it+1}. \end{equation*}
Hence, the learning rule for central government becomes
 \begin{equation*} \hat{a}_{it+1}=E\left[a_{it+1}|\left\{m_{it+1}^{c}\right\}_{i=1,2,\ldots, M}\right]. \end{equation*}
From local governor’s perspective, the sufficient statistic becomes
 \begin{equation*} m_{it+1}^{l}=f_{t+1}+a_{it+1}+\varepsilon _{it+1}+\left(1-\alpha \right)\left[ln\left(G_{it+1}\right)-ln\left(G_{it+1}^{\mathrm{*}}\right)\right], \end{equation*}
which is increasing in local government spending
 $G_{it+1}$
. Under this setup, the maximization problem for the local governor becomes
 \begin{equation*} V\left(W_{it}\right)=max_{{G_{it+1}},{D_{it}}}\{\rho \left[ln\left(C_{it}^{t}\right)+ln\left(C_{it}^{t-1}\right)\right]+\gamma ln\left(W_{it}+D_{it}-G_{it+1}\right) \end{equation*}
 \begin{equation*} +\beta E_{t}V\left(\tau Y_{it+1}+\left(1-\delta _{G}\right)G_{it+1}-RD_{it}\right)+\kappa _{i}\left[lnG_{it+1}-lnG_{it+1}^{\mathrm{*}}\right]\}. \end{equation*}
where the parameter
 $\rho$
and
 $\gamma$
are weights of the households’ and government employees’ consumption assigned by local government.
 $\kappa _{i}$
is a function of deep parameters in the signal-noise setting derived in Xiong (Reference Xiong2019) that captures the career incentive.Footnote
4
If the local governor is benevolent,
 $\kappa _{i}=0$
. If he/she cares about future promotion,
 $\kappa _{i}\gt 0$
. Issuing more debt increases the likelihood of being promoted, which increases the local governor’s value function, and the strength of this “marginal private benefit” is dictated by
 $\kappa _{i}$
. This benefit is classified as “private” since it is excessively reaped by the local governor rather than the broader society. The additional term
 $\kappa _{i}[lnG_{it+1}-lnG_{it+1}^{\mathrm{*}}]$
, which captures the difference between “benevolent” and “politically incentivized” governors, remains unchanged even if households experience disutility from flow emissions
 $Z_{it}$
, and the local governor takes this into consideration.
We now formally derive our testable hypotheses. Define two ratios:
 \begin{equation*} g_{it+1}=\frac{G_{it+1}}{W_{it}}, d_{it}=\frac{D_{it}}{G_{it+1}}. \end{equation*}
After solving the local governor’s maximization problem following the method in Xiong (Reference Xiong2019), we can haveFootnote 5
 \begin{equation*} g_{it+1}=\frac{\beta \gamma +\kappa _{i}}{\gamma +\kappa _{i}}\frac{1}{1-d_{it}}. \end{equation*}
Based on this equation, we can further derive the response of
 $d_{it}$
to
 $g_{it+1}$
as
 \begin{equation*} \frac{\partial d_{it}}{\partial g_{it+1}}=\frac{\beta \gamma +\kappa _{i}}{\gamma +\kappa _{i}}\left(g_{it+1}\right)^{-2}. \end{equation*}
Given the parameter values and
 $\kappa _{i}\geqq 0$
, we know
 $\frac{\partial d_{it}}{\partial g_{it}}\gt 0$
. If there is a persistent environment shock to restrict emission
 $Z_{it}$
, then current output
 $Y_{t}$
decreases, so does the local government budget wealth
 $W_{it}$
. The local governor will choose to increase infrastructure
 $G_{it+1}$
in order to stabilize the economy. Hence,
 $g_{it+1}$
increases, then
 $d_{it}$
also goes up given
 $\frac{\partial d_{it}}{\partial g_{it}}\gt 0$
. A higher
 $d_{it}$
implies that local governor chooses to issue more government debt
 $D_{it}$
to mitigate the negative effect of environment policy on government budget. This implication holds for benevolent governor or governor with career incentive. Hence, we have the first hypothesis.
Hypothesis 1: If an environmental policy shock occurs that restricts emissions, it will lead to a decline in economic output. In response, both a benevolent governor and a governor motivated by career incentives are likely to choose to issue more debt.
Additionally, we can derive
 \begin{equation*} \frac{\frac{\partial d_{it}}{\partial g_{it+1}}}{\partial \kappa _{i}}=\frac{\left(1-\beta \right)\gamma }{\left(\gamma +\kappa _{i}\right)^{2}}\left(g_{it}\right)^{-2}. \end{equation*}
Since the discount factor
 $\beta \lt 1$
,
 $\frac{\frac{\partial d_{it}}{\partial g_{it+1}}}{\partial \kappa _{i}}\gt 0$
. Given the same environmental policy shock that restricts emissions and reduces economic output, a governor with greater career incentives will choose to issue more debt to counteract the economic downturn. However, if the governor is benevolent, the decision to issue debt in response to the environmental shock will not be influenced by career incentives.
Hypothesis 2: If a governor is benevolent, debt issuance in response to an environmental shock is not influenced by career incentives. However, if the governor has career incentives, the risk of debt accumulation (future debt repayment) in response to environmental policy increases with the strength of career incentives.
Intuitively, A benevolent local governor determines the optimal debt level by equating the marginal social benefits of debt issuance, which comes from short-term GDP stabilization, and the marginal social costs, which come from a higher debt repayment in the future.Footnote 6 A politically incentivized local governor, in contrast, additionally considers the marginal private promotion benefits in the decision-making process, resulting in excessive debt accumulation facing the economic loss brought by the environmental policy.
4. Institutional background
4.1. The action plan on air pollution prevention and control
Rapid industrialization since the Reform and Opening-up has led to both unprecedented economic growth and environmental deterioration in China. In response to environmental challenges, China passed the Environmental Protection Law in 1989 and developed a multifaceted regulatory system.Footnote 7 However, air pollution concentration still reached a record high in 2013 due to lax enforcement (Greenstone et al. Reference Greenstone, He, Li and Zou2021).
To address the serious air pollution problem, the central government announced the Action Plan, a national air quality improvement project, in September 2013.Footnote
8
Similar to previous environmental policies, the Action Plan sets air quality goals for each province. In practice, provincial governments further break their allocated targets down to prefectures in their jurisdictions. Overall, the Action Plan required nationwide particular matter (
 $\mathrm{PM}_{2.5}$
and
 $\mathrm{PM}_{10}$
) concentrations to be reduced by more than 10% by the end of 2017, compared to 2012 levels.Footnote
9
Given the spatially differentiated nature of local economic conditions, such as industrial structure and energy reliance, there was wide variation in the tightness of the Action Plan across prefectures. We discuss how we measure “tightness” in Section 5.1.
In China, local officials are responsible for various aspects of local affairs. Since 2006, to receive a promotion, local officials have been required to meet environmental protection goals assigned by higher-level governmentsFootnote 10 and the weight of local environmental performance in the evaluation system keeps rising (Zhang and Xiong Reference Zhang and Xiong2020).Footnote 11 However, local economic growth still takes the first priority for local officials’ evaluation.Footnote 12 Therefore, local officials need to carefully balance economic growth and environmental protection under the Action Plan.
4.2. The local government financing vehicles (LGFVs)
Unlike in most western countries, China’s Budget Law imposes strict prohibitions on official local government debt, thereby constraining local governments’ capacity to promote economic growth at the local level. However, in response to the global financial crisis, the central government initiated a fiscal stimulus package valued at 4 trillion RMB in 2008, with only 1 trillion RMB came from the central government (Bai et al. Reference Bai, Hsieh and Song2016) and local governments assumed most of the debt burden.
To align with the provisions of the Budget Law, which prohibits local governments from incurring official on-balance-sheet debts, the China Banking and Insurance Regulatory Commission (CBIRC) and Ministry of Finance permit local governments to effectively issue off-balance-sheet debts by establishing local government financing vehicles (LGFVs) to fund stimulus spending (Bai et al. Reference Bai, Hsieh and Song2016; Chen et al. Reference Chen, He and Liu2020). Practically, LGFVs are registered simply as business entities, thereby excluding their debt from local governments’ balance sheets. Nonetheless, given that these LGFVs are endorsed by the local governments, their debt becomes de facto local government debt. Shown by the dashed line in Figure 1, LGFV debts expanded rapidly after 2009 and act as an important fiscal instrument for local governments.
5. Data, variable construction and empirical method
5.1. Treatment variable: Tightness of air pollution control under the action plan
In this section, we discuss how we measure prefecture-level regulation tightness under the Action Plan, which is used as the treatment variable in the regression presented in Section 5.4. In particular, this measure is intended to capture the potential burden imposed on the economy by the Action Plan.
At first glance, prefecture-specific targets to reduce
 $\mathrm{PM}_{2.5}$
concentration, if available,Footnote
13
appear to be good candidates for the tightness measure. However, we argue that this is not the best fit for our study for the following reasons. First, unlike pollution emissions,
 $\mathrm{PM}_{2.5}$
concentration measures ambient environmental qualities that are affected by not only local polluting activities but also pollutants transported from other locations by wind. Thus, a prefecture may have a high
 $\mathrm{PM}_{2.5}$
concentration and face a high concentration reduction target even if the prefecture itself has few polluting sources. In such a case, emission reductions in other prefectures of the province needs to be required to achieve the
 $\mathrm{PM}_{2.5}$
concentration reduction goal of this prefecture; therefore, the actual regulation tightness for this prefecture does not necessarily to be high.
Second, even if
 $\mathrm{PM}_{2.5}$
concentration can credibly reflect local polluting activities, the targets are not good measures of regulation tightness for our purposes. If a prefecture with a higher concentration reduction target is much less reliant on pollution- or energy-intensive industries than another prefecture with a lower target, the regulation tightness, or, in other words, the economic costs of the Action Plan, might be lower for the first prefecture compared to the second.
An ideal solution to the first problem above is to measure regulation tightness by
 $\mathrm{PM}_{2.5}$
generated or emitted by polluting sources in each prefecture, rather than
 $\mathrm{PM}_{2.5}$
concentrations. Unfortunately, we do not have access to this information; thus, we use information on the generation and emissions of
 $SO_{2}$
, a major precursor of
 $\mathrm{PM}_{2.5}$
(Baker et al. Reference Baker, Collins, Olivié, Cherian, Hodnebrog, Myhre and Quaas2015), as an alternative to construct the tightness measure.Footnote
14
To resolve the second problem, we incorporate a prefecture’s pollution reliance into the measurement of regulation tightness:
 \begin{equation} \textit{Tight}_{i}=\underset{\textit{abatement} \textit{intensity}}{\underbrace{\frac{SO_{2}~ \textit{abatement}_{i}}{GDP_{i}}}}|_{2012}=\underset{\textit{abatement~ ratio}}{\underbrace{\frac{SO_{2}~ \textit{abatement}_{i}}{SO_{2}~ \textit{generation}_{i}}}}|_{2012}\times \underset{SO_{2}\,\textit{generation} \textit{intensity}}{\underbrace{\frac{SO_{2}~ \textit{generation}_{i}}{GDP_{i}}}|_{2012},} \end{equation}
where
 $SO_{2}~ \textit{generation}_{i}$
is the amount of
 $SO_{2}$
generated by all polluting sources located in prefecture i. It is the sum of the amount of
 $SO_{2}$
ultimately emitted into the atmosphere (
 $SO_{2}~ \textit{emission}_{i}$
) and the portion that is abated by emission abatement technologies such as
 $SO_{2}$
scrubbers (
 $SO_{2}~ \textit{abatement}_{i}$
) before the waste gas goes into the atmosphere. All variables in equation (1) are measured at the pre-policy levels in 2012. Following Liu (Reference Liu2019), to eliminate the sensitivity of the choice of regulation tightness measures, we standardize
 $\textit{tight}_{i}$
to have mean 0 and standard deviation 1 for the ease of results interpretation.
Based on equation (1), regulation tightness is defined as prefecture-level
 $SO_{2}~$
abatement intensity in 2012, which can be decomposed to the product of the
 $SO_{2}$
abatement ratio and
 $SO_{2}~$
generation intensity. To mitigate the endogeneity issues, we employ individual-level characteristics prior to the Action Plan (i.e., in 2012) to measure regulation strength each individual unit face, which is widely adopted recently in the literature (Mian and Sufi, Reference Mian and Sufi2014; Giroud and Mueller, Reference Giroud and Mueller2019; Duval et al. Reference Duval, Hong and Timmer2020; Mao et al. Reference Mao, Wang and Yin2022). A higher pre-policy abatement ratio indicates that the prefecture had already abated a large share of emissions generated from fuel combustion before the policy took effect. Therefore, the cost associated with further increasing the abatement ratio is higher.Footnote
15
Furthermore, a higher
 $SO_{2}$
generation intensity implies that the local economy relies heavily on pollution-intensive industries, so emissions reduction for the economy is also likely to be tougher. Data required to calculate the toughness measure are drawn from the City Statistical Yearbook of China.
As shown in Figure 2, the geographic distribution of regulation tightness overlaps to some degree with that of the
 $\mathrm{PM}_{2.5}$
reduction targets set by the Action Plan. For example, the Beijing–Tianjin–Hebei area, which had the highest
 $\mathrm{PM}_{2.5}$
concentration prior to the Action Plan and was assigned the highest
 $\mathrm{PM}_{2.5}$
reduction targets, is also among the most tightly regulated areas, according to our tightness measure.
Geographic distribution of regulation tightness.
Notes: This figure plots geographic distribution of regulation tightness in 2012, prior to the implementation of the Action Plan, which is computed by equation (1) and captures the toughness of achieving
 $\mathrm{PM}_{2.5}$
reduction goal. The higher the intensity, the more toughness in a prefecture. There are 261 prefectures in the sample. The intensity is sorted in an ascending order, and then classified into 4 groups. The intensity increases from group 1 to group 4. There is no data if a prefecture is out of sample.

As shown in Figure 2, Yunnan, Sichuan, and Guizhou also had the most tightly regulated prefectures, although these provinces had low
 $\mathrm{PM}_{2.5}$
concentration reduction targets. In particular, Qujing (in Yunnan) and Guang’an (in Sichuan) faced significant challenges because they rely heavily on the secondary industry.
A final message from Figure 2 is that there exists sufficient heterogeneity in our tightness measure even for prefectures in the same province. As we will discuss in more detail in Section 5.4, this allows us to use within-province variations to identify the responses of local governments to the Action Plan, which alleviates potential province-level selection problems that may bias empirical estimation. This is an additional benefit of using our tightness measure in lieu of the
 $\mathrm{PM}_{2.5}$
concentration reduction targets, which are province-specific rather than prefecture-specific.
5.2. LGFV debts
We follow the method in Bai et al. (Reference Bai, Hsieh and Song2016) and Huang et al. (Reference Huang, Pagano and Panizza2020) to estimate the total financial liabilities and categories of LGFVs from their disclosed balance sheets that are required by bond issuance procedure. Consistent with Bai et al. (Reference Bai, Hsieh and Song2016) and Huang et al. (Reference Huang, Pagano and Panizza2020), all LGFV balance sheets were drawn from Wind Information Co. (WIND), which is the Chinese version of Bloomberg and the leading vendor of financial and economic data in China.Footnote 16 The sample covers all firms that issued MCBs from 2011 to 2017, which accounts for a majority of all LGFVs in the country.Footnote 17
The information used to construct the LGFV debt-related variables in this study include LGFV firm identity, location, total debts, and “other payables” in each year. In particular, total LGFV debts include stock of bank loans, payable bonds, obligations to goods and services suppliers, and lending from affiliated firms. Facing different lending standards and regulations, these sub-items feature different risk levels. Based on the degree of transparency and embedded risk levels, we divide them into two categories: “other payables” and “non-other payables.” Other payables mainly comprise less transparent debts from affiliated or connected firms, which require lower lending standards, regulations, and (even undetermined) maturity but higher interest rates.Footnote 18 Although this type of debt relieves the financial constraints of LGFVs (i.e., more flexible) to some extent, a higher risk in the future is imposed in exchange. Finally, we define “non-other payables” as the difference between total debts and other payables, including debt items such as bank loans and MCBs that are subject to stricter regulations and lower risks.
We aggregate the outstanding total debts and outstanding other payables of all LGFVs within each prefecture by the end of each fiscal year to get prefecture-level total LGFV debts and other payables.Footnote 19
5.3. Other prefecture-level characteristics and summary statistics
In our mechanism analysis, we additionally supplement our main dataset with prefecture-level land sales data. We use parcel-level land transaction data collected from the website of China’s Ministry of National Land and Resources to construct these variables.Footnote 20 In particular, the following information is used: land transaction date, address, buyer identity, buyer’s two-digital industry code, and sales revenue.Footnote 21 As discussed in Appendix B1, local governments categorize urban land to its usage purpose: residential, commercial or industrial. Industrial land sales only account for a small share of land sale revenue and can be supplied for other reasons, such as structural adjustment, job creation, and local tax revenue. To mitigate the influence of non-financing considerations, we only consider commercial and residential land sales conducted for financing purposes.
A key variable in our heterogeneity analysis is the strength of local officials’ political promotion incentive. We manually collected prefect-level party secretary information from 2011 to 2017, including name, age, and position starting date of the party secretary of each city for each year. The key variable is position starting date, based on which we construct a variable to capture local officials’ incentive to promote the local economy for career promotion.Footnote 22 The construction method is detailed in Section 6.4. Other prefecture-level information, such as GDP, revenue of industrial firms, tax revenue from industrial firms, total local government tax revenue, total population, and miles of paved road, are collected from the City Statistical Yearbook of China.
To make data comparable across prefectures, we exclude the data from Beijing, Shanghai, Tianjin and Chongqing, four province-level prefectures in China. We also drop prefectures in Xinjiang, Qinghai, Hainan, and Tibet from the sample since the prefectures with non-missing data is too few to generate enough variation within corresponding province.Footnote
23
Thus, the number of prefectures reduces from 336 to 301. Additionally, 40 prefectures did not report
 $\mathrm{SO}_{2}$
abatement in 2012, so the final sample covers 261 prefectures in total. To minimize the impact of outliers in our study, we winsorize all variables at the 2.5% and 97.5% levels.Footnote
24
Table 1 shows the summary statistics for the sampling period from 2011 to 2017. Around 80% of all observations are located within one standard deviation of the tightness of air pollution control. Approximately 57% of all observations are from 2014 to 2017 (i.e., post-Action Plan).
Summary statistics

Notes: This table reports summary statistics in this study. Tight is the
 $\mathrm{SO}_{2}$
abatement intensity of each prefecture in 2012, which is computed by equation (1) and standardized to have mean 0 and standard deviation 1. The dummy variable “Post2013” equals 1 if year >2013 and 0 otherwise. “pdebt1113” is the ratio of LGFV debts to GDP, averaged from 2011 to 2013, which is standardized to have mean 0 and standard deviation 1. The dummy variable “HighIn” equals 1 if a party secretary is in the 2nd–4th (or 5th–8th) year of the current position, i.e., having high promotion urgency, in a given year in a given prefecture and 0 otherwise (Guo, Reference Guo2009). Total LGFV debts and other payables are aggregated from the outstanding total debt and outstanding other payables of all LGFVs within each prefecture by the end of each fiscal year, respectively. LGFV non-other payables is the difference between total debt and other payables. Monetary units are all discounted to 2010 price level. Revenue of industrial firms, GDP, tax revenue from industrial firms, total local government tax revenue, total population, nonagricultural population, and miles of paved road, are collected from the City Statistical Yearbook of China. Firm-level LGFV debt data were drawn from WIND.
5.4. Empirical model
We adopt the standard difference-in-difference (DID) framework to identify local government responses to the Action Plan.Footnote 25 The baseline regression model is shown in equation (2):
 \begin{equation} \mathit{\log } \left(y_{ijt}\right)=\beta _{0}+\beta _{1}\textit{Tight}_{i}\times Post2013_{t}+X_{it}^{'}\alpha +\delta _{i}+\tau _{jt}+\varepsilon _{ijt}, \end{equation}
where
 $y_{ijt}$
is a list of (logged) outcome variable of prefecture
 $i$
in province
 $j$
and year
 $t$
including total LGFV debts, ratio of non-other payable debt in total LGFV debts, the amount of non-other payable debts, and the amount of other payable debts. In the mechanism analysis in Section 6.3,
 $y_{ijt}$
is replaced by local industrial revenue, GDP, taxation, and land sale income.
 $\textit{Tight}_{i}$
, as defined in Section 5.1, is a continuous variable that measures treatment intensity, or, alternatively, the tightness of the Action Plan, facing prefecture
 $i$
.
 $Post2013_{t}$
is a dummy variable that equals 1 if
 $t\gt 2013$
, and 0 otherwise.
 $\beta _{1}$
is the parameter of interest, which measures the relative change in outcome variables due to the implementation of the Action Plan for prefectures facing higher treatment intensity compared to those facing lower treatment intensity. LGFV debts are possibly higher in areas with faster urbanization and economic development, where the tightness of the action plan may also be high due to the potential reliance on the dirty industry for the fast development. To control for this confounding effect, we include in
 ${X}_{it}^{'}$
prefecture-level lagged total population (in log) and lagged miles of paved road (in log), control variables that are highly correlated with urbanization and economic development. The error terms
 $\varepsilon _{ijt}$
are clustered at province-by-year level to account for potential correlations in the error structure.Footnote
26
 $\delta _{i}$
is a series of prefecture fixed effects that control for the time-invariant determinants of the outcome variables.
One might argue that prefectures in the same province may share similar unobservable socioeconomic and natural conditions that simultaneously influence the outcome variables and regulation tightness, making treatment assignment endogenous. Fortunately, by construction,
 $\textit{Tight}_{i}$
varies across prefectures in the same province. Therefore, we include in the regression
 $\tau _{jt}$
, a vector of province-by-year fixed effects that the impact of any time-varying concurrent policies that happen at province level, shielding our treatment effect estimation from being contaminated by these confounding policies. In other words, we are essentially utilizing within-province prefecture-level variations in treatment intensity to identify the effects of the Action Plan on the outcome variables, which allow us to eliminate the possible province-level treatment selection problem.Footnote
27
The inclusion of
 $\tau _{jt}$
also teases out potential confounding effects from province-level concurrent policies, such as the establishment of carbon pilots in seven provinces in 2012. In Section 6.2, we provide further evidence that that prefecture-level selection may not be a serious concern that biases our treatment effect estimation. In that section, we also try our best to directly control for potential prefecture-level sample selection issue by including the interaction between a series of pre-policy control variables and a flexible function of time as additional regressors, following Gentzkow (Reference Gentzkow2006), Chen et al. (Reference Chen, Li and Lu2018) and Gollin et al. (Reference Gollin, Hansen and Wingender2021). It turns out that the regression results remain largely unchanged.
6. Results and discussions
In this section, we first present the main results of the DID estimation, followed by a series of robustness checks. The DID results document how local governments responded to strictly enforced environmental regulations by adjusting LGFV debts under the pressure of economic stabilization (Hypothesis 1). We then conduct heterogeneity analyses to show how local officials’ promotion incentives affect their debt adjustment behaviors (Hypothesis 2) and talk about potential welfare impacts.
6.1. Local government responses: LGFV debts
Table 2 reports the effects of the Action Plan on local governments’ LGFV debts adjustment behaviors. The specifications alternate based on whether control variables are included in the regressions. It turns out that the estimated treatment effects are largely robust to the inclusion of these control variables. On average, as shown by Column (2) of Table 2, a one-standard-deviation increases in treatment intensity increased LGFV debts by approximately 5%.
Effects of the action plan on local local government financing vehicle (LGFV) debts
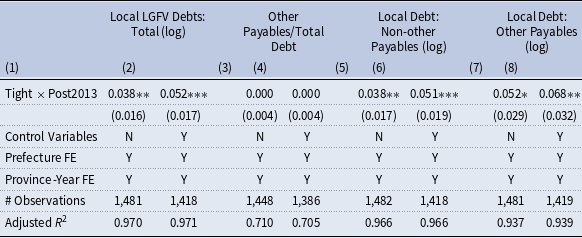
Notes: This table reports the estimated effects of the Action Plan on local LGFV debts and by debt source. We divide LGFV debts into two categories: i. non-other payable debts that includes municipal construction bonds, bank loans and other debts that are under strict supervision (Column (5) and (6)), and ii. other payables including firm-to-firm debts and other debts that are subject to looser supervision and are riskier (Column (7) and (8)). The results for the share of other payables in total LGFV debts is also reported in the Column (3) and (4). Control variables include lagged total population in log and lagged miles of paved road in log. Standard errors clustered at prefecture-by-year level are reported in parentheses. *** Significant at 1% level, ** significant at 5% level, and * significant at 10% level.
The existence of LGFVs helps explain why China has been experiencing a smooth transition toward a green economy. From this perspective, debt can act as a “economic buffer” when environmental regulations are becoming more stringent or greenhouse gas reduction policies are enacted to combat climate change in the future. This is exactly the short run benefits of debt in the theoretical model.
However, the potential adverse consequence of issuing LGFV debts to stabilize the contemporaneous economy under the pressure of environmental regulation cannot be ignored. In particular, LGFV debt expansion and the overall GDP decline across tightly regulated areas together added to the risk of the economy, such as higher debt repayment in the future and the crowding out of private firms’ investment, threatening long-term economic stability. To further investigate the structure of LGFV debt increase, we classify LGFV debts into two broad categories: less-risky “non-other payable debts” and riskier “other payable debts.”Footnote 28 The estimation results in the second panel of Table 2 indicate that the Action Plan had little impact on the share of other payable debts in total LGFV debts. Therefore, both non-other payable debts and other payable debts increased following the implementation of the Action Plan (i.e., the third and fourth panels of Table 2), and the regulation did not shift LGFV debt structure on average.
The results from this DID regression are consistent with Hypothesis 1 that local governors tend to issue more debts to mitigate the economic slowdown (shown in Section 6.3) caused by strict environmental policies, but we cannot distinguish whether they are benevolent or have private career incentives simply from the DID results. Benevolent local governments should optimize their use of LGFV debts by equalizing the marginal social benefits (i.e., GDP stabilization) and marginal social costs (i.e., debt repayment) of increasing these debts. However, as will be shown later in Section 6.4, under certain economic and political conditions, local officials might have deviated from a social planner’s optimization path, which would have exacerbated the risk associated with issuing LGFV debts.
6.2. Identification validity & robustness checks
6.2.1. Formal test of the parallel trend assumption & controlling for possible selection
As discussed in Section 5, the province-by-year fixed effects eliminate any province-level treatment intensity selection problem that might bias the estimate of
 $\beta _{1}$
. However, it is still possible that, within the same province, prefectures with tighter regulations are systematically different from those with looser regulations. For example, one prefecture might be more reliant on pollution-intensive industries due to greater natural resource endowment (e.g., close to a large coal mine) compared to their counterparts in the same province. If the growth patterns of resource-reliant industries differ from those of other industries even in the absence of the Action Plan, the estimate of
 $\beta _{1}$
might also be biased. Following the literature, we use two different methods to address this concern.
First, if prefectures with different regulation tightness do not differ systematically from each other, the outcome variables of prefectures with high and low treatment intensity levels should follow the same time trend prior to policy implementation. Using 2013 as the benchmark year (i.e., one year before the Action Plan took effect), we formally test the parallel trend assumption with the following even-study regression design (Jacobson et al. Reference Jacobson, LaLonde and Sullivan1993):
 \begin{equation} \mathit{\log } \left(y_{ijt}\right)=\beta _{0}+\sum _{k=2011,k\neq 2013}^{2017}\beta _{k}\textit{Tight}_{i}\times Year_{k}+{X}_{it}^{'}\alpha +\delta _{i}+\tau _{jt}+\varepsilon _{ijt}, \end{equation}
where
 $Year_{k}$
is a dummy variable indicating year
 $k$
between 2011 and 2017. Note that
 $k$
= 2013 is excluded because it is the benchmark year.
 $\beta _{k}$
s for
 $k\in \{2011,2012\}$
are the parameters of interest that are represents the difference in outcome variables between the more-tightly and less-tightly regulated prefectures in each year, relative to that in 2013, one year before the policy took effect. We expect these two coefficients to be statistically indifferent from 0, implying that the difference in trends of the outcome variables between the two groups of prefectures does not change over-time prior to policy implementation, which supports the parallel trends assumption and indicates that the likelihood of prefecture-level selection is small conditioning on the fixed effects and control variables included in the regression.
The point estimates of
 $\beta _{k}$
s for the main outcome variables and the associated 95% confidence intervals are plotted in Figure 3. It turns out that
 $\beta _{2011}$
and
 $\beta _{2012}$
are not significantly different from zero and remain stable in magnitude for all dependent variables, suggesting a parallel trend in these variables among prefectures with different treatment intensity levels prior to the Action Plan implementation. The results indicate that prefecture-level selection may not be a serious concern, and the DID estimates shown in Table 2 are largely unbiased.
Results of the parallel trends test.
Note: This figure plots the results of the parallel trends test corresponding to equation (3) for key dependent variables: logged total local government financing vehicle (LGFV) debts and the share of non-other payable debts in the total LGFV debts. The omitted base year of the test is 2013. The test is conditional on prefecture fixed effects, province-by-year fixed effects, lagged prefecture level population in log and lagged miles of paved road in log.

Another way to address this concern is to directly correct for potential differentiated pre-trends, following Gentzkow (Reference Gentzkow2006), Chen et al. (Reference Chen, Li and Lu2018) and Gollin et al. (Reference Gollin, Hansen and Wingender2021). Specifically, we add to the baseline regression an interaction term between a third-order polynomial of time and the pre-policy variables that might be correlated with the differentiated pre-trends, which flexibly controls for possibly differentiated trends in the outcome variables to isolate the treatment effect. In particular, we add
 $z_{ipre}\times f(t)$
into the regressions, where
 $z_{ipre}$
includes prefecture-level pre-policy outcome variables and the fraction of employment by the secondary industry measured in 2013. Chen et al. (Reference Chen, Li and Lu2018) argued that characteristics of the natural environment, such as terrain roughness, elevation, wind speed, temperature and precipitation, affect the concentration of pollutions and are often considered by the central government when setting local environment improvement targets. Since these factors may also be correlated with local economic development and thus, the issuance of LGFV debts; therefore, we also include the pre-policy levels of these variables in
 $z_{ipre}$
to capture their potential impacts on city-level trends of LGFV debts. Regression results are reported in Panel B of Appendix Table C1. The estimated treatment effects are similar to those obtained without controlling for
 $z_{ipre}\times f(t)$
. This is unsurprising because, as shown in Figure 3, the parallel pre-trend assumption holds for these outcome variables.
6.2.2. Teasing out the effects of confounding policies
a) Dropping observations in 2016 and 2017 from the sample
Prefecture expansion and economic development are often planned in five-year increments in China. Notably, the emphasis of different “Five-Year Plans” (hereafter, “FYP”) for the same prefecture can vary. The Action Plan was implemented from 2014 to 2017, spanning the 13rd (2011–2015) and 14th (2016–2020) FYP. It is possible that the differentiated changes in the outcome variables after 2015 for prefectures with different treatment intensity levels were partly driven by differentiated changes in development goals specified in the 14th FYP. If this is true, our estimated treatment effects would be biased.
Therefore, in another robustness check, we remove observations in 2016 and 2017 to tease out potential confounding effects of the 14th FYP. The estimated coefficients reported in Panel C of Appendix Table C1 remain largely unchanged compared to the results reported earlier in Table 2.
b) Dropping prefectures in metropolitan areas from the sample
China has three large national-level metropolitan areas: the Shanghai Metropolitan Area, the Beijing–Tianjin–Hebei Metropolitan Area, and the Guangzhou–Hongkong–Macau Metropolitan Area, whose air pollution reduction targets are much higher than the rest of prefectures. Moreover, prefectures in these metropolitan areas enjoy more support from the central government and may show different trends in local government debt and the outcome variables compared with other prefectures. To mitigate the issues about confounding factors and test whether our results are robust to the inclusion of these prefectures, we drop them from the regressions in another robustness check, and the estimation results are reported in Panel D of Appendix Table C1. Again, the estimated coefficients remain largely unchanged, possibly because the province-by-year fixed effects already capture a large fraction of such differentiated trends.
c) Dropping prefectures in provinces with pilot carbon cap-and-trade markets
Another confounding policy during this period is the establishment of pilot carbon cap and trade markets in seven provinces and cities in 2013.Footnote 29 Since all prefectures in these provinces are subject to the pilot market regulation, the inclusion of province-by-year fixed effects have already teased out the average treatment effects of this confounding policy, as discussed earlier in Section 5.4. To the extent that prefectures in the same province are affected differently by the pilot market and that the difference might be correlated with LGFV debt issuance, we drop the prefectures in these provinces from the analysis and re-run the regressions. The signs and statistical significance of the estimation results reported in Panel E of Appendix Table C1 are robust to the removal of these prefectures.
d) The No. 43 document
The State Council issued the No. 43 Document in the end of 2014 and initiated a debt swap program in 2015 to curb local government debt by swapping some LGFV debts for local government bonds. If the debt swap program in 2015 changed the stock of LGFV debts differently for prefectures with different pre-2014 SO2 abatement intensity, our estimated effects of the Action Plan on LGFV debt issuance will be contaminated.
To tease out this possibility, we collect the amount of LGFV debts replaced by local government bond at the province level in 2015, 2016, and 2017.Footnote 30 We then regress the replacement amount on a set of year fixed effects. The residuals from this regression capture the variations in province-level LGFV debt issuance on top of the common annual shocks. We then plot the province-level residuals against the province-level tightness measures in Figure 4. Clearly, they are uncorrelated: the fitted regression line is almost horizontal with insignificant slope coefficient. Hence, our observed difference in LGFV debt change for prefectures with high and low treatment intensities is unlikely to be affected by the No. 43 Document.
Correlation between province-level regulation tightness and (residual) amount of debt swapped.
Notes: the vertical axis of this figure represents the standardized province-level regulation tightness measure. The horizontal axis represents the residual from regression log of provincial debt swap from 2015 to 2017 on year dummies.

Besides, the No. 43 document states that the list of eligible LGFVs are determined according to the audit of government debt in 2013,Footnote 31 and the number of eligible LGFVs is only 325 by the end of 2013. Although CBIRC updated its list in 2014, there were only 66 more eligible LGFVs by the end of 2014. In other words, the debts of at least 7,526 LGFVs are irrelevant to the debt swap program in 2015. As shown by the first confounding policy analysis in this section, the signs and significance levels of the estimated treatment effects remain largely unchanged even if we drop observations in 2016 and 2017.
6.2.3. Experimenting with alternative definitions of regulation tightness
In our main analysis, we define regulation tightness as a prefecture’s SO2 abatement intensity in 2012 (i.e., amount of SO2 removed divided by GDP). Although this tightness measure is easy to interpret, it does not consider differentiated regional PM2.5 concentration reduction targets. The reduction targets are higher in the Beijing-Tianjin-Hebei, Yangtze River Delta, and Pearl River Delta regions than in other areas. To test whether the previous results are driven by the differentiated targets, we re-estimate the main regressions using an alternative regulation toughness measure, defined as follows:
 \begin{equation} \textit{Tight}_{i}=\frac{SO_{2}\textit{abatement}in2012}{GDPin2012}\times \left(1+\textit{target}_{ip}\right), \end{equation}
where
 $\textit{target}_{ip}$
is the emission concentration reduction target of province p where prefecture i belongs set by the Action Plan.
The estimation results are reported in Appendix Table C2. Reassuringly, our estimated treatment effects remain robust for this alternative definition of treatment intensity. This is also unsurprising for two reasons. First, the geographic distribution of regulation tightness measured by SO2 abatement intensity already overlaps with that of the
 $\mathrm{PM}_{2.5}$
concentration reduction targets set by the Action Plan to a certain degree. Second, the number of prefectures in the three key regions above is only a moderate fraction of the full set of prefectures in our sample. We stick to our initial regulation tightness definition in the main analyses for two reasons. First, the initial definition has a clear interpretation, i.e., the abatement intensity. Second, as reduction target information is only available at province level, and assuming that prefectures in the same province face the same reduction target is a bit strong.
6.3. Mechanisms: Shocks to economic growth and government income
This section explores why local governments increase their LGFV debts in response to the Action Plan. Parallel trend test results for variables that show up in this section can be found in Figure C1 in Appendix C.
The industrial sector is the major source of air pollution; thus, the implementation of the Action Plan imposed significant downward pressure on its business growth. Column (1) of Table 3 shows the estimated treatment effect of the Action Plan on industrial revenue without any control variables, while the coefficients shown in Column (2) are obtained after conditioning on a series of prefecture-level control variables. Both specifications include prefecture fixed effects and province-by-year fixed effects. The estimated coefficients are negative and significant in both columns. On average, our preferred specification in Column (2) indicates that a one standard deviation increase in treatment intensity decreased local industrial revenue by 2.3%.
Effects of the action plan on local industrial revenue and GDP

Notes: This table reports the estimated effects of the Action Plan on local industrial sector’s revenue (left panel) and local GDP (right panel). Control variables include lagged total population in log and lagged miles of paved road in log. Standard errors clustered at prefecture-by-year level are reported in parentheses. *** Significant at 1% level, ** significant at 5% level, and * significant at 10% level.
The industrial sector constitutes a large share of China’s economy; thus, slowdown in industrial expansion in the tightly regulated prefectures threatened local GDP growth. The right panel of Table 3 shows the estimated treatment effects on local GDP. Similarly, the regression results without and with control variables are shown in Columns (3) and (4), respectively. On average, a one standard deviation increase in treatment intensity decreased local GDP by 1.4%, and the effect is statistically significant. Notably, the magnitude of GDP decline caused by the Action Plan is comparable to that caused by various financial shocks, monetary policy shocks, and technology shocks documented in the macroeconomics literature (Christiano et al. Reference Christiano, Eichenbaum and Evans1999; Galí and Rabanal, Reference Galí and Rabanal2004; Jermann and Quadrini, Reference Jermann and Quadrini2012).
The major obstacle to enacting and enforcing strict environmental regulations is the threat to economic growth, and China is no exception. The central government evaluates local officials in China for career promotions based on several criteria, among which GDP growth during their tenure is an important consideration (Li and Zhou, Reference Li and Zhou2005). Facing binding environmental regulation and possible economic slowdown, local officials are strongly incentivized to stabilize GDP with available fiscal policy instruments. However, a decline in industrial revenue reduces tax income, which limits government spending. As shown by the first four columns in Table 4, a one-standard-deviation increase in treatment intensity decreased tax revenue collected from the local industrial sector by 3.4%, creating a 1.7% reduction in total local government tax revenue.Footnote 32
Effects of the action plan on local income

Notes: This table reports the estimated effects of the Action Plan on tax collected from the local industrial sector (left panel), local government tax (middle panel), and land sale revenue (right panel). Control variables include lagged total population in log and lagged miles of paved road in log. Standard errors clustered at prefecture-by-year level are reported in parentheses. *** Significant at 1% level, ** significant at 5% level, and * significant at 10% level.
Besides tax revenue, land financing also represents a major source of government income.Footnote 33 Perhaps surprisingly, despite the income pressure brought thy the Action Plan, the estimation results shown in the last two columns of Table 4 indicate that the policy did not affect land sale revenue of local governments that are widely deemed as monopolists in the local residential land market (Wang et al. Reference Wang, Zhang and Zhou2020). Possibly, although the improvement in air quality due to the Action Plan implementation might have increased housing demand to some extent, the associated decrease in local income (i.e., GDP) dragged demand back, which limited the ability of local governments to further raise funds from selling land. Therefore, local governments turned to LGFV debts considering the shrink of the sum of tax revenue and land sale revenue.
6.4. Heterogeneity analysis – The role of career incentive and path dependence
The empirical results reported above indicate that Chinese local governments tend to use LGFV debts as short-term remedies for economic downturns related to environmental policies. However, our results in this section also indicate that the costs of issuing debt may not be ignored under certain circumstances.
As discussed in Section 3.2, if local officials are “benevolent social planners,” they should choose an optimal debt amount that equalizes the marginal social benefits and marginal social costs of debt expansion, wherein the benefits come from GDP stabilization and the costs come from accumulating debt risk. Unfortunately, local officials’ incentives may not align perfectly with those of a social planner. When this happens, the debt issuance behavior may deviate from the optimality and the costs of environmental policies might increase. In this section, we discuss potential scenarios in which such an incentive “misalignment” might emerge.
A. Local officials’ promotion incentives
Theoretical macro-political models indicate that debt over-accumulation is more likely to emerge in economies with present-biased governments (Alesina and Tabellini, Reference Alesina and Tabellini1990; Yared, Reference Yared2019). In top-down bureaucratic systems, local officials differ from utopian social planners because they face pressure to receive promotions. In the particular context of China, Guo (Reference Guo2009) documented that, under a GDP tournament, local officials are inclined to increase government expenditure when the central government will soon evaluate their performance to determine whether they will be granted a promotion.
When this happens, the objective of local officials deviates from that of a benevolent social planner. There is an additional marginal private benefit of issuing debt to gain a promotion on top of the marginal social benefits of debt expansion; thus, party secretaries tend to over-issue LGFV debts to compensate for short-run economic downturn related to environmental policies. We use the following difference-in-difference-in-differences (DDD) framework to test this hypothesis:
 \begin{equation} \begin{split}\mathit{\log } \left(y_{ijt}\right)&=\beta _{0}+\beta _{1}\textit{Tight}_{i}\times Post2013_{t}+\beta _{2}\textit{treat}_{i}\times Post2013_{t}\times \textit{HighIn}_{it}+\beta _{3}treat_{i}\times \textit{HighIn}_{it}\\&\quad+\beta _{4}Post2013_{t}\times \textit{HighIn}_{it}+{X}_{it}^{'}\alpha +\delta _{i}+\tau _{jt}+\varepsilon _{ijt}, \end{split}\end{equation}
where
 $\textit{Tight}_{i}$
,
 $Post2013_{t}$
,
 $\boldsymbol{X}_{\boldsymbol{it}}^{\mathrm{'}}$
,
 $\delta _{i}$
,
 $\tau _{jt}$
and
 $\varepsilon _{ijt}$
are defined the same as in equation (2).
 $\textit{HighIn}_{it}$
is a dummy variable that equals 1 if the promotion urgency of the local party secretary in prefecture i and year t was high, and 0 otherwise.Footnote
34
 $\beta _{2}$
is the coefficient of interest that captures the difference between the treatment effects for prefectures with more urgent secretaries and those with less urgent ones.
According to the Article 26 of the Party Constitution, prefecture-level party secretaries serve five-year terms. A secretary can also be reelected for another five-year term after completing the previous one. In China, a typical method that local officials use to stimulate the local economy is to fund large development projects (Guo, Reference Guo2009). Guo (Reference Guo2009) posited that local officials are less likely to engage in such activities during the first few years of their tenure because these projects are often too costly and unsustainable. However, they become increasingly incentivized to do so when they are approaching the end of their five-year term and will soon be evaluated for a promotion. Using a panel dataset of local officials and local government spending, Guo (Reference Guo2009) empirically demonstrated that local officials tend to significantly increase government budgets starting in the third year of their term.
Based on Guo’s (Reference Guo2009) findings, we consider a local party secretary to have high promotion urgency during the third to fifth years of a five-year tenure. Since party secretaries can at most stay in the same position for two tenure periods (i.e., 10 years), we set
 $\textit{HighIn}_{it}=1$
if the secretary has been in the current position for either 3–5 years or 8–10 years (i.e., the third to fifth years of a second tenure).
The estimation results are shown in Table 5. In particular, the coefficient of the DDD term in Column (3) indicates that prefectures with party secretaries under higher promotion urgency saw a larger increase in LGFV debts financed by “other payables” sources following the Action Plan implementation. Party secretaries are usually well-connected to firms in their former and current jurisdictions (Fan et al. Reference Fan, Wong and Zhang2007; Schweizer et al. Reference Schweizer, Walker and Zhang2019). Therefore, “other payables” is a convenient financing channel for highly incentivized secretaries to further increase LGFV debts, since they often borrow from the affiliated firms who require lower lending standards and exert fewer regulations, especially on borrowers with implicit government guarantees. However, this difference did not appear for non-payable debts, as shown in Column (4). As documented in the literature (Chen et al. Reference Chen, He and Liu2020), credit rating agencies in China have rapidly developed since 2012, thereby making bond information more transparent. Hence, the capacity of local governments to issue MCBs through LGFVs is limited when local officials who issue bonds are likely to be promoted or transferred to other positions and the possibility of bond default is high.
Heterogeneous effects of the action plan by local party secretaries’ terms of office

Notes: This table reports the results of the heterogeneous effect of the Action Plan on local GDP (Column(1)) and local governments responses by using off-budget tools (Column(2) to (4)) when the incentives of local party secretary are different. The incentive to promote local economy is captured the term of office for the secretary hold (Guo, Reference Guo2009). Thus, the dummy “HighIn” equals 1 if a secretary is in the 3nd–5th (or 8th–10th) year of the current position, i.e., having high promotion urgency, in a given year in a given prefecture and 0 otherwise. For the sake of brevity, we do not report estimated effects of local government tax income, industrial firms’ revenue and tax, and land sale revenue in this table. Control variables include lagged total population in log and lagged miles of paved road in log. Standard errors clustered at prefecture-by-year level are reported in parentheses. *** Significant at 1% level, ** significant at 5% level, and * significant at 10% level.
These findings are consistent with Hypothesis 2 in Section 3.2 that the risk of debt accumulation increases with local governors have private career incentives because the higher interest rates on other payable debts would lead to a greater repayment burden. Governors with career incentives would like to choose the debt level that equalizes the sum marginal social benefits (GDP stabilization) and marginal private benefits (career promotion) with marginal social costs (debt repayment). Therefore, higher debt issued by governors motivated by career incentives, compared to that issued by benevolent governors, is likely to result in social welfare loss. In addition, although the increase in other payable debts eased the decline in GDP growth to some extent (Column (1) of Table 5),Footnote 35 the accumulated risk also increased by a larger extent compared to other prefectures with the same regulation tightness because other payable debts are often riskier than non-payable debts (see Section 5.2).Footnote 36
B. Path-dependence of LGFV debts
As discussed in Section 3.2, LGFV debts have expanded since 2009, and the consequential increase in debt varies across regions. Although LGFVs function as normal firms in financial markets, financial intermediaries would still consider the accountability of their ultimate controllers (i.e., local governments). A higher ratio of LGFV debts to local GDP implies the local government has a larger comprehensive debt burden, which weakens their accountability. To make matters worse, this mechanism will be amplified during recessions due to various financial frictions (Bernanke et al. Reference Bernanke, Gertler and Gilchrist1999; Greenstone et al. Reference Greenstone, Mas and Nguyen2020).
When promoting the economy is still a central task of local governments, the decline in LGFV financing capabilities may incentivize governments to finance more through riskier LGFV debt sources since their lending standards are lower. Therefore, the cost of this additional flexibility increases when prefectures already have a high debt risk, and local government responses may eventually decrease the cost-effectiveness of environmental policies.
To test this hypothesis, we also employ a DDD framework and use historical local LGFV debt levels to measure local governments’ off-budget debt burden prior to the implementation of the Action Plan:
 \begin{equation} \begin{split}\mathit{\log } \left(y_{ijt}\right)&=\beta _{0}+\beta _{1}\textit{Tight}_{i}\times Post2013_{t}+\beta _{2}\textit{treat}_{i}\times Post2013_{t}\times \textit{pdebt}_{i,1113}\\ &\quad+\beta _{3}treat_{i}\times \textit{pdebt}_{i,1113}+\beta _{4}Post2013_{t}\times \textit{pdebt}_{i,1113}+{X}_{it}^{'}\alpha +\delta _{i}+\tau _{jt}+\varepsilon _{ijt}, \end{split}\end{equation}
where local LGFV debts are divided by average local GDP to make it comparable across prefectures. Moreover, we compute the average debt to GDP ratio from 2011 to 2013 within each prefecture,
 $\textit{pdebt}_{i,1113}$
, to mitigate the influence of outliers in a certain year. We call this constructed variable “historical LGFV debt risk.”
Table 6 reports the estimation results of a DDD regression of equation (6). As shown by Columns (3) and (4), local governments with higher historical LGFV debt risk borrowed less via less risky “non-other payables” sources that typically require higher credit rating. This is consistent with Adelino et al. (Reference Adelino, Cunha and Ferreira2017) that financial distress weakens local governments’ capacity of financing through banks and bond markets when economic shocks are coming. Consequently, they turned to riskier “other payables” that requires lower lending standards and subject to looser supervision, but has higher interest rate. These two forces combined makes the effects of the Action Plan on local GDP comparable for prefectures with different levels of historical LGFV debt risk (Column (1) of Table 6). However, the increased risk due to the change in LGFV debt structure cannot be ignored. The finding on the heterogeneous effects is also consistent with the argument that excessive use of LGFV debts prior to the Action Plan had weakened local government ability to remedy economic loss brought by the Action Plan at a lower risk (cost). A general lesson from this exercise is that the path dependence of local economies on LGFV debts might have increased the social costs of various environmental policies.
Heterogeneous effects of the action plan by pre-policy local government financing vehicles (LGFVs) debt risk

Notes: This table reports the results of the heterogeneous effect of the Action Plan on local GDP (Column(1)) and local governments responses by using off-budget tools (Column(2) to (4)) under different average level of LGFVs debt. In particular,
 $\text{pdeb}\mathrm{t}_{1113}$
is the average ratio of LGFV debts to local GDP from 2011 to 2013. To make it comparable across prefectures, we have standardized
 $\text{pdeb}\mathrm{t}_{1113}$
with mean 0 and standard deviation 1. For the sake of brevity, we do not report estimated effects of local government tax income, industrial firms’ revenue and tax, and land sale revenue in this table. Control variables include lagged total population in log and lagged miles of paved road in log. Standard errors clustered at prefecture-by-year level are reported in parentheses. *** Significant at 1% level, ** significant at 5% level, and * significant at 10% level.
6.5. Further discussions and extensions
The main goal of the paper is to understand whether and how environmental regulations contribute to the salient problem of debt over-accumulation in major economies. However, it is also helpful to think about whether governments use other policy instrument cooperatively to mitigate debt risk and achieve policy synergy. We discuss a potential mitigation policy below, though there might be many other important channels that we do not discuss here.
In the specific context of China, it is common for local governments to use industrial land allocation to foster future income sources with the construction of new plants, which mitigates debt risk in the long run. However, as we discuss in detail in Table B1 of Appendix B2, we do not find that the Action Plan altered local governments’ land allocation behavior, possibly because land allocation is relatively rigid from the aspect of local governments. Therefore, we do not pursue along this line too much in our main text. One can refer to Appendix B2 for the empirical results and a full discussion.
We do find in Table B2 of Appendix B2 that, however, the effects vary across regions with different socioeconomic conditions. For example, land allocation to polluting industries significantly reduced but that to nonpolluting industries did not increase in prefectures with officials under higher promotion incentives, which further increases debt risk. On the other hand, prefectures with higher historical debt risks engaged in industrial structure transition after the Action Plan by allocating a larger share of land to nonpolluting industries, which mitigates debt risks. Hence, future studies may incorporate industrial land allocation as a potential debt risk mitigation channel into a calibrated macroeconomic model when quantifying the welfare effects of environmental regulations that originates from unsupervised fiscal flexibility, especially under differentiated political incentives and socioeconomic conditions.
7. Conclusions
In recent years, environmental protection has been placed on a global agenda, especially as the devastating effects of climate change become increasingly evident. Under heated discussions about the risk of climate change (Brunnermeier and Landau, Reference Brunnermeier and Landau2020; Schnabel, Reference Schnabel2021), environmental regulations are expected to become stronger in the future. However, the main challenge of strict environmental regulations is their significant impacts on the economy. This study provides empirical evidence on how environmental regulations may simultaneously affect instantaneous welfare and long-term economic stability by focusing on the government debt responses to environmental regulations. In particular, our study is based on a setting where governments can use fiscal policy tools to smooth economic shocks.
Using the Action Plan on Air Pollution Prevention and Control in China as an example, we show that Chinese local governments significantly increased their LGFV debts to offset the economic slowdown that occurred following the implementation of the Action Plan. Although increasing LGFV debt issuance can play a role in stabilizing short-run economic performance, further analysis suggests that preexisting debt reliance and the possible principal–agent problem created by the promotion system for local officials can produce considerable risk in the future.
Our results have several implications. First, the latest “Carbon Peak and Carbon Neutrality Goal” set by the Chinese central government poses a significant challenge for the Chinese economy, the second-largest economy worldwide that is also trapped by salient government debt. Hence, it is important to understand how Chinese local government debt responds to environmental policies and the related implications. Second, generally, our results are consistent with the classical macroeconomic fiscal theory that government accumulate debt to stabilize the economy. However, debt accumulation can also hurt the economy because “fiscal policy is made not by angels but by an imperfect political process” (Mankiw, Reference Mankiw2016). In this sense, our results are also consistent with modern macroeconomic fiscal theory with present-biased governments (Yared, Reference Yared2019). In fact, our empirical results provide a natural motivation for studying the optimal design of a coordinated fiscal-environmental policy package that meticulously balance debt accumulation and environmental protection.
Supplementary material
The supplementary material for this article can be found at https://doi.org/10.1017/S1365100524000671.
Acknowledgements
We thank the editor and anonymous referee for their constructive comments. We also thank the discussants and participants in the Economic Fluctuation and Growth 2022 Spring Conference and CIRF 2022. We acknowledge the financial support of the National Natural Science Foundation of China (72003118, 72103122).



