1. Introduction
The chemical composition of clastic sedimentary rocks, especially fine-grained terrigenous sediments, has been widely used to identify their provenance as well as to reconstruct tectonic setting, palaeoclimate and palaeogeography of their depositional basin (McLennan et al. Reference McLennan, Taylor, McCulloch and Maynard1990; McLennan & Taylor, Reference McLennan and Taylor1991; Armstrong-Altrin, Reference Armstrong-Altrin2015; Verma & Armstrong-Altrin, Reference Verma and Armstrong-Altrin2016; Armstrong-Altrin & Machain-Castillo, Reference Armstrong-Altrin and Machain-Castillo2016; Armstrong-Altrin et al. Reference Armstrong-Altrin, Lee, Kasper-Zubillaga and Trejo-Ramírez2017; Hu, Wang & Wang, Reference Hu, Wang and Wang2017; Zhou et al. Reference Zhou, Friis, Yang and Nielsen2017; Amedjoe et al. Reference Amedjoe, Gawu, Ali, Aseidu and Nude2018; Zhai et al. Reference Zhai, Wu, Ye, Zhang and Wang2018). This approach is especially advantageous for well-preserved Precambrian–Cambrian (PC–C) sedimentary rocks, as they not only provide a window to the history of Earth evolution but also contain some pieces of evidence on the origin and distribution of life on the planet (Ugidos et al. Reference Ugidos, Barba, Valladares, Suárez and Ellam2016; Tawfik et al. Reference Tawfik, Ghandour, Maejima, Armstrong-Altrin and Abdel-Hameed2017; Wang et al. Reference Wang, Zeng, Zhou, Zhao, Zheng and Lan2017).
The rise of multicellular organisms on Earth during early Cambrian time, known as the Cambrian Explosion (CE) or Ediacaran–Cambrian Radiation (ECR), was a radical evolutionary change in the history of life (Santosh et al. Reference Santosh, Maruyama, Sawaki and Meert2014; Zhang et al. Reference Zhang, Shu, Han, Zhang, Liu and Fu2014; Erwin, Reference Erwin2015; Xu & Li, Reference Xu and Li2015; Mángano & Buatois, Reference Mángano and Buatois2016; Zhu & Li, Reference Zhu and Li2017). Numerous genetic, ecologic and environmental hypotheses have been proposed as possible triggers for the appearance and diversification of metazoans during the Cambrian Explosion (Erwin, Reference Erwin2015). According to the environmental explanation, the increase in the oxygen content of oceans and atmosphere through photosynthesis, in conjunction with an increase in the rate of nutrient supply into the oceans due to the rapid erosion of large collisional mountain belts, played an important role in the appearance of complex life forms on Earth (Chumakov, Reference Chumakov2010; Santosh et al. Reference Santosh, Maruyama, Sawaki and Meert2014). This hypothesis is supported by a remarkable change in seawater redox conditions obtained from redox-sensitive elements Mo, U, V and Ce, as well as a prominent increase in the nutrient elements P, Ca, K, Fe, Mg and S together with a marked increase in the 87Sr/86Sr isotopic ratio during the Ediacaran–Cambrian transition (Maruyama & Liou, Reference Maruyama and Liou2005; Maruyama et al. Reference Maruyama, Ikoma, Genda, Hirose, Yokoyama and Santosh2013; Santosh et al. Reference Santosh, Maruyama, Sawaki and Meert2014).
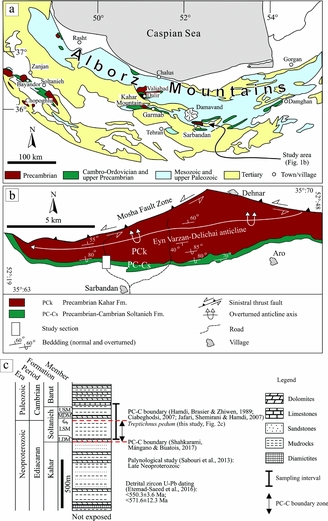
The Soltanieh Formation in the Alborz Mountains of northern Iran records a continuous sedimentation from late Precambrian to early Cambrian time (Fig. 1). These sediments conformably overlie the Precambrian Kahar Formation (Horton et al. Reference Horton, Hassanzadeh, Stockli, Axen, Gillis, Guest, Amini, Fakhari, Zamanzadeh and Grove2008; Etemad-Saeed et al. Reference Etemad-Saeed, Hosseini-Barzi, Adabi, Miller, Sadeghi, Houshmandzadeh and Stockli2016; Honarmand et al. Reference Honarmand, Li, Nabatian, Rezaeian and Etemad-Saeed2016). The Soltanieh Formation consists of supratidal to deep subtidal carbonates and subtidal shale members, including the Lower Shale Member (LSM), and the Upper Shale Member (Kimura & Watanabe, Reference Kimura and Watanabe2001). These two shale members are separated by a dolomite member. The PC–C boundary is located almost at the top of the Lower Shale Member of the Soltanieh Formation, 200–300 m above its basal contact with the Kahar Formation as documented by biostratigraphic data (Hamdi, Brasier & Zhiwen, Reference Hamdi, Brasier and Zhiwen1989; Ciabeghodsi et al. Reference Ciabeghodsi, Hamdi, Adabi and Sadeghi2005, Reference Ciabeghodsi, Hamdi, Adabi and Sadeghi2006; Ciabeghodsi, Reference Ciabeghodsi2007; Jafari, Shemirani & Hamdi, Reference Jafari, Shemirani, Hamdi, Vickers-Rich and Komarower2007; Ghorbani, Reference Ghorbani and Ghorbani2013). However, Shahkarami, Mángano & Buatois (Reference Shahkarami, Mángano and Buatois2017) have recently suggested that the Ediacaran–Cambrian boundary is located at the base of the Soltanieh Formation.
(a) Generalized geological map of the Alborz Mountains (Reference StocklinStocklin, 1968a) and the location of the Sarbandan section in the central part of Alborz Mountains. (b) Simplified geological map of the Sarbandan area (Cartier, Reference Cartier1972). The rectangle indicates the location of the study section, in the southern flank of the Eyn Varzan-Delichai anticline. (c) The logged stratigraphic section of the Kahar and Soltanieh formations in the Sarbandan area.

The Soltanieh Formation provides an exceptional well-preserved mudrock succession to study geochemical variations during the PC–C transition. In addition, the provenance of the Soltanieh Formation sediments can provide valuable information to clarify the tectonic setting of northern Iran along the proto-Tethyan margin of Gondwana during late Neoproterozoic – early Cambrian time, which has always been a matter of hot debate. A wide range of tectonic settings has been proposed for the Tethyan margin of Gondwana during this time, from a passive margin (Reference StocklinStocklin, 1968a; Falcon, Reference Falcon and Spencer1974; Berberian & King, Reference Berberian and King1981; Samani, Reference Samani1988; Talbot & Alavi, Reference Talbot, Alavi, Alsop, Blundell and Davison1996) to an active marginal setting (Ramezani & Tucker, Reference Ramezani and Tucker2003; Hassanzadeh et al. Reference Hassanzadeh, Stockli, Horton, Axen, Stockli, Grove, Schmitt and Walker2008; Horton et al. Reference Horton, Hassanzadeh, Stockli, Axen, Gillis, Guest, Amini, Fakhari, Zamanzadeh and Grove2008; Etemad-Saeed et al. Reference Etemad-Saeed, Hosseini-Barzi, Adabi, Sadeghi and Houshmandzadeh2015; Moghadam et al. Reference Moghadam, Khademi, Hu, Stern, Santos and Wu2015; Rossetti et al. Reference Rossetti, Nozaem, Lucci, Vignaroli, Gerdes, Nasrabadi and Theye2015; Honarmand et al. Reference Honarmand, Li, Nabatian, Rezaeian and Etemad-Saeed2016).
Despite the significance of the Soltanieh Formation for reconstructing the tectonic history of Iran and finding possible geochemical changes during the Ediacaran–Cambrian transition, previous studies on this formation are dominantly focused on its palaeontology (Hamdi, Brasier & Zhiwen, Reference Hamdi, Brasier and Zhiwen1989; Ciabeghodsi et al. Reference Ciabeghodsi, Hamdi, Adabi and Sadeghi2005, Reference Ciabeghodsi, Hamdi, Adabi and Sadeghi2006; Ciabeghodsi, Reference Ciabeghodsi2007; Jafari, Shemirani & Hamdi, Reference Jafari, Shemirani, Hamdi, Vickers-Rich and Komarower2007; Shahkarami, Mángano & Buatois, Reference Shahkarami, Mángano and Buatois2017) and, to some limited extent, on the geochemistry of mudrocks (Brasier et al. Reference Brasier, Magaritz, Corfield, Huilin, Xiche, Lin, Zhiwen, Hamdi, Tinggui and Fraser1990; Kimura et al. Reference Kimura, Matsumoto, Kakuwa, Hamdi and Zibaseresht1997; Kimura & Watanabe, Reference Kimura and Watanabe2001).
In this study, we present new geochemical data on both the Lower and the Upper shale members of the Soltanieh Formation in the central Alborz Mountains. There are two primary aims of this study: (1) to decipher the provenance of the Soltanieh Formation sediments and its implication for the tectonic reconstruction of the northern margin of Gondwana during the Ediacaran–Cambrian transition; and (2) to provide insights into the geochemical variations in ancient seawaters during deposition of the Soltanieh Formation.
2. Geological setting and stratigraphy of the Soltanieh Formation
The Soltanieh Formation is well exposed in the Sarbandan section in the central Alborz Mountains (Fig. 1a, b). The dominantly E–W-trending Alborz Mountain belt constitutes an active arcuate fold-and-thrust belt located between the South Caspian and the Central Iranian basins. The Alborz Mountains is a long-lived orogen shaped during different tectonic events from the Late Triassic Cimmerian orogeny (i.e. resulting from the collision of the Central Iranian block with Eurasia) to the post-Oligocene stage of intracontinental deformation (i.e. related to the collision between the Arabian and Eurasian plates) (Zanchi et al. Reference Zanchi, Berra, Mattei, Ghassemi and Sabouri2006; Ballato et al. Reference Ballato, Uba, Landgraf, Strecker, Sudo, Stockli, Friedrich and Tabatabaei2011; Madanipour et al. Reference Madanipour, Ehlers, Yassaghi and Enkelmann2017). The oldest exposed strata in the Alborz Mountains belong to the late Ediacaran Kahar Formation with an age of 550–560 Ma (Etemad-Saeed et al. Reference Etemad-Saeed, Hosseini-Barzi, Adabi, Miller, Sadeghi, Houshmandzadeh and Stockli2016; Honarmand et al. Reference Honarmand, Li, Nabatian, Rezaeian and Etemad-Saeed2016). The Kahar Formation consists of at least 1000 m thickness of siliciclastic sedimentary strata with minor carbonates deposited in deltaic, coastal tidal flat to shallow-marine environments (Etemad-Saeed, Reference Etemad-Saeed2014). This formation is conformably overlain by the alternating mudrocks and carbonates of the Soltanieh Formation (Reference StocklinStocklin, 1968a; Hamdi, Brasier & Zhiwen, Reference Hamdi, Brasier and Zhiwen1989; Ghorbani, Reference Ghorbani and Ghorbani2013). In some locations such as the Zanjan area (Fig. 1a for location), the Bayandor Formation, with an age of 550–600 Ma, lies between the Kahar and Soltanieh formations (Horton et al. Reference Horton, Hassanzadeh, Stockli, Axen, Gillis, Guest, Amini, Fakhari, Zamanzadeh and Grove2008; Honarmand et al. Reference Honarmand, Li, Nabatian, Rezaeian and Etemad-Saeed2016). However, the Bayandor Formation was not observed in the central Alborz Mountains (our stratigraphic column, Fig. 1c). The Soltanieh Formation is composed of five members; from base to top these are (Hamdi, Brasier & Zhiwen, Reference Hamdi, Brasier and Zhiwen1989) the Lower Dolomite Member (LDM), the Lower Shale Member (LSM; Chopoghlu Shale), the Middle Dolomite Member (MDM), the Upper Shale Member (USM) and the Upper Dolomite Member (UDM). The PC–C boundary in the Soltanieh Formation is identified based on biostratigraphy; the majority of previous studies have established that this boundary is located near the top of the LSM, where early skeletal fossils such as Protohertzina anabarica and index trace fossils such as Treptichnus pedum appear in the succession (Hamdi, Brasier & Zhiwen, Reference Hamdi, Brasier and Zhiwen1989; Ciabeghodsi et al. Reference Ciabeghodsi, Hamdi, Adabi and Sadeghi2005, Reference Ciabeghodsi, Hamdi, Adabi and Sadeghi2006; Ciabeghodsi, Reference Ciabeghodsi2007; Jafari, Shemirani & Hamdi, Reference Jafari, Shemirani, Hamdi, Vickers-Rich and Komarower2007). The MDM, USM and UDM contain a rich assemblage of small shelly fauna, which are similar to the well-documented lower Cambrian strata of the Nemakit-Daldyn Formation in Siberia and southern and central Asia (Hamdi, Brasier & Zhiwen, Reference Hamdi, Brasier and Zhiwen1989; Kimura et al. Reference Kimura, Matsumoto, Kakuwa, Hamdi and Zibaseresht1997; Kimura & Watanabe, Reference Kimura and Watanabe2001; Ciabeghodsi et al. Reference Ciabeghodsi, Hamdi, Adabi and Sadeghi2005, Reference Ciabeghodsi, Hamdi, Adabi and Sadeghi2006; Ciabeghodsi, Reference Ciabeghodsi2007; Jafari, Shemirani & Hamdi, Reference Jafari, Shemirani, Hamdi, Vickers-Rich and Komarower2007). Moreover, a remarkable negative δ13C excursion (–7 to –9 ‰) has been identified at the middle of the LSM, and was globally linked to an isotopic anomaly due to oceanic environmental change just before the PC–C boundary (Kimura et al. Reference Kimura, Matsumoto, Kakuwa, Hamdi and Zibaseresht1997). Shahkarami, Mángano & Buatois (Reference Shahkarami, Mángano and Buatois2017) proposed the new position for the PC–C boundary based on the report of Hyolithellus sp. from the LDM in the Vali-Abad section by Hamdi, Brasier & Zhiwen (Reference Hamdi, Brasier and Zhiwen1989), and new sedimentological data from the Garmab and the Type section in Zanjan (Fig. 1a for location). However, they report the first occurrence of T. pedum at the top of the LSM.
In the Sarbandan section, located about 85 km to the NE of Tehran city (35° 40′ 17″ N, 52° 17′ 53″ E, Fig. 1a), the Soltanieh Formation is continuously exposed with a thickness of c. 350 m in the southern flank of the E–W-trending Ayine Varzan-Delichai anticline, located 2 km south of the Mosha fault zone (Fig. 1b). In this section, the LDM of the Soltanieh Formation conformably overlies the Kahar Formation. However, the UDM is missing and here the USM is unconformably overlain by Biconulite-bearing limestones and mudrocks of the Barut Formation.
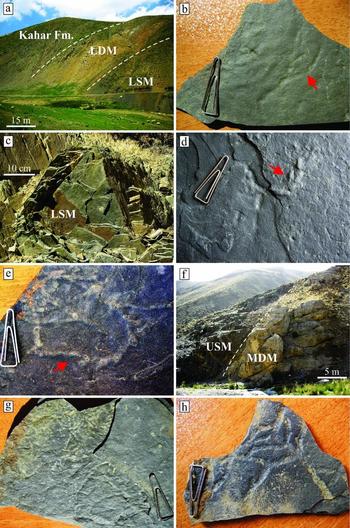
The general stratigraphy of the study area is shown in Figure 1c. The strata can be divided into four members. Above the green-grey siliciclastics of the Kahar Formation, the LDM is composed of c. 34-m-thick, yellowish, thickly bedded to massive recrystallized dolostone with chert, mostly in the form of stratiform stromatolites. The LSM is c. 210 m thick and is composed of dark grey to black mudrocks as platy shales containing abundant trace fossils (Fig. 2a). At basal parts of the LSM, trace fossils are characterized by low-diversity, simple and subhorizontal trails and burrows (Fig. 2b), although the abundance and complexity of trace fossils significantly increase towards the top of the LSM (Fig. 2c). The T. pedum ichnospecies, an index trace fossil of the basal lower Cambrian in the global stratotype section, was also observed at the upper parts of this member (c. 50 m below the MDM; Fig. 2d, e). The Ediacaran–Cambrian boundary in this section therefore probably lies near the top of the LSM, similar to the rest of the central Alborz Mountains. The MDM is c. 24 m thick, composed of buff-coloured to brown, thickly bedded to massive, dolostone containing early Cambrian small shelly fauna (Fig. 2f). The USM consists of c. 70-m-thick dark-grey shales with abundant diverse trace fossils in complex patterns (Fig. 2g, h). The uppermost part of the USM is unconformably overlain by interbedded mudrocks and carbonates of the Barut Formation.
Field photographs of the Soltanieh Formation in the Sarbandan section. (a) Conformable contact between the Kahar Formation and the Lower Dolomite Member (LDM) of the Soltanieh Formation. Note that beds are overturned at this location at the southern flank of the Eyn Varzan-Delichai anticline. (b) Simple burrows in the basal parts of the Lower Shale Member (LSM). (c) Close-up view of abundant trace fossils observed in the upper parts of the LSM. (d, e) Treptichnus pedum ichnospecies, index trace fossil of basal Lower Cambrian, at the upper parts of the LSM. (f) The contact between Middle Dolomite Member (MDM) and Upper Shale Member (USM) of the Soltanieh Formation. (g, h) Complex trace fossils from the USM of the Soltanieh Formation.

3. Materials and methods
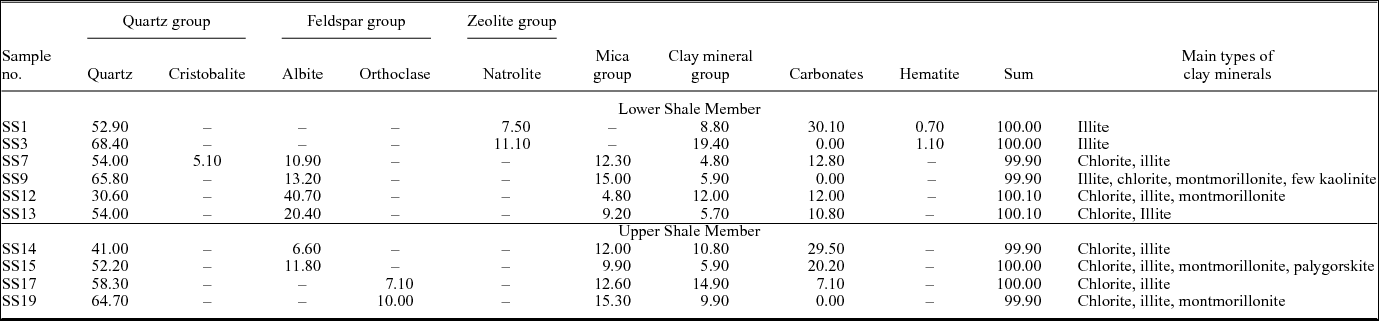
In the present study, 20 mudrock samples were collected from the Soltanieh Formation for geochemical analysis (13 from the LSM and 7 from the USM). All samples were powdered to less than 200 mesh (<75 µm). The mineralogical composition of ten selected mudrocks (six and four samples from the LSM and USM, respectively) were obtained using a Siemens D5000 X-ray diffractometer (XRD) of the Geological Survey of Iran according to the method described by Hardy & Tucker (Reference Hardy, Tucker and Tucker1988). Sample preparation started by removing carbonates and organic matter using H2O2 and acetic acid. The samples were then treated by cations (Mg and K) and ethylene glycol saturations. Heat treatment was also performed initially at 350 °C and then at 550 °C. Clay minerals, quartz, feldspar, calcite and other minerals were identified following the common schemes (Brindley, Reference Brindley1980). The semi-quantitative results are presented in Table 1.
The x-ray diffraction semi-quantitative results (%) for the Soltanieh mudrocks.

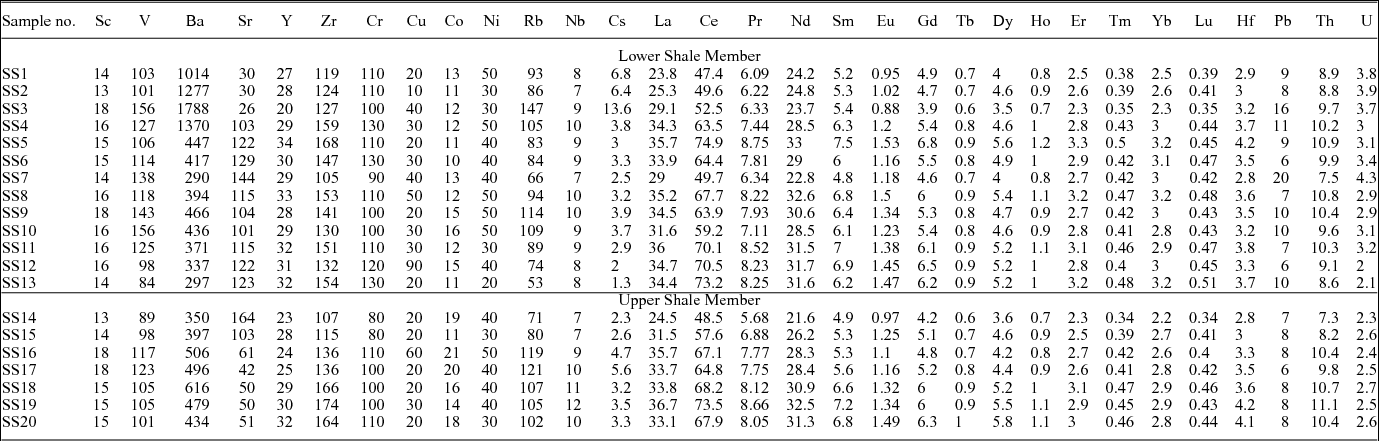
Whole-rock chemical analyses of major and trace elements (Tables 2, 3) were performed at ACTLABS, Ontario, Canada. After fusion with lithium metaborate, the resulting molten beads were digested in a weak nitric acid solution. During the next stage, the solutions were analysed by inductively coupled plasma optical emission spectrometry (ICP-OES) for major elements and a selection of trace elements, including Sc, Be, V, Ba, Sr, Y and Zr. Other trace elements and the rare Earth elements (REE) were analysed by inductively coupled plasma mass spectrometry (ICP-MS). Details of analytical methods and the precision and accuracy of ACTLABS ICP-OES and ICP-MS analyses can be found at www.actlabs.com.
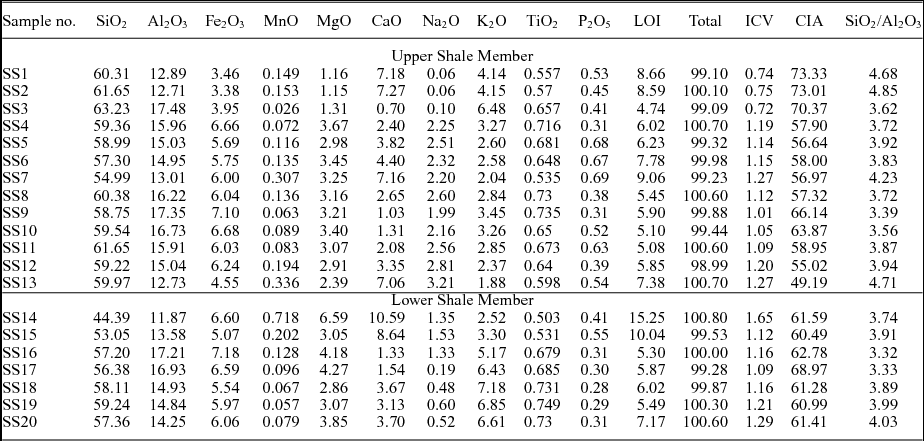
Major-element concentrations (wt %), chemical index of alteration (Nesbitt & Young, Reference Nesbitt and Young1982), index of chemical variability (Cox, Lowe & Cullers, Reference Cox, Lowe and Cullers1995), and SiO2/Al2O3 ratio for studied mudrocks of the Soltanieh Formation.

Trace and rare Earth element concentrations (ppm) for the studied mudrocks of the Soltanieh Formation.

4. Results
4.a. Mineral composition
Mineralogical analysis of mudrock samples of the Soltanieh Formation indicates that almost all the samples are composed of quartz, feldspar (mainly albite plagioclase and rarely orthoclase), barium- and vanadium-rich varieties of muscovite, and calcite. Additionally, some of the samples also contained natrolite, dolomite and hematite (Table 1). The major clay minerals include chlorite (mainly clinochlore), illite, montmorillonite and palygorskite (only in one sample). Illite is the only known clay mineral at the base of the LSM, whereas chlorite is the most abundant clay mineral at the top of the LSM and also of the entire USM.
4.b. Major and trace elements
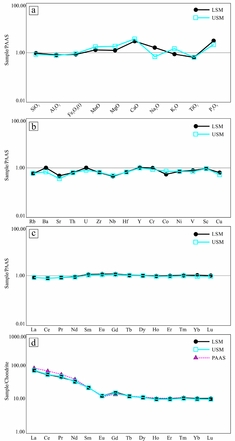
Whole-rock major- and trace-element concentrations of the Soltanieh Formation mudrocks are presented in Tables 2 and 3. Utilizing the composition of the post-Archean Australian shales (PAAS) as a reference for the upper continental crust composition (Taylor & McLennan, Reference Taylor and McLennan1985), similar contents of SiO2, Al2O3, Fe2O3 and TiO2 are found in the LSM and USM. However, in comparison with the PAAS, the Soltanieh Formation mudrocks are apparently more enriched in CaO and P2O5 (Fig. 3a). Samples with high CaO usually have high loss on ignition (LOI) values, indicating their high carbonate contents. P2O5 is dominantly enriched in the upper part of the LSM (4 times that of PAAS). Moreover, Na2O displays significant enrichment in the upper part of the LSM, whereas MnO, MgO and K2O are slightly higher in the USM.
(a–c) Plots of the PAAS-normalized major, trace and rare Earth elements in the studied mudrocks of the LSM and USM. (d) Chondrite-normalized REE plot showing LREE enrichment, negative Eu anomaly and flat HREE. PAAS and chondrite data are from Taylor & McLennan (Reference Taylor and McLennan1985).

Both groups of studied mudrocks have almost similar mean contents to that of PAAS in most of the trace elements (Fig. 3b). However, Soltanieh Formation mudrocks are slightly depleted in Sr and Nb compared with PAAS. A slight depletion in Ba and U was also observed in the USM, unlike the LSM. Both groups of studied mudrocks have similar REE concentrations to that of PAAS (Fig. 3c). On the other hand, the chondrite-normalized REE patterns of the analysed mudrocks (chondrite normalization values are from Taylor & McLennan, Reference Taylor and McLennan1985) are highly fractionated ((La/Yb)n = 7.46 and 8.17 for LSM and USM, respectively) and are characterized by light rare Earth elements (LREE) enrichment, large negative Eu anomaly (i.e. Eu/Eu* = 2Eun/(Smn + Gdn) and flat heavy rare Earth elements (HREE), similar to PAAS (Fig. 3d). The Eu/Eu* values range from 0.58 to 0.77 (average, 0.66) in the LSM, and 0.62 to 0.73 (average, 0.67) in the USM. These REE patterns and Eu anomaly (average, 0.66) are similar to those of PAAS.
5. Discussion
5.a. Source area weathering and recycling
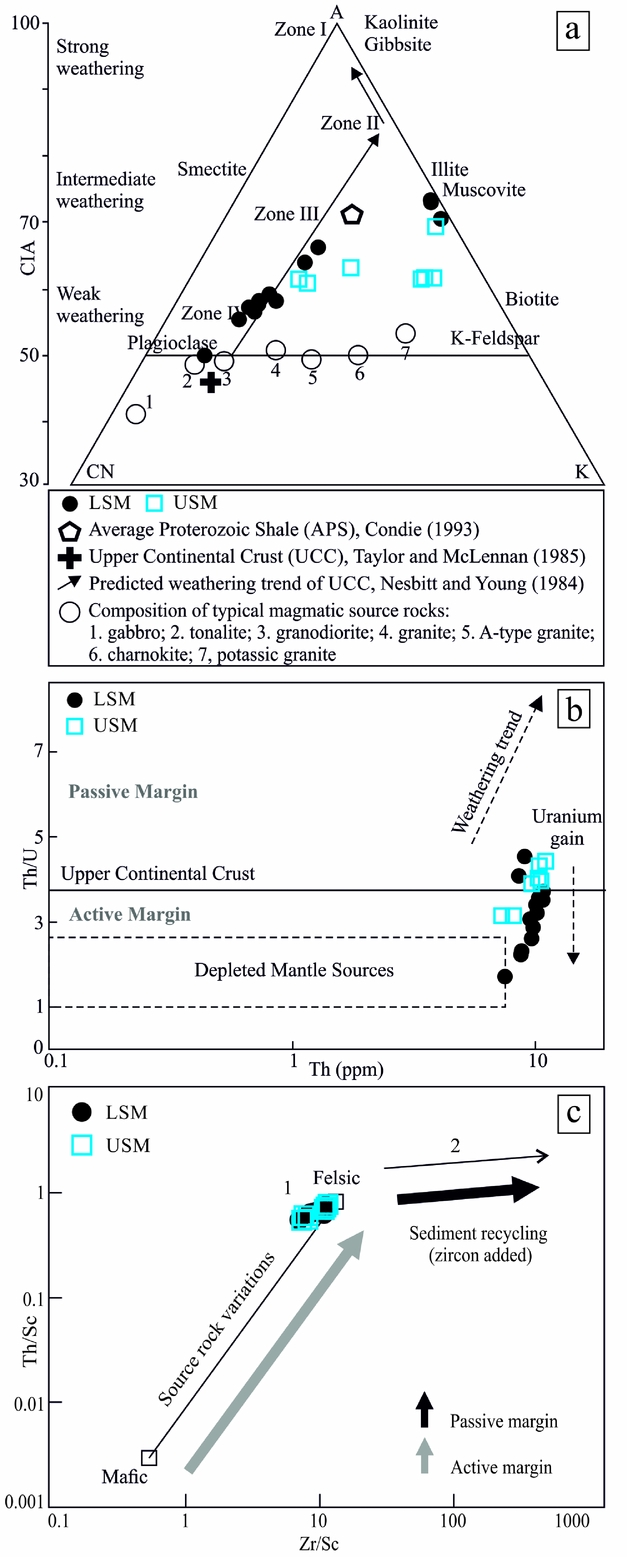
Before we can discuss the provenance of studied mudrocks, we must clarify the influence of weathering and recycling upon the source-rock signatures of sediments by studying sensitive elements including alkali and alkaline Earth elements. In this study, four chemical indices and diagrams were used to examine weathering intensity and recycling of the Soltanieh Formation mudrocks (Fig. 4a–c): (1) the chemical index of alteration (CIA; Nesbitt & Young, Reference Nesbitt and Young1982); (b) A-CN-K (Al2O3 – CaO + Na2O – K2O) triangular diagram (Nesbitt & Young, Reference Nesbitt and Young1982, Reference Nesbitt and Young1984); (3) index of chemical variability (ICV; Cox, Lowe & Cullers, Reference Cox, Lowe and Cullers1995), SiO2/Al2O3 ratio (Potter, Reference Potter1978); and (4) Th/U versus Th and Th/Sc versus Zr/Sc diagrams (McLennan et al. Reference McLennan, Hemming, McDaniel and Hanson1993). These geochemical indices and diagrams indicated low-intensity weathering conditions and tectonically active sources, and are explained in the following (Fig. 4).
(a) The A-CN-K ternary diagram (Nesbitt & Young, Reference Nesbitt and Young1982) illustrating the weathering trend and the initial composition of parent rocks for the Soltanieh Formation mudrocks. (b) Th/U versus Th and (c) Th/Sc versus Zr/Sc bivariate plots (McLennan et al. Reference McLennan, Hemming, McDaniel and Hanson1993) indicating weathering condition, sediment recycling and tectonic setting, respectively.

The CIA is calculated based on molecular percentage of major oxides: CIA= [Al2O3/(Al2O3 + CaO* + Na2O + K2O)] ×100, where the CaO* value represents Ca incorporated in the silicate fraction of the sample. In this study, CaO values were corrected based on the method of McLennan (Reference McLennan1993): if the mole fraction of CaO<Na2O, then the value of CaO remains unaltered. In contrast, if CaO>Na2O then CaO equals Na2O. The CIA values in the LSM are 49.19–73.33 (average, 61.28), while CIA values in the USM are 60.49–68.97 (average, 62.50). In general, low–intermediate (c. 60) CIA values in studied mudrocks of the Soltanieh Formation indicate low-intensity chemical weathering in the source area and tectonically active sources.
The molar proportions of Al2O3 – CaO + Na2O – K2O are plotted in A-CN-K ternary diagrams to identify the provenance composition and weathering trends (Nesbitt & Young, Reference Nesbitt and Young1984; Fedo, Nesbitt & Young, Reference Fedo, Nesbitt and Young1995). The studied samples, especially samples from the LSM, plot sub-parallel to the A-CN, join close to the predicted weathering trend of upper continental crust (UCC) and away from the kaolinite pole (Nesbitt & Young, Reference Nesbitt and Young1984). The mineralogical composition of the studied mudrocks, lacking kaolinite and gibbsite clay minerals, confirm the low-intensity weathering conditions in the source area (Table 1).
The ICV, defined as (Fe2O3 + K2O + Na2O + CaO + MgO + MnO + TiO2)/Al2O3 (Cox, Lowe & Cullers, Reference Cox, Lowe and Cullers1995), can also be applied in mudrocks as an index for recycling and chemical weathering. Cox, Lowe & Cullers (Reference Cox, Lowe and Cullers1995) conclude that minerals in unweathered rocks have higher ICV values than clay minerals (e.g. amphibole–pyroxene = 10–100; kaolinite = 0.03–0.05). The relatively unaltered mudrocks therefore have ICV > 1 and are deposited as mostly first-cycle sediments during incipient chemical weathering in tectonically active areas (Cox, Lowe & Cullers, Reference Cox, Lowe and Cullers1995; Cullers & Podkovyrov, Reference Cullers and Podkovyrov2002; Pettijohn, Potter & Siever, Reference Pettijohn, Potter and Siever2012). The ICV values of the studied mudrocks were > 1 in both the LSM (0.72–1.27; average, 1.05) and the USM (1.09–1.65; average, 1.24). These values indicate that the Soltanieh Formation mudrocks are dominated by first-cycle materials such as feldspars; their presence is supported by the XRD data.
We also examined compositional maturity and sediment recycling effects in the studied mudrocks using the SiO2/Al2O3 ratio. In general, this ratio varies based on the maturity of the siliciclastic rocks, such that in extensively recycled sediments this ratio is high (Potter, Reference Potter1978; Roser et al. Reference Roser, Cooper, Nathan and Tulloch1996; Armstrong-Altrin, Reference Armstrong-Altrin2015). The SiO2/Al2O3 ratio in both the LSM (3.39–4.85; average, 4) and the USM (3.32–4.03; average, 3.74) were < 10, indicating their chemical immaturity.
Furthermore, according to McLennan et al. (Reference McLennan, Hemming, McDaniel and Hanson1993), the Th/U versus Th and Th/Sc versus Zr/Sc diagrams allow the degree of weathering and recycling to be estimated in sedimentary rocks. Th/U is typically c. 3.5–4.0 for uppermost crustal rocks; however, the low Th/U ratio is common in mantle-derived volcanic rocks and reflects the geochemically depleted nature of such reservoirs (McLennan et al. Reference McLennan, Hemming, McDaniel and Hanson1993). In addition, sedimentary processes such as weathering and sedimentary recycling increase this ratio due to oxidation of U4+ to more soluble U6+ (McLennan et al. Reference McLennan, Hemming, McDaniel and Hanson1993). The LSM and USM mudrocks show relatively low Th/U values (LSM average, 3.16; USM average, 3.85), inferring that they have not undergone significant weathering and/or sedimentary recycling (Fig. 4b). On the other hand, the Th/Sc ratio is a sensitive index of the degree of source-rock differentiation, whereas the Zr/Sc ratio reflects the degree of sedimentary recycling characterized by enrichment of zircon content due to addition of zircon heavy mineral (McLennan et al. Reference McLennan, Hemming, McDaniel and Hanson1993). On the Th/Sc versus Zr/Sc diagram, studied mudrocks follow a consistent trend with igneous differentiation as the primary control in an active margin setting, with minimal influence of sedimentary sorting and recycling (Fig. 4c).
5.b. Source-rock lithology
Mineralogical and chemical compositions of the Soltanieh Formation mudrocks were used to infer the lithology of their parent rocks in the source area. Quartz and feldspar, which are essential constituents of many felsic and intermediate igneous rocks, make up slightly more than 50 % of the minerals in the studied mudrocks (Table 1). Furthermore, the dominance of plagioclase over K-feldspar in these mudrocks represents plagioclase-rich crystalline parent rocks. A small amount of illite and chlorite clay minerals observed in the Soltanieh Formation mudrocks (Table 1) is not representative of the basic lithology of their parent rocks because the illite and chlorite are the usual product of the conversion of other metastable components, especially in the mudrock units of Precambrian and early Palaeozoic age. However, the presence of montmorillonite clay mineral and also zeolite as well-known alteration products of volcanic glass may reflect their igneous origin. The preservation of montmorillonite in these rocks also shows a very rapid weathering and sedimentation process (Weaver, Reference Weaver1989; Boggs, Reference Boggs2009; Tucker, Reference Tucker2009).
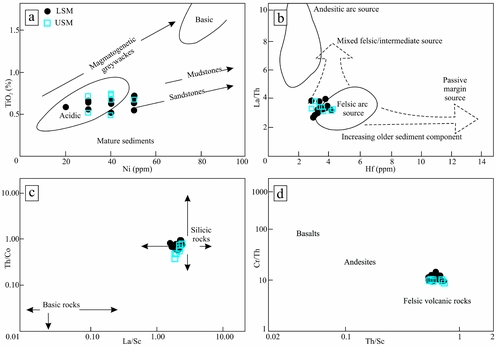
Trace elements (e.g. Y, Ti, Th, Sc, Zr, Cr, Ni, Co and Hf) and REEs are suitable for the reconstruction of parent rock composition in fine-grained siliciclastic rocks. REEs generally have different abundances in different igneous source rocks and are relatively immobile during sedimentary processes (Taylor & McLennan, Reference Taylor and McLennan1985; McLennan et al. Reference McLennan, Taylor, McCulloch and Maynard1990; McLennan & Taylor, Reference McLennan and Taylor1991). In the present study, we used elemental ratios and diagrams (Table 4; Fig. 5) based on these trace elements, and also chondrite-normalized REE patterns (Fig. 3d) to understand the composition of source areas of studied mudrocks.
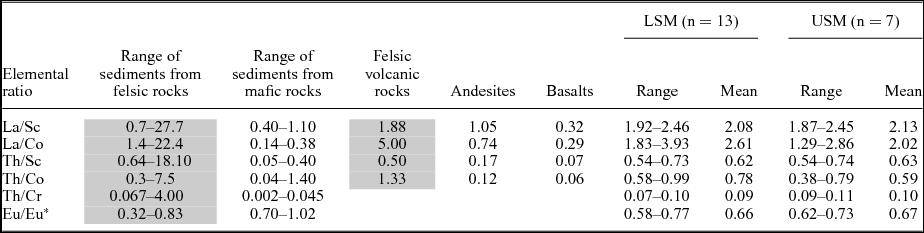
Elemental ratios of the Soltanieh mudrocks compared with those of sediments derived from felsic and mafic rocks (Cullers, Reference Cullers2000), as well as Proterozoic felsic volcanic rocks, andesites and basalts (Condie, Reference Condie1993). The values similar to the Soltanieh samples are shaded grey.

Provenance discrimination diagrams to recognize the composition of source areas of the Soltanieh mudrocks: (a) TiO2 versus Ni (Floyd, Winchester & Park, Reference Floyd, Winchester and Park1989); (b) La/Th versus Hf (Floyd & Leveridge, Reference Floyd and Leveridge1987); (c) Th/Co versus La/Sc (Cullers & Podkovyrov, Reference Cullers and Podkovyrov2002); and (d) Cr/Th versus Th/Sc (Condie & Wronkiewicz, Reference Condie and Wronkiewicz1990).

The La/Sc, La/Co, Th/Sc, Th/Co, Th/Cr and Eu/Eu* ratios of sediments, from both felsic and mafic rocks (Cullers, Reference Cullers2000) as well as different Proterozoic igneous rocks (Condie, Reference Condie1993), are shown in Table 4. These elemental ratios of the Soltanieh Formation mudrocks are within the range of sediments derived from felsic volcanic rocks.
Furthermore, a felsic provenance of the Soltanieh Formation mudrocks is supported by TiO2 versus Ni (Floyd, Winchester & Park, Reference Floyd, Winchester and Park1989), La/Th versus Hf (Floyd & Leveridge, Reference Floyd and Leveridge1987), Th/Co versus La/Sc (Cullers & Podkovyrov, Reference Cullers and Podkovyrov2002) and Cr/Th versus Th/Sc (Condie & Wronkiewicz, Reference Condie and Wronkiewicz1990) diagrams. All of the studied mudrocks fall into the field of felsic rock provenance, suggesting that they were derived from felsic arc source rocks (Fig. 5a–d). In addition, the use of weathering trends and the relative abundances of plagioclase and K-feldspar in unweathered source rocks in the A-CN-K diagram (Fedo, Nesbitt & Young, Reference Fedo, Nesbitt and Young1995) suggests felsic/intermediate composition (plagioclase-rich source rocks such as granodiorite) for the LSM mudrocks (Fig. 4a); however, the USM samples do not show a meaningful trend.
Chondrite-normalized REE diagrams also provide useful insight into source-rock characteristics of the studied mudrocks. Both the LSM and USM samples show high LREE/HREE ratios and negative Eu anomaly (Fig. 3d), which are the characteristics of felsic source rocks (Cullers, Reference Cullers1994). These patterns are similar to PAAS, suggesting that they originated from a differentiated silicic source.
5.c. Tectonic setting of depositional basin of the Soltanieh Formation
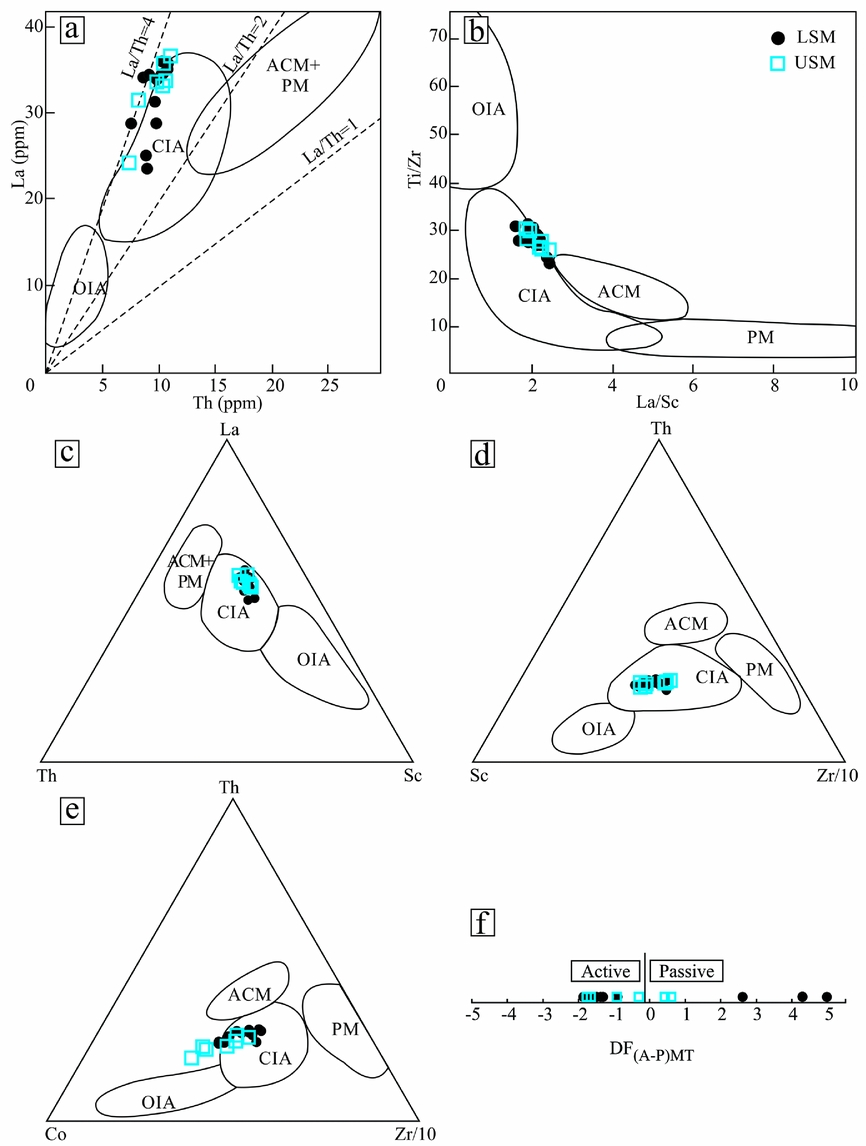
The mineralogy and chemical composition (especially trace elements) of mudrocks provide important clues for recognition of tectonic setting of their depositional basin. The studied mudrocks plot in the III and IV weathering zones of the A-CN-K diagram (Fig. 4a), consistent with tectonically active regions where weathering profiles are thin and bedrock outcrops are common (Nesbitt et al. Reference Nesbitt, Young, McLennan and Keays1996). The scattered distribution of some samples (especially USM samples) may also be an indicator of non-steady-state weathering conditions in the source area. In tectonically active settings, non-steady-state weathering conditions prevail (Nesbitt et al. Reference Nesbitt, Young, McLennan and Keays1996). Despite some disadvantages, tectonic setting discrimination diagrams based on trace elements with relatively low mobility have been widely employed to identify the tectonic setting of sedimentary basins (Verma & Armstrong-Altrin, Reference Verma and Armstrong-Altrin2016). In this study, we used both traditional diagrams based on immobile trace elements (Bhatia & Crook, Reference Bhatia and Crook1986) and a newly developed discriminant function diagram based on combined major and trace elements introduced by Verma & Armstrong-Altrin (Reference Verma and Armstrong-Altrin2016). On La versus Th, Ti/Zr versus La/Sc, La-Th-Sc, Th-Sc-Zr/10 and Th-Co-Zr/10 tectonic setting discrimination diagrams (Bhatia & Crook, Reference Bhatia and Crook1986), most of the studied mudrocks from the LSM and USM fall within the field of continental island-arc setting (Fig. 6a–e). In the new discriminant function diagram of Verma & Armstrong-Altrin (Reference Verma and Armstrong-Altrin2016) based on ten major (SiO2 to P2O5) and six trace (Cr, Nb, Ni, V, Y, and Zr) elements, except for five samples with high CaO content, all studied samples plot in the active margin setting field (Fig. 6f). According to these geochemical plots, the Soltanieh Formation therefore dominantly received sediments from an active continental margin and was deposited in a subduction-related basin.
Tectonic setting discrimination diagrams for the Soltanieh mudrocks: (a) La versus Th, (b) Ti/Zr versus La/Sc, (c) La-Th-Sc, (d) Th-Sc-Zr/10, (e) Th-Co-Zr/10 (Bhatia & Crook, Reference Bhatia and Crook1986), and (f) discriminant function diagram of Verma and Armstrong-Altrin (Reference Verma and Armstrong-Altrin2016), based on ten major (SiO2 to P2O5) and six trace elements (Cr, Nb, Ni, V, Y and Zr). OIA – oceanic island arc; CIA – continental volcanic arc; ACM – active continental margin; PM – passive margin.

5.d. Constraints on provenance: implication for reconstruction of the late Ediacaran – early Cambrian northern margin of Gondwana
Most of the Iranian tectonic domains, including the Alborz Mountains, Central Iranian Basin, Sanandaj-Sirjan zone, and Zagros foreland folded belt (excluding Kopet Dagh Mountains), show strong lithostratigraphic and biostratigraphic similarities in their late Neoproterozoic – Cambrian sedimentary basement, comprising the Kahar-Soltanieh succession (and their equivalents). This correlation ties different Iranian tectonic domains to each other and to the terranes of the northern margin of Gondwana (Hassanzadeh et al. Reference Hassanzadeh, Stockli, Horton, Axen, Stockli, Grove, Schmitt and Walker2008; Etemad-Saeed et al. Reference Etemad-Saeed, Hosseini-Barzi, Adabi, Sadeghi and Houshmandzadeh2015, Reference Etemad-Saeed, Hosseini-Barzi, Adabi, Miller, Sadeghi, Houshmandzadeh and Stockli2016; Honarmand et al. Reference Honarmand, Li, Nabatian, Rezaeian and Etemad-Saeed2016). However, the tectonic setting of Iran at the northern margin of Gondwana during late Ediacaran – Cambrian time has always been a source of debate. Although some authors have proposed a passive marginal setting for Iran as part of the Afro-Arabian platform (Reference StocklinStocklin, 1968b; Husseini, Reference Husseini1989; Berberian & King, Reference Berberian and King1981; Talbot & Alavi, Reference Talbot, Alavi, Alsop, Blundell and Davison1996), there are other publications showing evidence of an active margin setting for Iran as a part of peri-Gondwanan terranes (Malek-Mahmoudi et al. Reference Malek-Mahmoudi, Davoudian, Shabanian, Azizi, Asahara, Neubauer and Dong2017; Ramezani & Tucker, Reference Ramezani and Tucker2003; Hassanzadeh et al. Reference Hassanzadeh, Stockli, Horton, Axen, Stockli, Grove, Schmitt and Walker2008; Horton et al. Reference Horton, Hassanzadeh, Stockli, Axen, Gillis, Guest, Amini, Fakhari, Zamanzadeh and Grove2008). New geochemical and geochronological constraints on the crystalline granitic and orthogneissic basement rocks of Iran (c. 650–500 Ma) support the second scenario, indicating Cadomian arc plutonism and volcanism in Iran during southwards subduction of the Proto-Tethys ocean along the northern margin of Gondwana (Moghadam et al. Reference Moghadam, Khademi, Hu, Stern, Santos and Wu2015, Reference Moghadam, Li, Stern, Ghorbani and Bakhshizad2016, Reference Moghadam, Li, Griffin, Stern, Thomsen, Meinhold, Aharipour and O'Reilly2017; Malek-Mahmoudi et al. Reference Malek-Mahmoudi, Davoudian, Shabanian, Azizi, Asahara, Neubauer and Dong2017).
In addition to crystalline basement, the provenance of detrital sediments which have been deposited during this time interval can also provide a reliable insight into the palaeogeography of the northern margin of Gondwana. Our new provenance data on the upper Ediacaran – lower Cambrian Soltanieh Formation implies that the LSM and USM mudrocks have an immature character and are mainly derived from proximal felsic and intermediate arc-related igneous rocks under low-intensity chemical weathering, and were probably deposited in an active tectonic setting. This interpretation is in agreement with that of the underlying Kahar Formation (Etemad-Saeed et al. Reference Etemad-Saeed, Hosseini-Barzi, Adabi, Sadeghi and Houshmandzadeh2015), which contains immature arc-derived greywackes and mudrocks. This is also supported by the presence of Cadomian felsic rocks in Iran during this time interval as main parent rocks for the Kahar and Soltanieh sediments (Moghadam et al. Reference Moghadam, Khademi, Hu, Stern, Santos and Wu2015, Reference Moghadam, Li, Stern, Ghorbani and Bakhshizad2016, Reference Moghadam, Li, Griffin, Stern, Thomsen, Meinhold, Aharipour and O'Reilly2017; Malek-Mahmoudi et al. Reference Malek-Mahmoudi, Davoudian, Shabanian, Azizi, Asahara, Neubauer and Dong2017). However, it should be noted that the zircon age populations of the Kahar Formation indicate a distal-minor parent rock for the Kahar sediments within the Arabian–Nubian Shield (East African Orogen; Horton et al. Reference Horton, Hassanzadeh, Stockli, Axen, Gillis, Guest, Amini, Fakhari, Zamanzadeh and Grove2008; Etemad-Saeed et al. Reference Etemad-Saeed, Hosseini-Barzi, Adabi, Sadeghi and Houshmandzadeh2015), which can also act as a secondary source for the Soltanieh sediments.
The synthesis of geochemical, provenance and geochronological evidence, from both magmatic and sedimentary rocks, demonstrates that during the late Neoproterozoic – early Cambrian transition, Iran was part of a Cadomian-type terrane with widespread continental-arc plutonism and volcanism. Sedimentary basins associated with this tectonic setting were filled with immature clastic sediments of the Kahar and Soltanieh formations (and their time equivalents), which were dominantly derived from peripheral Cadomian active arcs. Similar late Neoproterozoic – early Cambrian Cadomian arcs providing immature siliciclastic sediments (mostly greywackes) are also reported from Himalaya, Turkey, North Africa and Iberia (Pereira et al. Reference Pereira, Chichorro, Linnemann, Eguiluz and Silva2006; Cawood, Johnson & Nemchin, Reference Cawood, Johnson and Nemchin2007; Ustaömer et al. Reference Ustaömer, Ustaömer, Gerdes, Robertson and Collins2012; Ling et al. Reference Ling, Chen, Li, Wang, Shields-Zhou and Zhu2013; Zlatkin, Avigad & Gerdes, Reference Zlatkin, Avigad and Gerdes2013; Abbo et al. Reference Abbo, Avigad, Gerdes and Güngör2015; Avigad, Abbo & Gerdes, Reference Avigad, Abbo and Gerdes2016), indicating an analogical tectonic evolution of these regions during late Ediacaran – early Cambrian time, extending along the northern Gondwana active continental margin.
5.e. Geochemical variations across the Ediacaran–Cambrian transition
The Ediacaran–Cambrian boundary zone coincides with the first appearance of complex life forms on Earth. Global changes in palaeoenvironmental redox conditions, together with the large input of nutrient-bearing clastic materials into the oceans due to the enhanced erosion rate resulting from large collisional mountain belts, were probably responsible for this major biological evolution at the PC–C boundary (Squire et al. Reference Squire, Campbell, Allen and Wilson2006; Santosh et al. Reference Santosh, Maruyama, Sawaki and Meert2014; Xu & Li, Reference Xu and Li2015; Boyle et al. Reference Boyle, Dahl, Bjerrum and Canfield2018). For this reason, we examined the variation of redox-sensitive elements and some key nutrient elements in the mudrocks of the LSM and USM in order to record the change in palaeoenvironmental conditions during deposition of the Soltanieh Formation.
The Ce anomaly (Ce/Ce* = 2Cen/(Lan + Ndn)) and total REE abundance (∑REE) values (Murray et al. Reference Murray, Ten Brink, Jones, Gerlach and Russ1990) were calculated in this study to decipher palaeoenvironmental conditions during the deposition of LSM and USM mudrocks. Ce anomaly values vary from 0.94 to 1.11 (average, 1.01) in the LSM and from 0.98 to 1.06 (average, 1.03) in the USM, accompanied by negative Ce anomalies near the top of the LSM (SS7–10). On the other hand, the ∑REE ranges from 123.81 to 183.33 (average, 156.27) in the LSM and from 120.43 to 180.08 (average, 157.98) in the USM. In general, the studied mudrocks exhibit slight or no Ce anomalies. These values are similar to fine-grained sediments deposited in continental margin environments with no pronounced fractionation of Ce from other REEs (Murray et al. Reference Murray, Ten Brink, Jones, Gerlach and Russ1990). The very low ∑REE content in studied mudrocks is also an indication of a continental margin setting. In this shallow environment, the total REE abundance in fine-grained sediments is extremely low; this is due to the dominant continental input and high sedimentation rate that minimizes the adsorption of REE from seawater (Murray et al. Reference Murray, Ten Brink, Jones, Gerlach and Russ1990). Since the ∑REE abundances and Ce/Ce* values are relatively similar in the LSM and USM mudrocks, it can be concluded that there was no significant change in sedimentary environment during the deposition of the Soltanieh Formation mudrocks.
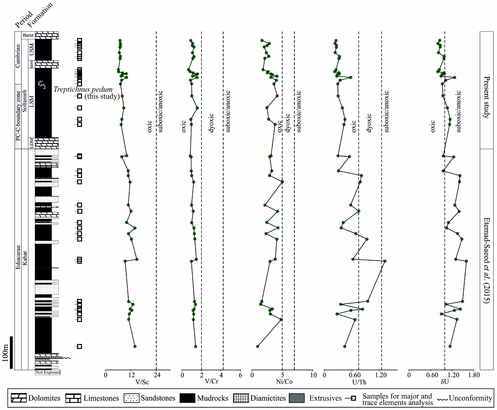
We investigated the redox conditions of depositional environment of the Soltanieh Formation mudrocks by calculating the V/Sc, V/Cr, Ni/Co, U/Th and δU (δU = U/ (U/2 + Th/6)) ratios. Generally, these ratios are high in reducing but low in oxidizing environments (Wang et al. Reference Wang, Zou, Dong, Wang, Li, Huang and Guan2015; Chang et al. Reference Chang, Hu, Fu, Cao, Wang and Yao2016; Guo et al. Reference Guo, Shibuya, Akiba, Saji, Kondo and Nakamura2016). The geochemical profiles of the studied mudrocks from the LSM and USM of the Soltanieh Formation were combined with the geochemical measurements on the Ediacaran Kahar Formation mudrocks previously published by Etemad-Saeed et al. (Reference Etemad-Saeed, Hosseini-Barzi, Adabi, Sadeghi and Houshmandzadeh2015). V/Sc ratios range from 6 to 9.86 (average, 7.79) in the LSM and 6.50 to 7 (average, 6.84) in the USM. Moreover, V/Cr ratios range from 0.65 to 1.56 (average, 1.11) and 0.92 to 1.23 (average, 1.09) in the LSM and USM, respectively. Accordingly, Ni/Co ratios range from 1.82 to 4.17 (average, 3.20) and 1.67 to 2.86 (average, 2.32) in the LSM and USM, respectively. Furthermore, U/Th ratios also vary from 0.22 to 0.57 (average, 0.34) in the LSM and 0.23 to 0.32 (average, 0.26) in the USM. Finally, δU values range from 0.79 to 1.26 (average, 0.99) in the LSM and 0.81 to 0.98 (average, 0.88) in the USM. As summarized in Figure 7, all of the redox-sensitive ratios gradually decrease from the Kahar Formation upwards section to the top of the Soltanieh Formation. There is also a small enrichment in these ratios within the uppermost part of the LSM (Fig. 7); there were therefore conditions of slightly greater redox during the deposition of the LSM relative to the USM. This suggests a gradual change in redox conditions from dyoxic to oxic during late Ediacaran – early Cambrian time in the depositional basin of the Kahar and Soltanieh formations, indicating a rise in marine oxygen content. Kimura et al. (Reference Kimura, Matsumoto, Kakuwa, Hamdi and Zibaseresht1997) and Kimura & Watanabe (Reference Kimura and Watanabe2001) also demonstrated the presence of an anoxic depositional environment for the black mudrocks of the LSM in the Valiabad and Dalir sections c. 70 km to the NW of the Sarbandan section in the central Alborz Mountains (Fig. 1a). In their studied sections, the transition from the LSM to the USM was marked by a strong negative excursion in δ13C (–7 to –9 ‰). This finding is explained by the widespread oceanic oxygen deficiency immediately before the PC–C boundary (Komiya et al. Reference Komiya, Hirata, Kitajima, Yamamoto, Shibuya, Sawaki, Ishikawa, Shu, Li and Han2008; Wei et al. Reference Wei, Ling, Li, Wei, Wang, Chen, Zhu, Zhang and Yan2017; Boyle et al. Reference Boyle, Dahl, Bjerrum and Canfield2018).
Variations of the redox-sensitive element ratios including V/Sc, V/Cr, Ni/Co, U/Th and δU in the Sarbandan section. The Kahar Formation geochemical data in the Sarbandan section is from Etemad-Saeed et al. (Reference Etemad-Saeed, Hosseini-Barzi, Adabi, Sadeghi and Houshmandzadeh2015). Divisions for oxic, dysoxic and anoxic conditions are based on Och (Reference Och2011), Guo et al. (Reference Guo, Shibuya, Akiba, Saji, Kondo and Nakamura2016) and Chang et al. (Reference Chang, Hu, Fu, Cao, Wang and Yao2016).

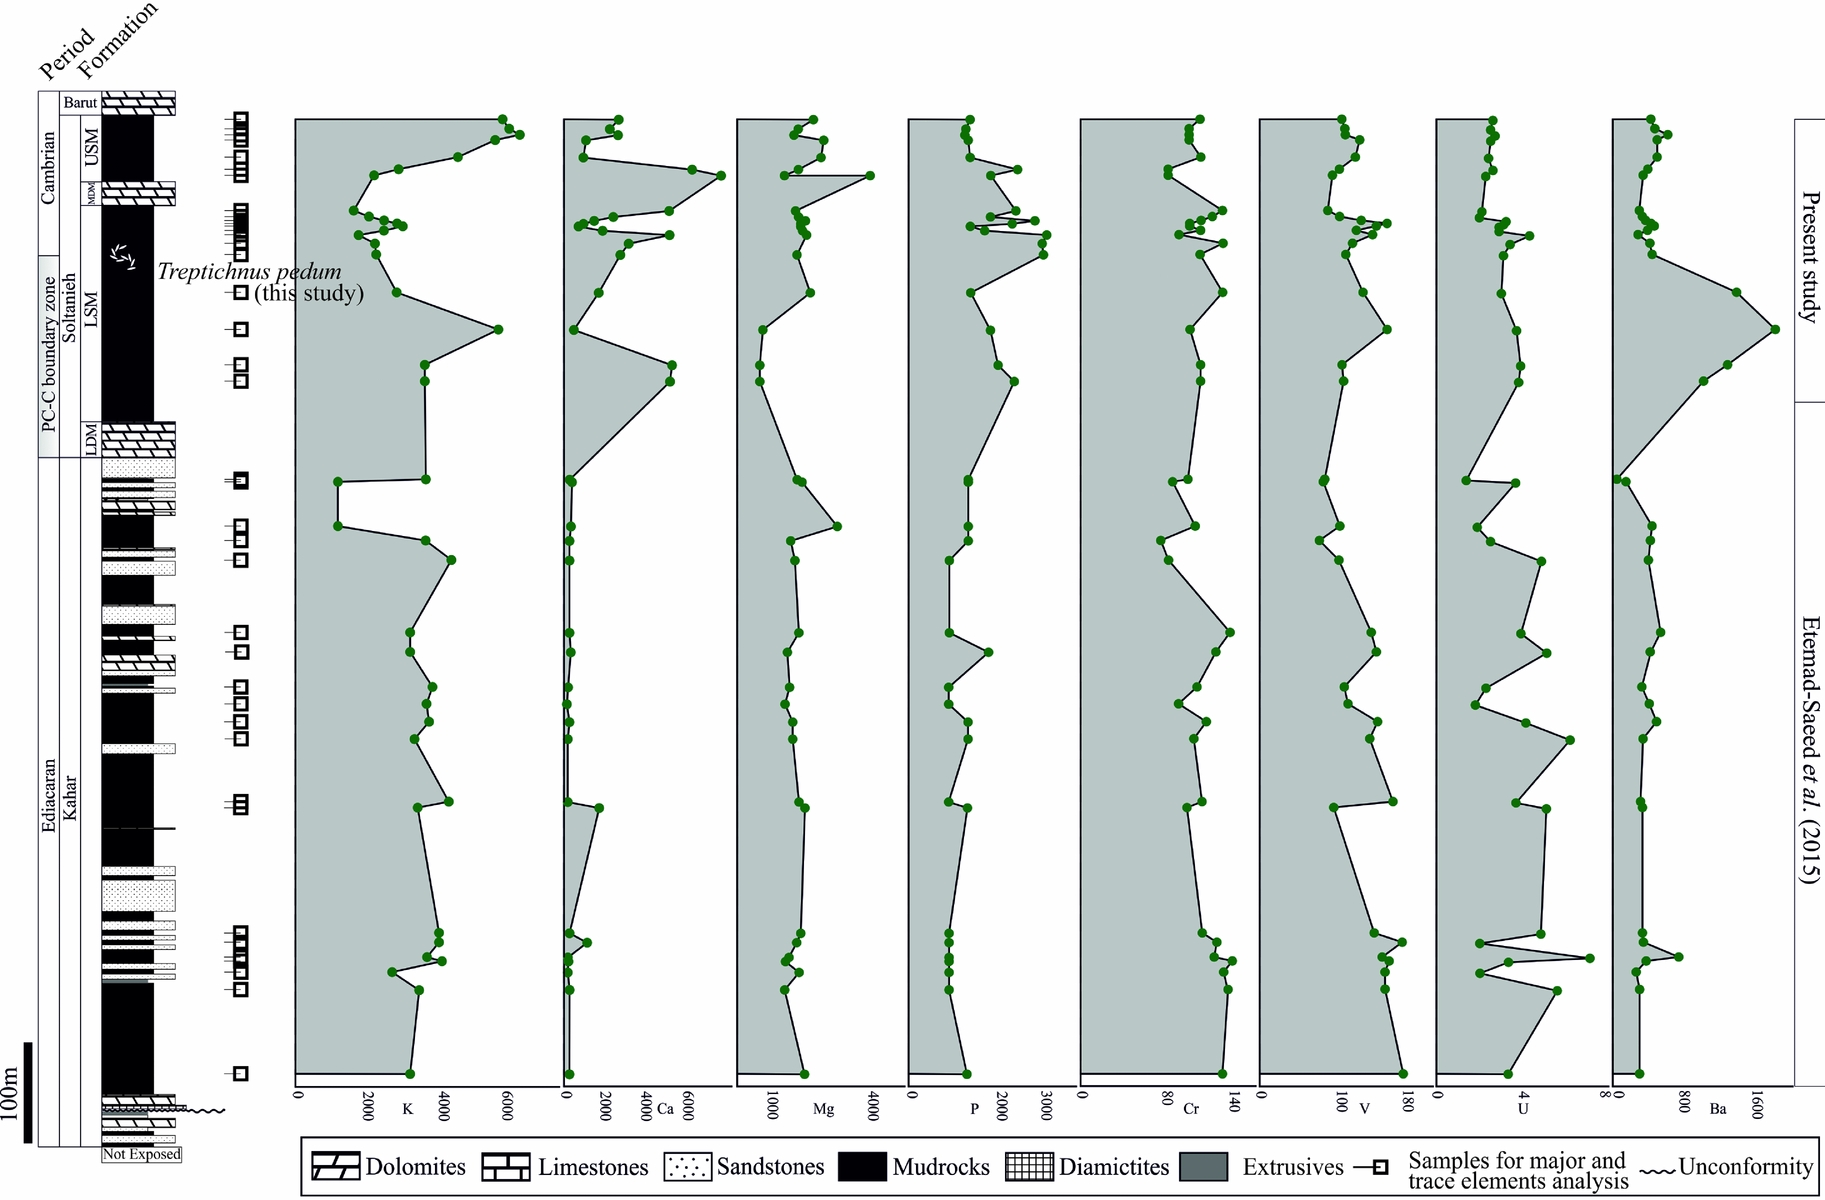
The distribution patterns of measured major (K, Ca, Mg and P) and trace (Cr, V, U and Ba) elements in the Soltanieh Formation mudrocks are graphically represented in Figure 8. Mudrocks of the USM are clearly distinct from mudrocks of the LSM by pronounced changes in K, Ca and Mg (Fig. 8). Anomalously high amounts of P, Cr, V, U and Ba components are measured in the upper parts of the LSM, near the PC–C boundary. The concentration of P in the upper part of the LSM is almost four times higher than the PAAS. Kimura et al. (Reference Kimura, Matsumoto, Kakuwa, Hamdi and Zibaseresht1997) have also reported anomalous high concentrations of Ba, Mn and P around the PC–C boundary in the Soltanieh Formation in the Valiabad and Dalir sections. Furthermore, this significant increase in the concentration of P, Ba, Zn, Ni, U and V elements across the Ediacaran–Cambrian transition are constrained from several localities of Asia, including the Lesser Himalaya (Banerjee et al. Reference Banerjee, Schidlowski, Siebert and Brasier1997) and South China (Zhai et al. Reference Zhai, Wu, Ye, Zhang and Wang2018). These remarkable variations have been attributed to an increase in the rate of nutrient supply into the oceans during this time period (Squire et al. Reference Squire, Campbell, Allen and Wilson2006). The East African Orogen, resulting from the collision between East and West Gondwanaland, was the largest Neoproterozoic – early Cambrian orogenic complex, extending from the Arabian–Nubian Shield in the north to Madagascar in the south (Stern, Reference Stern1994; Fritz et al. Reference Fritz, Abdelsalam, Ali, Bingen, Collins, Fowler, Ghebreab, Hauzenberger, Johnson, Kusky, Macey, Muhonga, Stern and Viola2013). Extreme erosion of this enormous vegetation-free mountain chain was probably responsible for an increase in the flux of nutrient elements such as P, Fe, Sr and Ca into the oceans that supported a bloom of primitive life (Squire et al. Reference Squire, Campbell, Allen and Wilson2006).
Upward variations in K, Ca, Mg, P, Cr, V, U and Ba elements across the PC–C transition in the Kahar and Soltanieh formations, measured in the Sarbandan section.

Finally, it should be considered that, although environmental factors such as increasing ocean oxygenation and seawater chemistry changes had an important role in the trace fossil abundances and complexity from the LSM to the USM, further geochemical and ecological studies are required to definitely consider explosive radiation of marine animals in the Kahar and the Soltanieh formations.
6. Conclusions
In this study, we examined the mineralogy and geochemistry of two shale members of the Soltanieh Formation, a well-preserved continuous stratigraphic record through the upper Neoproterozoic – lower Cambrian strata, in the Alborz Mountains of north Iran. The results have provided insights into the provenance and tectonic setting of the Soltanieh sediments, and also revealed geochemical variations during the PC–C transition.
1) The mudrocks of the Soltanieh Formation are mineralogically immature, and have a significant contribution of quartz and feldspar (Plg>Kf) with a minor amount of clay minerals, dominantly illite, chlorite and montmorillonite.
2) The low CIA values and the A-CN-K diagram reflect low-intensity weathering conditions and tectonically active source areas. The ICV values, together with Th/U, Th/Sc and Zr/Sc elemental ratios, indicate that the Soltanieh Formation mudrocks have low chemical maturity and are first-cycle sediments.
3) The presence of montmorillonite and zeolite in the studied mudrocks, the very low ∑REE abundances and slightly negative or no Ce anomalies, the elemental ratios and discrimination diagrams of immobile trace elements, and the chondrite-normalized REE patterns (enrichment in the LREE and flat HREE with negative Eu anomaly) all infer that the Soltanieh Formation mainly received sediments from the felsic to intermediate source rocks in an active continental margin, and was therefore deposited in a subduction-related basin neighboured by a continental magmatic arc. This finding supports the peri-Gondwanan affinity of north Iran during late Neoproterozoic – early Cambrian time.
4) The redox-sensitive elements highlight a gradual change in redox conditions from a dyoxic to an oxic environment, from the Kahar Formation and the LSM towards the USM, across the upper Ediacaran – lower Cambrian succession in the Soltanieh Formation. Furthermore, the mudrocks of the USM are enriched in P, Ba and Ca, suggesting an increase in nutrient input into the seawater during the Ediacaran–Cambrian transition, synchronous with the rapid growth of east African orogenic belts due to the collision between East and West Gondwana.
Acknowledgements
This study is funded by the Institute for Advanced Studies in Basic Sciences (IASBS), Zanjan, Iran. We gratefully acknowledge Mahdi Etemad-Saeed and Narges Sardari for their assistance during field work. We thank our colleague Abdolreza Ghods from IASBS for his constructive comments on an earlier version of the manuscript. We are grateful to the associate editor Chad Deering and anonymous reviewers for their comments, which improved the paper.