


INTRODUCTION
In African states where ethnicity matters for national politics, why does the role of ethnicity vary in regional or local elections? Specifically, why do elections in some ethnically diverse constituencies resemble an ethnic census, but not others? In answering these questions, this article makes two arguments. The first is descriptive: the political salience of ethnicity varies in subnational elections, even in broadly diverse constituencies, in ways that existing theory fails to explain. The second argument is analytical: local elections seldom replicate patterns of political competition at the national level. Instead, the disjuncture between nationally and locally relevant ethnic identities means that local constructions of ethnic difference mediate the effects of national political dynamics and affect the behaviour of voters and politicians in ethnically diverse constituencies.
In majoritarian electoral systems where ethnicity is politically salient, only a handful of ethnic identities form the basis for political party formation. Parties acquire a ‘brand’ or ‘label’ associated with the ethnicity of the politicians who create and lead them (Ferree Reference Ferree2009). When one or more locally relevant ethnic identities in a constituency are strongly linked to a party, these brands play a paramount role in local elections. Voters and politicians support the party whose brand corresponds with their identity. However, while local ethnic divisions in some regions reflect the identities that form the basis for party formation, in others party labels do not reflect locally relevant ethnicities. In these settings, the salience of ethnicity depends more on histories of ethnic antagonism or cooperation than on the connection between locally relevant ethnic identities and nationally constructed party labels.
This research – which fills a gap in existing explanations of ethnic politics – is based primarily on an analysis of the campaigns and results of the 2013 parliamentary elections in four Kenyan National Assembly constituencies. It relies on over 160 semi-structured interviews with local civil society leaders, political activists, bureaucrats and politicians, and analysis of disaggregated election results from each constituency.
The results of this discussion have relevance beyond Kenya. Kenya's majoritarian political institutions and ethnically defined political parties shape patterns of political competition at the grassroots. Such features are also common in other competitive multiparty regimes in Africa, including Nigeria, Ghana, Malawi and Zambia, where parties often form on ethnic lines and elections depend on the formation of political coalitions that cobble together multiple ethnic groups. In the sections that follow, I summarise existing research on ethnic politics and party competition in Africa, explain how this work frequently overlooks subnational differences, outline a theory accounting for this variation, describe my methods, and present case studies of four Kenyan parliamentary constituencies. The final section examines the implications for future research.
ETHNIC POLITICS IN AFRICA
Examples of ethnic voting abound in Sub-Saharan Africa, where ethnicity remains a significant feature since the widespread reintroduction of multi-party elections in the early 1990s (van de Walle Reference van de Walle2003; Cheeseman Reference Cheeseman2015). While some scholars assert that the political salience of ethnicity is rooted in the divergent interests of voters from antagonistic groups (Lieberman & McClendon Reference Lieberman and McClendon2013) and others highlight the cleavage structure of a country or region (Dunning & Harrison Reference Dunning and Harrison2010), an emerging scholarly consensus suggests that ethnicity is often instrumentalised by politicians and voters who create coalitions based on patronage to gain access to resources (Wantchekon Reference Wantchekon2003; Chandra Reference Chandra2004, Reference Chandra, Kitschelt and Wilkinson2007; Posner Reference Posner2005; Ishiyama Reference Ishiyama2012). The size of ethnic groups (Posner Reference Posner2004), their geographic distribution (Ichino & Nathan Reference Ichino and Nathan2013), and the mechanisms for linking them to political parties (Koter Reference Koter2013) all play a role in this process. This work shows that the salience of ethnicity in Africa varies dramatically across countries (Miguel Reference Miguel2004; Posner Reference Posner2004; Elischer Reference Elischer2013).
Most existing studies explain either individual vote choices or cross-national variation in ethnic salience (Posner Reference Posner2004; Bratton et al. Reference Bratton, Bhavnani and Chen2012) rather than mapping the diverse ways that ethnicity connects to partisanship at the subnational level. However, recent analyses highlight how ethnic politics vary within African countries according to local demography, geography, history and political institutions (Gibson & Hoffman Reference Gibson and Hoffman2013; Klaus & Paller Reference Klaus and Paller2017). This suggests that institutionalist explanations about the size of ethnic groups (Posner Reference Posner2004) or the viability of ethnicity as a heuristic for party formation (Chandra Reference Chandra2004) that explain the politicisation of ethnicity at the national level cannot account for subnational variation in ethnic politics.
Many ethnic groups are too small to serve as the basis for inclusion in the coalitions that politicians in winner-take-all presidential systems build as vehicles for their political aspirations. Other identities are locally relevant – they affect how people view themselves and their neighbours – but are ‘nested’ within larger ethnic categories that serve as the basis for party formation (Scarritt & Mozaffar Reference Scarritt and Mozaffar1999; Ferree Reference Ferree and Chandra2012). As a result, the features these theories predict are decisive for party formation and election outcomes do not apply to many regional or local elections.
Karen Ferree's research on South Africa demonstrates that the identity of party leaders and previous histories of ethnic politics means that parties often acquire an ethnic ‘label’ indicating who is likely to benefit should a party hold power (Ferree Reference Ferree2009). Much like the label on a consumer good, these labels brand the party and associate it with a particular ethnicity or coalition of ethnic groups. The salience of ethnic labels leads candidates and voters to join the political coalition aligned with their ethnic identity (Posner Reference Posner2005: 244–9). Additional work suggests that in African democracies, where access to ‘valence goods’ such as roads, clinics or schools remains important to voters (Bleck & van de Walle Reference Bleck and van de Walle2011), ethnically laden party labels can shape campaign strategy and voter behaviour (Chandra Reference Chandra, Kitschelt and Wilkinson2007; Ichino & Nathan Reference Ichino and Nathan2013; Horowitz Reference Horowitz2016; Gadjanova Reference Gadjanova2020).
LOCAL POLITICS AND ETHNIC VOTING
I argue that links between ethnic identities and political parties at the national level create a disconnect between locally and nationally relevant identities that, in turn, shapes the role of ethnicity in local elections. This argument applies to regimes characteristic of many contemporary African states where majoritarian institutions, the lack of a clear ethnic majority, patronage-oriented political economies and weak, personality-driven politics create incentives for politicians to organise parties based on ethnicity (Mozaffar & Scarritt Reference Mozaffar and Scarritt2005; Van de Walle Reference Van de Walle, Kitschelt and Wilkinson2007; Ferree Reference Ferree2010; LeBas Reference LeBas2011).
The ethnic identity of party leaders helps define party labels and signals to voters who will benefit should they win. In places where a party's ethnic brand is strong, such as the home region of its presidential candidate, it can sweep elections. This same party, however, will struggle in regions where its ethnic brand is unfavourable (Horowitz Reference Horowitz1985: 319–321; Posner Reference Posner2005: 99, 114, 262–4). Label creation is a complex process; often it occurs at the national level, as a handful of elite politicians form parties and negotiate alliances (Arriola Reference Arriola2013; Horowitz Reference Horowitz2016). Building strong labels, however, hinges on elites’ ability to engage local leaders and politicians, shape cultural narratives, and persuade voters that they are best positioned to assert group interests (MacArthur Reference MacArthur2008; Lynch Reference Lynch2014). The links between ethnic identities and political parties implied by these labels may constrain candidates in local elections who cannot alone change how parties are perceived in their communities.
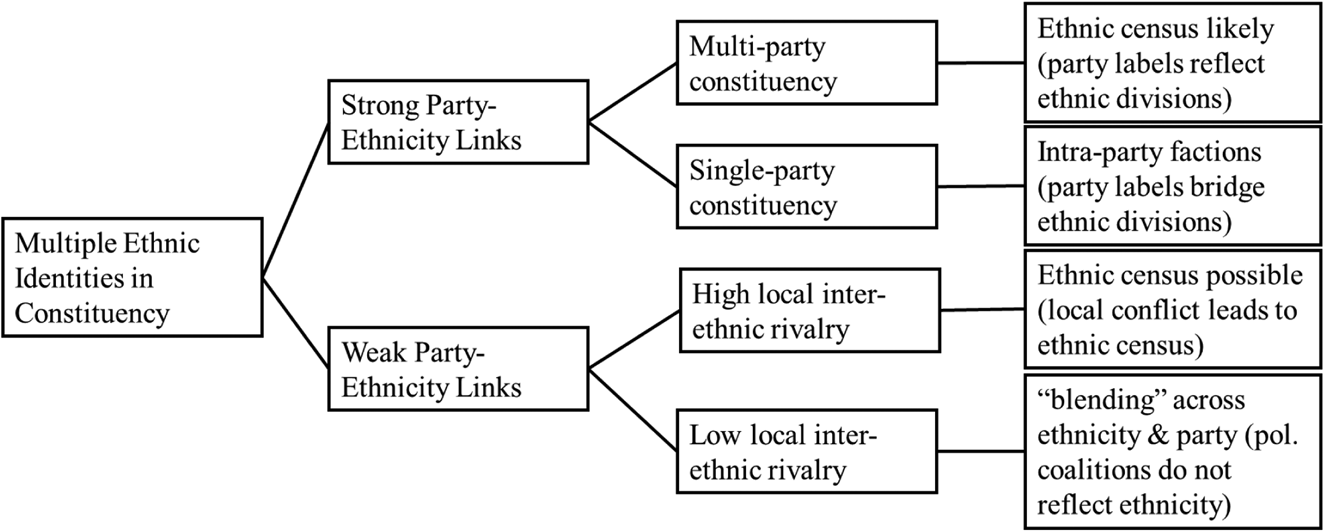
While label formation occurs ‘above’ the level of any single constituency, ethnic categorisation at the local level is far more dynamic. As a result, the ethnic identities that form the basis for party formation are not always those that matter the most to voters (Gibson & Hoffman Reference Gibson and Hoffman2013: 287). Ethnic identities that are socially salient – that matter for how voters describe themselves and their neighbours – may not be politically salient. The distinction between nationally and locally salient identities matters for local politics in the following ways (as represented in Figure 1).
Typology of patterns of competition.

In constituencies where the identities of most constituents correspond with the ethnic brands of at least one political party – that is, in which there are strong party-ethnicity links – voters are likely to evaluate candidates through the prism of party labels that provide a signal about who ‘belongs’ to the party and will benefit from its success (Ferree Reference Ferree2009; Horowitz Reference Horowitz2016). And candidates, interested in winning elections and mindful of these perceptions, gravitate towards parties aligned with the voters whom they hope to represent. There are thus two key sets of actors – voters and politicians – whose behaviours and expectations help shape political dynamics at the local level.
Whether local elections reflect multi-party competition or single-party dominance depends on how party labels map onto locally relevant ethnic identities. In regions where the brands of two or more political parties are linked to different ethnic identities, ethnic census style elections are particularly likely. Voters and politicians sort into ethnically polarised coalitions, as politicians believe the path to victory runs through the party associated with their group. Where party labels bridge ethnic identities such that the ethnicity of most residents aligns with a single party, a different pattern emerges. In this context, intra-party factionalism abounds, as candidates seek the nomination of the dominant political party. Independent candidates, or candidates from ‘outside’ parties, face an uphill battle from voters who are sceptical about their lack of affiliation with the dominant party.
In places with weak party-ethnicity links, the ethnicities of most voters are not aligned with any political party. Absent the ability to use labels as a heuristic for defining parties or the candidates who represent them, politicians define themselves, and voters make judgements about candidates, according to different criteria. Whether or not an ethnic census occurs hinges on a different set of variables than in places where party-ethnicity links are strong. In constituencies where party-ethnicity links are weaker, local histories of ethnic antagonism or cooperation are crucial in determining whether elections become an ethnic census. In situations of high ethnic antagonism, members of diverse groups perceive themselves as competitors and political discourse focuses on inter-ethnic competition; this becomes manifest in elections when voters cast ballots for candidates who represent the interests of the group, resulting in an ethnic census. In places with low levels of ethnic antagonism, where ethnic groups have a history of amicable cooperation, the salience of ethnicity in elections is muted. Elections tend to revolve around valence issues such as competence, corruption, or the incumbent's development track record, and political coalitions blend voters from different ethnic backgrounds.
RESEARCH DESIGN AND METHODOLOGY
This theory is built inductively – based primarily on case studies of National Assembly (i.e. Member of Parliament) races in four different Kenyan parliamentary constituencies during the 2013 General Election. Data come from over 160 interviews with politicians, journalists, community leaders and local government officials in Kenya from July–November 2014, June–July 2015 and June 2018. Information from these interviews was vital for ‘scoring’ the sampled constituencies on the relevant variables in this study. Respondents outlined how members of different ethnic groups in their communities related to one another and the state, and how ethnicity corresponded to patterns of support for parties or candidates. Respondents also clarified how they viewed themselves and their neighbours as ethnically distinct in ways that are obscured in national-level analyses.
The data generated by interviews varied according to the categories of respondents interviewed for the project. Many respondents were involved in campaigns for local office. Their observations inform descriptions of electoral campaigns, including candidates’ decisions about which parties to join, and the pressures they faced in making this choice. Remaining interviews were conducted with long-term residents and civic leaders with extensive knowledge of local politics.Footnote 1 These respondents offered candid descriptions of community dynamics, including legacies of inter-ethnic tension or cooperation. Except for a handful of cases (current or former politicians), respondents agreed to speak on the condition that their identity remain confidential. Interview data are complemented by the analysis of disaggregated election results and news stories from Kenyan media outlets, which confirm the narratives about party politics and ethnic relations described by interview respondents.Footnote 2 The events of the 2017 elections, after the initial rounds of fieldwork, as well as examples from other Kenyan elections, serve as supporting evidence for the arguments made here.
The focus on Kenya is driven by the salience of ethnicity in Kenyan politics, including the predominance of ethnic census-style elections at the national level (Mueller Reference Mueller2011). Moreover, while many Kenyan parliamentary constituencies are home to a single ethnic group, or to ethnic groups that are ‘nested’ within larger ethnic identities, colonial-era land seizures, patterns of labour migration and post-colonial redistribution of land have created settlement patterns that place diverse groups near one another. Collectively, these features suggest Kenya as a likely case for local ethnic census elections.
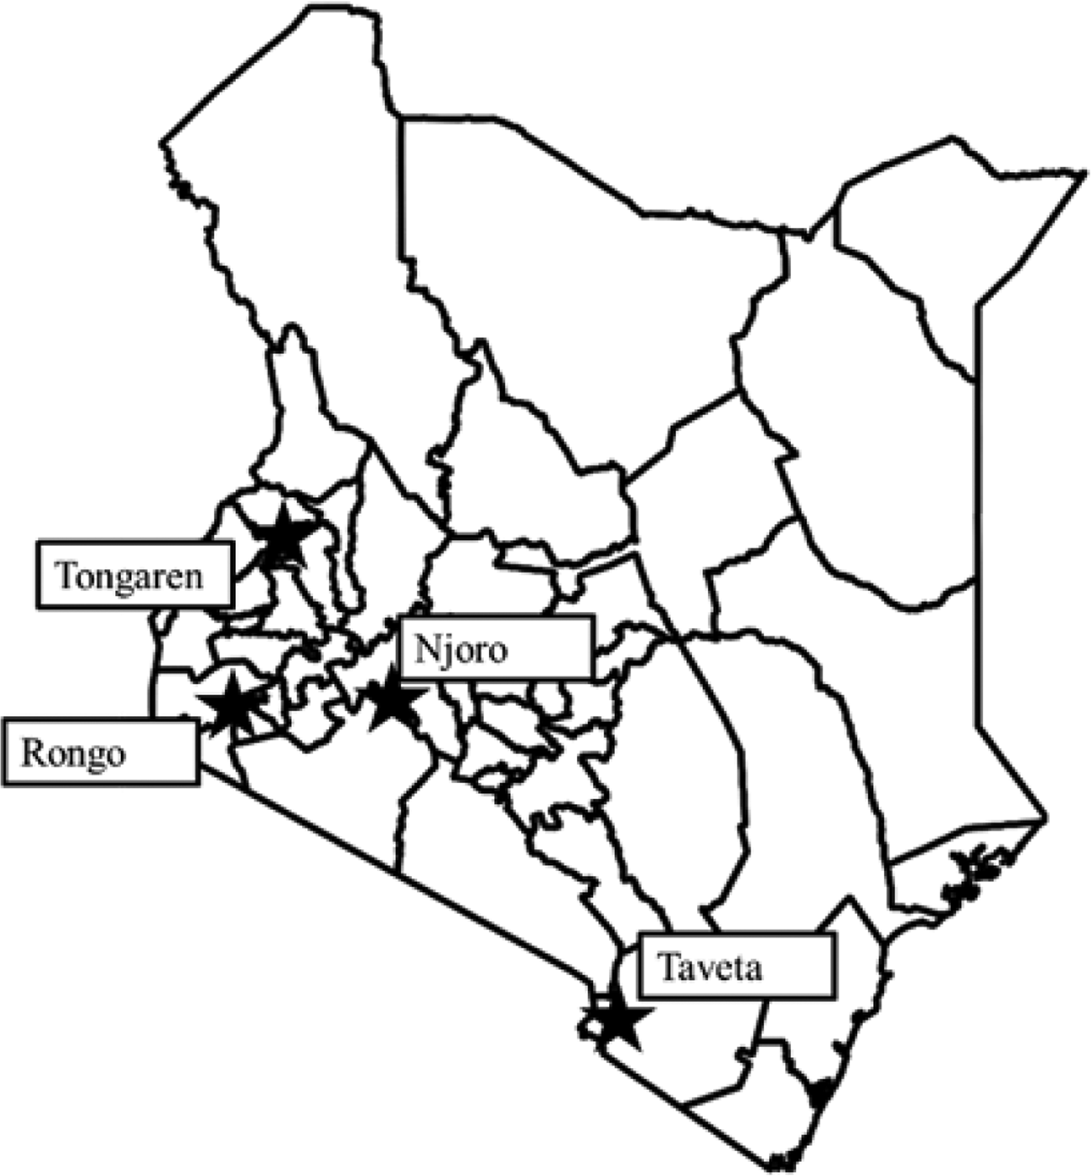
During preliminary interviews in Nairobi in 2014 I sought to identify six ethnically diverse constituencies that varied according to the salience of ethnicity in local elections. These include the four constituencies described in this paper – Njoro, Rongo, Taveta and Tongaren (see Figure 2).Footnote 3 Interviews quickly revealed that, rather than being a binary outcome (either ethnicity was a politically salient feature, leading to ethnic census outcomes, or it was not), the relationship between ethnicity and electoral politics varied systematically across constituencies in more complex ways.

While residents in each constituency profiled here distinguish between one another in ethnic terms, the political role of these identities is distinct across constituencies. In Njoro and Taveta, the 2013 parliamentary elections approximated ethnic censuses. In Rongo, competition between clans of a dominant ethnic group took place within a single party. Ethnic bloc voting was not a significant feature in Tongaren, despite widespread recognition of the constituency as ethnically diverse. The following sections explain how residents of these regions construct narratives about ethnic identity and diversity, the role of ethnic labels in shaping the partisan attachments of voters and candidates, and how the interaction of these two features affects the norms and patterns of political competition in each constituency.
LOCAL CONSTRUCTIONS OF ETHNIC IDENTITY
Although some scholars assert that most rural Kenyan constituencies are mono-ethnic, this claim belies the local ethnic differences between clans or ‘sub-tribes’ that matter for residents’ everyday interactions (cf. Horowitz Reference Horowitz2016: 335; Harris & Posner Reference Harris and Posner2019). Rural Kenyans categorise themselves and their neighbours in ethnic terms often, and in complex ways. The extent to which ethnic differences reflect local rivalries or grievances varies considerably. In some areas residents view competition for land, resources and patronage in ethnic terms while in other, equally diverse, regions ethnicity is not a vehicle for such claim-making. Moreover, the ‘nested’ nature of many ethnic identities in Kenya means that local clan divisions are often bridged by membership in a larger, nationally relevant group in ways that ameliorate local tensions. The descriptions, below, testify to the diverse ways Kenyan communities construct narratives of ethnic difference and commonality.
Njoro
Njoro, in Nakuru County, features a history of tension between its Kikuyu and Kalenjin residents – members of two of Kenya's largest ethnic groups. While other social and ethnic divisions exist, none have done as much to shape residents’ livelihoods or claims to belonging. Struggles over access to land, which was expropriated by the British for settlement by White farmers during the colonial period, form the basis of intercommunal tensions (Berman & Lonsdale Reference Berman and Lonsdale1992). Labour migration and the purchase of farms from departing Europeans after independence led to the influx of ethnic Kikuyu into the region both before and after independence, creating what residents now refer to as a ‘cosmopolitan’ mix of ethnic identities.Footnote 4
Demographic change – and apparent state support for it – became a grievance for Kalenjin in the region who felt they were the rightful heirs to the land where their ancestors lived (Lonsdale Reference Lonsdale2008; Klaus & Mitchell Reference Klaus and Mitchell2015: 629). Ethnic Kikuyu counter that their forebears came to the Rift Valley to work on farms owned by EuropeansFootnote 5 or that they purchased land in the area after independence,Footnote 6 going as far as portraying Kalenjin neighbours as interlopers settled by former President Daniel arap Moi as part of a cynical political manoeuvre.Footnote 7 Histories of intense election-related violence reinforce narratives of ethnic rivalry. Residents describe the constituency as ‘war-torn’ and ‘known for clashes’.Footnote 8 Tension is ongoing. During field research in 2015 and 2018, on two different occasions interview respondents suggested neighbours or strangers of a different ethnicity were noting our conversations with suspicion.Footnote 9
Rongo
Territory in Rongo constituency, in Migori County, was never expropriated by the British for European settlement. Rather, the colonial regime maintained the territory as part of the ‘reserves’ set aside for ethnic Luo. Luo lineage systems are highly segmented; clusters of lineage groups are nested within larger clans at higher levels of aggregation, all of which share the Luo identity and compose over 10% of the Kenyan population (Southall Reference Southall1952; KNBS 2010). This form of ethnic differentiation endures in contemporary Rongo, where clans identify with particular territories.Footnote 10
Clan distinctions help organise social and political life. Local leaders help pay for funerals, weddings or dowries, negotiate familial disputes, and deal with petty crime.Footnote 11 Clan membership plays a political role, potentially securing resources for communities whose kin win elected office.Footnote 12 However, shared Luo identity also forms the basis for claims to equitable service provision. Politicians suggest voters are sensitive to questions of equality and care about the fair division of resources.Footnote 13
Taveta
Like Njoro, Taveta residents describe their constituency as ‘cosmopolitan’, with people from diverse backgrounds migrating into the area over several decades.Footnote 14 Although the constituency lay outside the region expropriated by Britain for settler agriculture, the transformation of the area's economy after the First World War resulted in a similar labour influx (Frontera Reference Frontera1978). As sisal farming has largely ceased, many labourers and their descendants live as ‘squatters’ on plantations owned by influential politicians from ‘upcountry’.Footnote 15 As squatters, residents lack formal property rights, rendering them economically and politically vulnerable (KTN 2013; CitizenTV 2014).
Rivalry between ‘indigenous’ ethnic Taveta and other groups, mostly ethnic Kamba, affects inter-ethnic relations in the constituency. Taveta, whose ancestors’ settlement in the region dates to the pre-colonial period (Frontera Reference Frontera1978), are a small minority in Kenya – numbering just over 20,000 in the 2009 census (KNBS 2010). Ethnic divisions are manifest in tensions over access to land and political influence in the constituency. Kamba are sometimes referred to as ‘outsiders’ or accused by ethnic Taveta as having ‘come to oppress’ or to ‘sit on us’.Footnote 16 While ethnic Taveta make claims to autochthony, existing squatters in defunct sisal-growing areas reportedly worry that they will be displaced and land given to politically connected outsiders.Footnote 17
Tongaren
Tongaren, in Bungoma county, was (like Njoro) part of the colonial-era ‘White Highlands’ appropriated by the British. At Independence, land was sold to smallholder farmers from a variety of ethnic backgrounds in government-backed ‘settlement schemes’. Area residents routinely use the word ‘cosmopolitan’ to describe the constituency's ethnic diversity.Footnote 18 ‘We have the face of Kenya here’, asserts one local politician.Footnote 19 Neighbours from different ethnicities live side by side, contributing to this cosmopolitan identity. ‘Here everybody is spread out’, summarises a civil society activist.Footnote 20
When pressed, residents agree that a majority of the population identifies as ethnic Luhya: approximately two-thirds are Bukusu, with smaller minorities of Maragoli, Tachoni and other Luhya ethnic groups. Non-Luhya, including Kikuyu, Kisii and Teso residents likely number less than 10% of the population.Footnote 21 Luhya identity itself is a relatively recent construction, however, that incorporates 17 different ‘sub-tribes’ in western Kenya (Were, Reference Were1967; MacArthur, Reference MacArthur2013). Tongaren's ‘cosmopolitan’ legacy and the shared Luhya identity that encompasses most residents mitigate ethnic rivalry. Residents point out that, unlike other cosmopolitan areas in Kenya, Tongaren has not experienced ethnic violence. Nor does it experience the rivalry between Luhya groups characteristic of neighbouring constituencies.Footnote 22 ‘Here we only need common interests’, summarises one resident.Footnote 23
PARTY LABELS AND ETHNICITY IN THE 2013 ELECTION
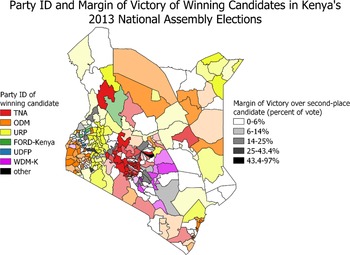
Election results do not hinge solely on local constructions of ethnic difference. The ethnic labels associated with Kenyan political parties also shape grassroots political dynamics. The importance of ethnic labels is reflected in the outcome of elections. Figure 3 presents a map of Kenya's 290 National Assembly constituencies. Colours in the map indicate the party affiliation of the winning candidates. The shading represents their margin of victory, with darker (more opaque) colours representing a larger margin of victory between the winning candidate and the candidate with the next most votes, and lighter shades representing narrower margins of victory.

In 2013, the Orange Democratic Movement (ODM) was dominant in majority-Luo areas, as indicated by the shading in the constituencies in the south-western Nyanza region. The National Alliance (TNA) party of Uhuru Kenyatta, swept the counties in central Kenya home to his Kikuyu ethnic group, and majority-Kalenjin constituencies in the Rift Valley were dominated by politicians in the United Republican Party (URP), led by Kenyatta's running mate William Ruto. Areas in western Kenya home to ethnic Luhya communities, however, tended to fragment their support: candidates from an array of parties regularly won elections at every level of government. This pattern also pervaded constituencies home to ethnic minorities in the former Coast Province, those in the far north, or in several counties circling Mount Kenya (near the centre of the country). In these regions, elections were often close, as reflected by the lighter shading on these constituencies, or a variety of political parties were successful.Footnote 24
The constituencies sampled for this project include those with strong links between the ethnicities of most voters and the ethnically fraught labels of the parties that were competitive in the constituency, as well as those where this connection was weak. In Njoro and Rongo, party-ethnicity links were strong. These links constrained local politicians, who felt bound to the party representing their ethnic group. They also influenced voters, who ‘read’ party labels in ethnic terms. In the other two constituencies – Taveta and Tongaren – these connections were less robust. Candidates for public office had greater flexibility in their choice of party, and voters’ perceptions of candidates were less tied to party labels.
Njoro
In the 2013 elections, Njoro voters supported the presidential ticket of the eventual winners, President Uhuru Kenyatta (an ethnic Kikuyu) and Deputy President William Ruto (an ethnic Kalenjin) – giving Kenyatta approximately 90% of all votes in the constituency (IEBC 2013a). While Kenyatta and Ruto forged an alliance, dubbed ‘Jubilee’, both leaders retained membership in different parties. As a result, TNA (Kenyatta) and URP (Ruto) held strong labels associating them with the Kikuyu and Kalenjin ethnicities, respectively.
The strength of party labels, and their links to the ethnic identities held by voters in Njoro, is clear to politicians and citizens alike. Njoro's MP for the 2013–17 term suggests that ethnic Kikuyu gravitated towards TNA because of Uhuru Kenyatta's popularity and ethnic Kalenjin admired URP because of William Ruto.Footnote 25 Another politician from Njoro goes further to say that the ruling party ‘belongs to His Excellency, the President’.Footnote 26 Party labels mattered in 2013 because of the cues national elites sent to voters: ‘If the parties agree’, one resident summarises, ‘then the people do too, but … when there are divisions [between leaders], it leads to war’.Footnote 27 Interview respondents often described party labels in explicitly ethnic terms, identifying them as ‘belonging’ to particular ethnic groups.Footnote 28 Reflecting this narrative, respondents believed Kalenjin supported the Jubilee Coalition in 2013 exclusively because one of their co-ethnics vied for the Vice-Presidency (Lynch Reference Lynch2014).Footnote 29 One Kalenjin politician and activist summarises that the constituency's Kalenjin voters ‘went to one person … Ruto’.Footnote 30
The strength of party labels in Njoro constrains the choices of politicians from Kikuyu and Kalenjin communities. A National Assembly candidate from a majority-Kalenjin ward describes informally polling community leaders about which party she should join in 2013; their response was: ‘which is the party of [URP leader] Ruto?’Footnote 31 Another Kalenjin politician initially planned to contest local elections before being informed by community elders that, while they wanted to support him, they would not do so unless he switched his party registration to URP.Footnote 32 A local politician from a mostly Kikuyu area in Njoro elaborates: ‘if you join a party that belongs to your tribesmen then you will carry the day’.Footnote 33 Candidates in the constituency affirmed the converse as well – joining a party that voters or elders believed represented the interests of a different ethnic group would hurt a candidate's prospects.Footnote 34
Rongo
The Orange Democratic Movement is regnant in Rongo and throughout the former Nyanza province. In 2013, ODM candidates won 30 out of 41 National Assembly seats in the region. The single-party character of Rongo is apparent to residents. Politicians, activists and civic leaders describe it as a single-party zone – highlighting how candidates from non-ODM parties are likely to lose no matter their qualifications.Footnote 35
The results of the last two parliamentary elections reflect ODM's overwhelming support in Rongo. Although ODM retained the seat in 2013 and 2017, the representative filling it changed. Amidst reports of tension with party leader Raila Odinga, the incumbent MP, Dalmas Otieno, reportedly announced he would leave ODM to start a new movement prior to the 2017 elections (Otieno Reference Otieno2017).Footnote 36 Although he returned to ODM, he no longer held a leadership position in the party.Footnote 37 Otieno lost the ODM nomination and subsequent general election in 2017 to Paul Abuor, whom he had defeated in 2013.
ODM owes its regional supremacy to Odinga's popularity and the consequent links between Luo ethnicity and the ODM brand. Rongo's current MP points out that voters feel like their ‘best hope is with a party that has Raila as a head’.Footnote 38 Another senior politician from the region argues that the ‘dominant factor [in local elections] is whether you belong to the party and whether you are loyal to the party leadership’.Footnote 39 As a result, candidates feel compelled to support the party and ride its coattails rather than face the challenge of running as representatives of what one respondent dubs ‘infiltrating parties’.Footnote 40 The ODM brand is so strong that running as an independent candidate, without the backing of any political party, has ‘fewer liabilities’ than contesting elections as a member of a non-ODM party.Footnote 41
Taveta
Unlike in Njoro or Rongo, where residents’ ethnic identities neatly match the ethnic content of party labels, the identities of most Taveta residents do not reflect the ethnic labels of major parties. The largest ‘non-indigenous’ ethnic group in Taveta is the Kamba. While Kamba politician Kalonzo Musyoka's Wiper Democratic Movement-Kenya (simply known as ‘Wiper’) possessed the strongest claim to being a ‘Kamba’ party, it failed to establish the dominance in majority-Kamba regions that URP and ODM enjoyed in their strongholds. Respondents in Taveta do not mention Musyoka or his party when talking about politics in the constituency, and Wiper fared poorly in Taveta's 2013 elections. As a minority identity, meanwhile, the ‘indigenous’ Taveta are too few to serve as the basis for a political party. Ethnic Taveta respondents emphasise this fact in conversations about local and national politics.Footnote 42 As a result, links between locally relevant ethnic identities and national party labels are weaker in Taveta than in Njoro or Rongo.
Precisely because the Taveta are such a small ethnic group, the area MP, a multi-term incumbent, has greater flexibility regarding her choice of political party. The MP has a track record of successfully bucking trends in her region, winning election as a pro-government MP in 2002 – a time when ‘even a stone’ could have won a parliamentary seat for the opposition.Footnote 43 Since 2002, Taveta's MP has served continuously, as a member of three different parties. In 2013, she was the sole successful TNA National Assembly candidate in Taita Taveta County, and one of just three winning TNA candidates in Kenya's coastal region. Her supporters view her autonomy as a way of bringing development resources to the constituency – what one resident describes as ‘the fruits of being on the government side’.Footnote 44 She also demonstrated independence between the 2013 and 2017 elections, when she briefly stated her intention to defect from the Jubilee coalition before being cajoled to rejoin the party (Nguta Reference Nguta2017). This contrasts with the constraints imposed by the ethnicity-party nexus in Rongo or Njoro, where candidates believe they must represent ‘their’ ethnic group's party if they hope to win. Rather than being hemmed in by party labels dictating which party can credibly represent her ethnic group, Taveta's MP has room to manoeuvre.
Tongaren
Multiple parties were competitive in Tongaren in 2013; these parties held tacit ethnic labels that sent messages about which ethnic groups the parties represented. However, these signals were not as robust or clear as in Njoro or Rongo. Because most residents identify with one of the 17 different Luhya ethnic groups, and because the Luhya are a ‘swing group’ in Kenyan politics, a variety of parties could credibly claim to represent residents. For example, FORD-Kenya and New FORD-Kenya both rely on support from Bukusu voters (Cherono Reference Cherono2016).Footnote 45 And both ODM and the United Democratic Forum Party (UDFP) won seats in demographically similar constituencies neighbouring Tongaren. Each of these parties has an ethnic label or brand associated with it. But, unlike in Njoro or Rongo, these labels afford politicians and voters a degree of flexibility. Given the fragmentation of popular Luhya politicians into different parties, and even different umbrella coalitions, each is competitive in the wider region, and in Tongaren itself. This flexibility is summarised by one local politician who claims that he was ‘rigged out’ of the FORD-Kenya primary but wanted to run in the general election: voters, he claims, ‘asked … “come out with any party, we shall vote for you”’.Footnote 46
PATTERNS OF POLITICAL COMPETITION
How ethnicity intersects with party labels ultimately influences the patterns of political competition in National Assembly elections. When party labels connect strongly to local ethnic identities, party identification trumps local ethnic divisions: whether an ethnic census occurs depends on whether these labels reinforce locally relevant ethnic divisions or whether they bridge these divides. When locally relevant ethnic identities do not connect with party labels, grassroots histories of ethnic rivalry or antagonism play a stronger role in shaping patterns of political competition.
Njoro: ethnic census predominates in 2013
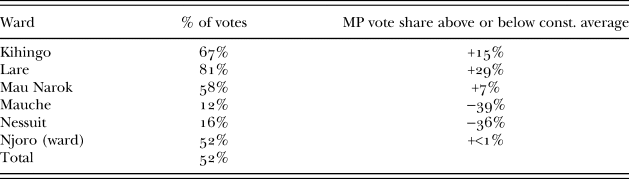
Results from Njoro's 2013 election suggest that the poll became a de facto ethnic census. Njoro's MP won re-election with just over 50% of the vote; his nearest rival, the URP candidate, garnered approximately 20% of all valid votes. Table I shows the incumbent MP's vote share by ward in the 2013 election, and in the constituency overall.Footnote 47 Stark geographic segregation between ethnic communities in Njoro indicates that these results are evidence of ethnic census-style bloc voting. In Kihingo and Lare wards, which are overwhelmingly home to ethnic Kikuyu, the MP received over two-thirds of all votes cast. In Mauche and Nessuit, by contrast, which are home to ethnic Kalenjin, the MP received 12% and 16%, respectively, of all votes.
MP's 2013 vote share by ward (Njoro).

Other political divisions exist within Njoro: ethnic Kikuyu whose former Mau Mau forebears settled in impoverished areas after independence express frustration at the attention paid to co-ethnics in more prosperous areas.Footnote 48 Similarly, ‘indigenous’ Ogiek distinguish themselves from other Kalenjin groups who arrived in the region more recently.Footnote 49 Yet these divisions are not reflected in party politics, as voters and politicians sort themselves into ethnically defined coalitions based on the brands projected by national political parties.
Dynamics in 2017 differed dramatically from 2013. Before the 2017 election, TNA and URP formally merged into a single party – Jubilee. The label that branded Jubilee incorporated both Kikuyu and Kalenjin identities. One politician and activist interviewed in 2018 notes that ‘We have only Jubilee in Njoro … because of [party leaders] Uhuru and Ruto’.Footnote 50 The Jubilee party nominations were hotly contested. The incumbent MP lost the party primary, facing opposition from several strong challengers.Footnote 51 The party's nominee was the same candidate – a resident of a Kalenjin-majority community – who had run on the URP ticket in 2013 and lost. While detailed results of this primary are unavailable, the incumbent MP and a handful of Kikuyu challengers likely split the votes of most Kikuyu, while Kalenjin voters rallied around the candidate representing their group.Footnote 52 Despite facing a strong challenger in the general election – an ethnic Kikuyu – the Jubilee candidate received active support from Kenyatta and Ruto, who campaigned on her behalf.Footnote 53 Buoyed by this support and the Jubilee party label, she won easily. The shift in political dynamics between 2013 and 2017 speaks to the power of party labels to shape outcomes in communities that are home to ethnic groups whose identity is reflected in a party's brand.
Rongo: intra-party factionalism predominates
Party labels also play a meaningful role in determining patterns of ethnic voting in Rongo, although outcomes differ substantially from Njoro. In Rongo, politicians compete for support from Luo clans to become the constituency's standard-bearer. The popularity of Raila Odinga's ODM ensures that competition takes place within the party itself; other parties cannot make inroads, according to respondents.Footnote 54 Clan rivalries and personal disputes play a major role in determining the outcome of competitive primaries, while in the general election, ODM's candidate holds a significant advantage.
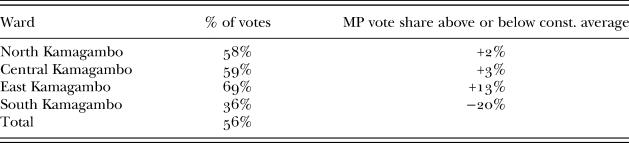
According to Rongo's current MP, as early as two years before a general election, prominent clans will urge a local notable to begin campaigning for office, only for the field to narrow several months before the election.Footnote 55 Candidates from clans that lack ‘leadership’ – framed as the ability to deliver material resources to potential voters – are swiftly winnowed.Footnote 56 ODM parliamentary aspirants leverage their relationships with different lineage groups or clans in hopes of building a successful coalition.Footnote 57 This takes place on an especially granular level: support is built up from the village, with personal ties, rather than ideological differences, mattering most.Footnote 58 As one civil society representative from Rongo points out: ‘You know blood is thicker than water. Even if you are my brother and you go wrong [I won't desert you]’.Footnote 59 Members of clans look to elders or educated ‘opinion leaders’ to help determine for whom they should vote: ‘People in the community don't decide on their own’, summarises a local government official.Footnote 60 These patterns are reflected in Table II, which breaks down the 2013 general election results by ward.Footnote 61 The 2013 incumbent fared well in East Kamagambo ward (where his home is located) and poorly in South Kamagambo (home to the challenger).
MP's 2013 vote share by ward (Rongo).

Overarching connections to ODM and a shared Luo identity render communities ‘up for grabs’ by local politicians in Rongo. Because of this, political coalitions in the constituency do not form on the same stable, ethnically polarised basis as do those in Njoro or Taveta. While the MP has a core of support amongst a few Luo clans, this core is not as large nor as robust as in Njoro or Taveta. The result is a more dynamic system of intra-party factionalism where politicians appeal to grassroots leaders of geographically circumscribed Luo clan groups.
Taveta: ethnic census with weak party labels
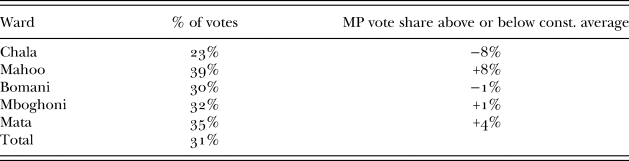
Most interview respondents in Taveta suggest that the 2013 parliamentary elections approximated an ethnic census. They express the sentiment that voters cast ballots for co-ethnics: ‘even if you're suitable and able [as a candidate] … you are likely to lose … if your tribe's population is low’, summarises one grassroots civil society leader.Footnote 62 In 2013, ethnic Taveta reportedly voted en masse for the current MP, representing TNA.Footnote 63 Election results themselves do not signal this as clearly. As Table III illustrates, the MP, who serves as the leading Taveta political figure, fared well in the wards where her co-ethnics predominate – particularly Mahoo and Mboghoni – and did less well in Chala ward, where more ethnic Kamba live.Footnote 64 However, the table does not signal the presence of ethnic bloc voting as clearly as in Njoro.Footnote 65
MP's 2013 vote share by ward (Taveta).

To the extent that these election results do approximate an ethnic census, interview data suggest that this occurs for different reasons than in Njoro. The ethnic salience of party labels does not drive the alignment of ethnicity and party preference in Taveta. Over the course of her career, Taveta's MP has effectively presented herself as the champion of her Taveta co-ethnics.Footnote 66 To her supporters, the MP is ‘an iron lady’, who ‘has really fought for Taveta’.Footnote 67 These supporters may at times view non-Taveta candidates as outsiders who are trying to seize the ‘rights’ of ethnic Taveta; they question why members of other ethnic groups should try to rule over the Taveta in their ‘own’ place, or say that ‘[it would be best if] every place … [is] represented by the indigenous of that place’.Footnote 68 For their part, some ‘outsiders’ suggest that the Taveta ‘are the ones who command the shots here’ and allege that they tell non-Taveta during campaigns: ‘you either vote for me or you go to your motherland’.Footnote 69 Rather than a preoccupation with ethnically defined party labels, these narratives suggest the supremacy of local concerns about who belongs in the region and deserves to represent it.
The dynamics that predominated in Taveta in 2013 occur in other Kenyan regions home to ethnic minorities that also have histories of ethnic rivalry. Politics in Tana River County in 2013 followed a similar pattern to Taveta. Election-related violence between the pastoralist Orma and Wardei ethnic groups, and the agriculturalist Pokomo, reflected a history of tension between these groups over land use and representation (Malik Reference Malik2018).Footnote 70 This rivalry manifested in the election, as Orma and Wardei politicians fielded a common slate of candidates and swept the polls (a significant power shift). Significantly, the successful candidates represented multiple different political parties despite drawing their support from members of the same groups. As in Taveta, party labels mattered less than individual ethnic identity in forging a successful political coalition.
Tongaren: diversity without an ethnic census
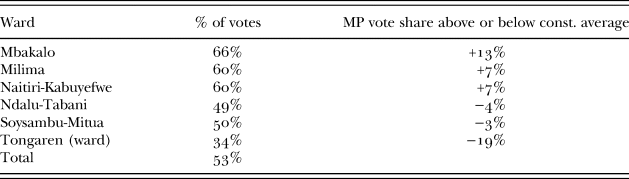
In Tongaren, links between party labels and ethnic identities are weak, and the constituency lacks a history of ethnic conflict. As a result, elections do not become the kind of ethnic censuses characteristic of Njoro or Taveta, nor does the intra-party factionalism that prevails in Rongo occur. Results from the 2013 election, in Table IV, show that the MP's support varied across wards; however, this variation does not appear to reflect variation in support across ethnic groups.Footnote 71 The MP fared worst – drawing just 34% of all valid votes cast – in the ward of Tongaren, which is home to a perennial opponent of the MP, although this outcome has more to do with voters’ support for a neighbour who lives nearby than with ethnic bloc voting.Footnote 72 The MP's best results came in Mbakalo ward, where, according to him, the MP receives support from members of a non-Bukusu Luhya minority groupFootnote 73 – one whose ethnic identity is not reflected in the “brand” represented by the MP's party (FORD-Kenya).
MP's 2013 vote share by ward (Tongaren).

More telling than election results are the narratives about ethnicity and party competition that residents of Tongaren present when discussing local politics. They routinely assert that competition between political parties is not based on ethnicity.Footnote 74 One local school official summarises the politicisation of ethnicity in Tongaren: ‘no, we don't have that bit’.Footnote 75 Another describes how the ‘voting pattern [in Tongaren] is not based mainly on tribal clannism’.Footnote 76 Even critics or rivals of Tongaren's MP and his party hasten to point out that elections there do not hinge on ethnic differences between Bukusu and non-Bukusu voters.Footnote 77 Instead Tongaren's status as a former ‘settlement scheme’ is essential in creating this pattern of political competition. As a ‘no man's land’, no single community can dominate Tongaren's politics.Footnote 78 This is also the explanation offered by the area MP as to why ethnicity plays ‘very little’ role in the area's politics: ‘it's a settlement scheme. All tribes are settled there’.Footnote 79
The minimal role of ethnicity in Tongaren is evinced by the ambiguous ethnic identity of the area's MP. Although most Tongaren residents are ethnic Bukusu, the current MP is not – nor was his closest challenger in the 2013 National Assembly election.Footnote 80 This fact, however, only came to the MP's attention when he first ran for Parliament.Footnote 81 The MP's ethnic ambiguity is embraced by many people from the area. They suggest that the MP is ‘neutral’ because of his minority ethnic status in the constituency, or that ‘his people are not here’, or they describe him as being assimilated by Bukusu voters but not ‘Bukusu Bukusu’.Footnote 82
DISCUSSION AND CONCLUSION
The four constituencies described above exhibit different patterns of political competition in parliamentary elections. Njoro resembled an ethnic census election in 2013. Ethnic Kikuyu voted for the incumbent while ethnic Kalenjin supported a challenger from the party associated with their ethnic group. Rongo's election reflected intra-party ethnic factionalism, as politicians sought the endorsements of Luo clan leaders and local notables in the hopes of winning the ODM party nomination. Ethnicity appears to have been highly salient in Taveta as well. However, competition between ethnic groups stemmed from local ethnic antagonisms – the way that ‘indigenous’ Taveta and ‘outsiders’ saw themselves in competition with one another – rather than how residents with these ethnic identities took cues from party leaders with whom they shared an ethnic identity. Finally, in Tongaren, perceptions of the constituency as a bastion of ‘cosmopolitan’ ethnic harmony and the disconnect between locally relevant ethnic identities and national party labels ensured support for candidates was not based primarily on ethnicity.
In principle, there are alternative explanations for the outcomes described here, but none best fit the data. Accounts of inter-ethnic conflict sometimes focus on ‘distance’ – the degree to which groups are culturally or linguistically distinct (Fearon Reference Fearon2003). Both Njoro and Taveta, the two ethnic census cases, are home to groups that are indeed culturally distinct, while majorities in Rongo and Tongaren hold identities that bridge local differences. However, the shift in Njoro's politics (and those of similar constituencies in the Rift Valley) from 2013 to 2017 renders this explanation less persuasive. Moreover, Tongaren stands out from its neighbours, including Webuye East – a demographically similar constituency where legacies of ethnic rivalry ensure that parliamentary elections more closely resemble the type of ethnic census seen in Taveta.Footnote 83 A second alternative explanation might focus on the effects of colonialism or land tenure regimes (e.g. Acemoglu et al. Reference Acemoglu, Johnson and Robinson2001). However, the two constituencies (Njoro and Tongaren) where post-colonial ‘settlement schemes’ returned land to African residents after colonial occupation have radically different political outcomes, as do the two constituencies (Rongo and Taveta) that lay outside Kenya's colonial ‘White Highlands’. This difference is rooted in the relative strength of party-ethnicity links there, as well as the extent of local conflict. How access to land and wealth leads groups to define their interests as zero-sum is an important question. However, it is the emergence of such a narrative, rather than the presence of certain colonial-era characteristics, that shapes the behaviour of politicians and voters.
Three closing lessons for the study of politics in ethnically diverse developing democracies emerge from this analysis. First, and most fundamentally, local politics can operate according to very different rules than national politics. Although presidential elections in Kenya reflect the stereotypical ethnic census model, regional or local races rarely replicate national politics. ‘Cosmopolitan’ constituencies like Njoro in 2013, in which parties closely aligned with well-defined ethnic groups compete to turn out voters, are the byproducts of specific historical and political circumstances. However, members of ethnic groups whose identities are reflected in national party labels seldom live alongside one another. There are far more ‘non-cosmopolitan’ constituencies like Rongo, where politics involves rivalry between elites who leverage support from local leaders to position themselves as the authentic representative of the larger community. And to the extent that ethnic bloc voting occurs in ‘cosmopolitan’ Taveta, it happens because ethnic Taveta and non-Taveta groups have constructed their identities in opposition to one another, rather than because of how these identities have become relevant to forming political parties.
Purely instrumental models of ethnic politics that highlight the use of ethnicity as an identity marker for creating minimum winning coalitions, while parsimonious, fail to capture the ways in which local constructions of ethnicity and articulations of belonging matter in shaping political outcomes. In places where locally relevant identities are nested within larger categories, as in Rongo or Tongaren, belonging to this larger category can mitigate local divisions and prevent the formation of rigid factions based on ethnicity. Leaders from minority segments of the larger ethnic community have greater flexibility in building successful coalitions. In addition, the contrast between Taveta and Tongaren suggests that how residents access land plays a key role in determining whether local ethnic distinctions become salient political cleavages. While beyond the scope of this paper to examine in detail, this finding connects to an important literature on the political effects of land tenure regimes in Africa and beyond (Boone Reference Boone2014; Klaus & Mitchell Reference Klaus and Mitchell2015).
Second, local patterns of political competition can change dramatically between elections. As Njoro demonstrates, the decisions of influential, nationally prominent politicians can impact political competition at the grassroots. When URP and TNA merged to form a single party in advance of the 2017 elections, Njoro's parliamentary race changed from an ethnic census to the intra-party ethnic factionalism characteristic of the parliamentary races in Rongo. Kenyatta and Ruto's decision to formally merge their parties transformed Njoro from a constituency where multiple parties link to two or more local ethnicities, to one where affinity for a single party bridges ethnic distinctions. This change ultimately affected the outcome of the election. The challenger who lost in 2013 was victorious in 2017. Alliances between Kikuyu and Kalenjin elites did not resolve contentious local issues or erase histories of ethnic violence; however, this fusion did contain meaningful political competition within the ruling party and ensured an uneventful general election.
Third, these cases suggest that politicians from ethnic minorities have substantially greater flexibility in their choice of party than those from a country's largest ethnic groups. Politicians in Kikuyu, Luo or Kalenjin-majority communities all felt constrained in their choice of party. Facing pressure from both above (national leaders) and below (their own constituents) they were forced to adapt to the constraints put in place by party leaders and coalition formateurs with whom they shared an ethnic identity. By contrast, as the case of Taveta's MP demonstrates, politicians from ethnic minority communities seldom face these pressures. Minority groups may have limited leverage or influence in national politics – putting them at an extreme disadvantage in negotiations over the composition of political parties or coalitions. However, their comparatively small size makes it easier for local politicians to position themselves as the group's spokesperson or as defenders of local interests.
While ethnicity remains a key feature in the politics of many diverse, newly democratic regimes, the ethnic labels assigned to political parties in national races do not always match the ethnic categorisations that residents use to describe themselves or their neighbours. As a result, the variables that render ethnicity salient in national elections do not always matter for regional or local elections. A candidate's own ethnic identity, the signals sent by her party label, and her personal connections with voters and opinion leaders all shape her viability as a candidate. The relative weight of these characteristics differs across types of constituencies. On occasion, locally relevant ethnic distinctions match nationally relevant ones, reflected in party politics. In these settings an ethnic census is particularly likely. However, because these circumstances are not universal, and may be quite uncommon, ethnic censuses are far from ubiquitous.